Tài liệu Báo cáo khoa học: Unfolding and aggregation during the thermal denaturation of streptokinase pptx
Bạn đang xem bản rút gọn của tài liệu. Xem và tải ngay bản đầy đủ của tài liệu tại đây (678.61 KB, 13 trang )
Unfolding and aggregation during the thermal denaturation
of streptokinase
Ana I. Azuaga
1
, Christopher M. Dobson
2
, Pedro L. Mateo
1
and Francisco Conejero-Lara
1
1
Departamento de Quı
´
mica Fı
´
sica e Instituto de Biotecnologı
´
a, Facultad de Ciencias, Universidad de Granada, Granada, Spain;
2
Oxford Centre for Molecular Sciences and New Chemistry Laboratory, University of Oxford, UK
The thermal denaturation of streptokinase from Strepto-
coccus equisimilis (SK) together with that of a set of frag-
ments encompassing each of its three domains has been
investigated using differential scanning calorimetry (DSC).
Analysis of the effects of pH, sample concentration and
heating rates on the DSC thermograms has allowed us to
find conditions where thermal unfolding occurs unequivo-
cally under equilibrium. Under these conditions, pH 7.0 and
a sample concentration of less than %1.5 mgÆmL
)1
,or
pH 8.0, the heat capacity curves of intact SK can be quan-
titatively described by three independent two-state transi-
tions, each of which compares well with the two-state
transition observed for the corresponding isolated SK
domain. The results indicate that each structural domain of
SK behaves as a single cooperative unfolding unit under
equilibrium conditions. At pH 7.0 and high sample con-
centration, or at pH 6.0 at any concentration investigated,
the thermal unfolding of domain A was accompanied by the
time-dependent formation of aggregates of SK. This
produces a severe deformation of the DSC curves, which
become concentration dependent and kinetically controlled,
and thus precludes their proper analysis by standard
deconvolution methods. A simple model involving time-
dependent, high-order aggregation may account for the
observed effects. Limited-proteolysis experiments suggest
that in the aggregates the N-terminal segment 1–63 and the
whole of SK domain C are at least partially structured, while
domain B is highly unstructured. Unfolding of domain A,
under conditions where the N-terminal segment 1–63 has a
high propensity for b sheet structure and a partially formed
hydrophobic core, gives rise to rapid aggregation. It is likely
that this region is able to act as a nucleus for the aggregation
of the full-length protein.
Keywords: protein unfolding; protein aggregation; differen-
tial scanning calorimetry; streptokinase; domains.
Streptokinase (SK) is a bacterial exoprotein from Strepto-
coccus equisimilis consisting of a single chain of 414 amino
acid residues [1]. SK and human plasminogen form an
equimolar high-affinity complex that directly catalyzes the
proteolytic conversion of plasminogen to plasmin [2]. The
domain organization of SK has been delineated previously
by a combination of limited proteolysis studies and
biophysical methods [3,4] and confirmed later in the crystal
structure of the complex between SK and the catalytic
domain of plasmin, also known as microplasmin [5]. SK
consists of three well-defined domains (A, B and C)
consecutive in the sequence, and an unstructured tail at
the C-terminus [3,5]. The three domains are folded similarly
and the crystal structure shows few contacts between them
[5], consistent with the high flexibility of the isolated protein
in solution [6]. SK domains play diverse and complementary
roles in SK–plasminogen complex formation, in the
generation of the proteolytic active site in the plasminogen
moiety and in substrate plasminogen docking and process-
ing by the activator complex [3,7–12].
A variety of techniques, including DSC, CD and NMR,
have been used previously to investigate the thermal
unfolding and stability of intact SK and a number of
fragments prepared either by limited proteolysis or recom-
binant methods [4,13–20]. The unfolding profiles of intact
SK have been interpreted in the literature as consisting of
one, two, three or even four independent transitions,
depending on the experimental conditions and on the
technique used. These results have led to significant
discrepancies between different studies in the number of
unfolding units present in the SK structure. Furthermore,
under some experimental conditions the correspondence
between the number of structural domains (three) and the
number of unfolding transitions observed (up to four)
remains unclear.
The aim of this work was to obtain new evidence that
could serve to shed light on the interpretation of the
thermal transitions of SK and their correspondence with its
structural domains. We have investigated the thermal
denaturation of SK and a set of fragments corresponding
to isolated domains using DSC at several pH, scan rate
and sample concentration values. The thermal denatura-
tion profiles are reinterpreted in the light of new evidence
obtained in the present work together with the results of
Correspondence to F. Conejero-Lara, Departamento de Quı
´
mica
Fı
´
sica e Instituto de Biotecnologı
´
a, Facultad de Ciencias,
Universidad de Granada, Granada, 18071 Spain.
Fax: + 34 958272879, Tel.: +34 958242371,
E-mail:
Abbreviations:SK,Streptococcus equisimilis streptokinase; SKA,
recombinant SK fragment of sequence 1–146 plus an N-terminal
methionine; SKA1, SK fragment of sequence 1–63; SKB, SK fragment
of sequence 147–287; SKC, SK fragment of sequence 288–380; SKBC,
SK fragment of sequence 147–380; DSC, differential scanning calori-
metry; ESI-MS, electrospray ionization mass spectrometry; ANS,
8-anilino-1-naphthalenesulfonic acid.
(Received 21 January 2002, revised 14 June 2002,
accepted 11 July 2002)
Eur. J. Biochem. 269, 4121–4133 (2002) Ó FEBS 2002 doi:10.1046/j.1432-1033.2002.03107.x
previous studies. We demonstrate that under certain
experimental conditions, where thermodynamic equilib-
rium is unequivocally established within the whole
temperature range of the DSC experiments, the unfolding
profiles of SK are quantitatively described by three
independent two-state transitions. In contrast, under other
conditions of pH and moderate-to-high sample concentra-
tions, time-dependent, transient protein aggregation occurs
during the thermal denaturation of intact SK and of the
isolated A domain. The presence of these aggregation
processes has a profound effect on the DSC curves and
precludes their analysis by standard equilibrium deconvo-
lution methods. The results presented here on the thermal
denaturation of SK and its domains help to clarify
inconsistencies existing in previous reports concerning the
number of cooperative folding units in this multidomain
protein. We have also carried out a preliminary character-
ization of the thermally induced aggregation of SK using a
variety of techniques. The results provide us with some of
the properties of these high molecular mass aggregates and
help to delimit the regions of the SK sequence responsible
for aggregation.
MATERIALS AND METHODS
Protein sample preparation
Purified streptokinase from culture filtrates of S. equisim-
ilis was supplied by SmithKline Beecham Pharmaceuticals
(Gronau, Germany). The protein purity (assessed by SDS/
PAGE) was greater than 95%. SK fragments corres-
ponding to the sequences 1–63 (SKA1), 147–287 (SKB),
288–380 (SKC) and 147–380 (SKBC) were obtained by
proteolytic cleavage of the intact protein and purified to
homogeneity as described elsewhere [3]. The recombinant
Met-SK1-146 (SKA) fragment corresponding to SK
domain A was cloned, overexpressed in Escherichia coli
cells and purified as described previously [19]. All samples
were stored frozen at )20 °C. All chemicals used were of
analytical grade.
Prior to the experiments, protein samples were extensively
dialysed against the appropriate buffer at 4 °C. Sample
concentrations were determined by absorbance at 280 nm,
using the following extinction coefficients (e
0.1%
), which
were determined here as described by Gill & von Hippel
[21]: intact SK, 0.72; SKA1, 0.84; SKA, 0.60; SKB,
0.62; SKC, 0.72; SKBC, 0.73. Freshly purified protein
samples were confirmed as monomeric by gel-filtration
chromatography.
Differential scanning calorimetry
Calorimetric experiments were made using a DASM4
instrument [22]. DSC scans were conducted between 0 and
110 °C. Instrumental baselines, obtained by filling both
calorimeter cells with the corresponding buffer, were
systematically subtracted from the sample experimental
thermograms. The reversibility of protein denaturation
was assessed by comparing the thermograms obtained in
two consecutive scans with the same sample. The occur-
rence of time-dependent denaturation processes accom-
panying the thermal unfolding was investigated by
repeating the DSC experiment using different heating
rates within the range 0.25–2.0 °CÆmin
)1
[23,24]. DSC
traces were corrected for the effect of the calorimeter
response as reported elsewhere [25]. The temperature
dependence of the molar partial heat capacity, C
p
,ofthe
proteins was calculated from the DSC data as described
elsewhere [26], using a partial specific volume of
0.73 mLÆg
)1
, which is the average value observed for
globular proteins. For thermal unfolding occurring at
equilibrium, the C
p
curves of single-domain fragments
were fitted using the two-state model as described
elsewhere [27]. In these analyses, the C
p
functions of the
native states are assumed to be linear, whereas those of
the unfolded states are described by quadratic functions;
the latter were determined from the sequence of each SK
fragment according to Makhatadze & Privalov [28]. For
the multidomain proteins, the equilibrium C
p
curves were
fitted to the sum of a number of two-state transitions. In
these fittings the heat capacity change, DC
p
,forthe
unfolding of each domain was fixed by using the values
obtained from the analysis of the C
p
curves of the
corresponding single-domain, isolated fragment.
Gel-filtration chromatography
Aggregation of intact SK induced by heating at pH 7.0
was checked by gel-filtration chromatography, using a
1 · 30 cm Superose-12 column (Pharmacia, Uppsala,
Sweden) attached to a Gilson HPLC instrument equipped
with an automatic sample injector. The column was
equilibrated at room temperature in 50 m
M
sodium
phosphate, pH 7.0, and calibrated with gel-filtration
standards from Biorad and Sigma. SK samples of 20 lL
in 20 m
M
phosphate, pH 7.0, were incubated in Eppen-
dorf tubes in a thermostatic bath at different temperatures
for 10 min and immediately cooled on ice. The samples
were then injected into the column and eluted at a flow
rate of 0.8 mLÆmin
)1
. Elution profiles were recorded by
monitoring absorbance at 220 and 280 nm. Peak areas
and elution times were determined by using the manu-
facturer’s software.
Limited proteolysis
The structural properties of heat-induced SK aggregates
were probed by limited proteolysis. A 10 mgÆmL
)1
sample
of intact SK in 20 m
M
phosphate, pH 7.0, was heated to
65 °C for 10 min to induce aggregation (see Results) and
then cooled on ice. The sample was immediately submitted
to proteolysis with a-chymotrypsin (10 lgÆmL
)1
)at23°C.
Aliquots were removed at different times, 20 m
M
phenyl-
methanesulfonyl fluoride added to stop the proteolysis, and
then analysed by SDS/PAGE. The time-course of proteol-
ysis of an identical unheated SK sample was also followed
as a reference. An aliquot obtained after 10 min of
proteolysis of the heated SK sample was analysed by RP-
HPLCusingaC
18
Dynamax-300 column as described
elsewhere [3]. The samples corresponding to the major
peaks in the HPLC chromatograms were separated and
analysed by SDS/PAGE and electrospray ionization mass
spectrometry (ESI-MS). ESI-MS spectra were acquired on a
BioA triple quadrupole atmospheric pressure mass spectro-
meter from VG Biotech, equipped with an electrospray
interface.
4122 A. I. Azuaga et al. (Eur. J. Biochem. 269) Ó FEBS 2002
CD spectroscopy of the 1–63 SK fragment
Far-UV CD spectra of the isolated 1–63 fragment (SKA1)
were acquired on a JASCO J-720 spectropolarimeter at
20 °C. Measurements were made between 190 and 250 nm
at different pH values between 3.0 and 8.0, in 10 m
M
glycine, acetate or phosphate buffers. Sample concentra-
tions were 0.1 mgÆmL
)1
. Data were recorded using a scan
rate of 50 nmÆmin
)1
and a response time of 1 s. Cuvette
path lengths were 0.1 cm. An average of 10 scans was
obtained. A baseline was subtracted from the spectra of the
samples and finally the result was smoothed. The mean
residue ellipticity, [Q], was calculated in units of degÆcmÆ
dmol
)1
. Near-UV spectra of the 1–63 SK fragment were
also recorded at pH 4.5 between 250 and 320 nm, using a
sample concentration of 1.0 mgÆmL
)1
and a cuvette with a
path length of 0.5 cm.
Fluorescence enhancement of ANS by the 1–63
SK fragment
Fluorescence spectra of 8-anilino-1-naphthalenesulfonic
acid (ANS) both in the presence and absence of the SKA1
fragment were measured at 20 °CinaPerkinElmerLS-50
spectrofluorimeter. The excitation wavelength was 380 nm
and spectra were recorded between 400 and 600 nm. The
concentrations of ANS and the SK fragment in the cuvette
were 10 l
M
. Fluorescence spectra were corrected using the
spectra obtained for solutions in the absence of dye or
protein.
RESULTS
Thermal unfolding of SK under equilibrium
The thermal denaturation of intact SK and a set of SK
fragments including either one or two SK domains was
followed by DSC at pH 7.0 in 20 m
M
sodium phosphate
buffer. Experiments at pH 6.0 and pH 8.0 were also
carried out for intact SK and some of the fragments.
The effects of sample concentration were also investi-
gated.
The concentration of all the samples was initially kept
to % 1mgÆmL
)1
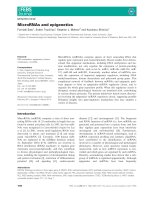
. Figure 1 shows the C
p
curves corres-
ponding to intact SK, each of the isolated SK domains
(SKA, SKB and SKC) and a fragment consisting of SK
domains B and C (SKBC) at pH 7.0. The data for SKA
at pH 7.0 and 0.88 mgÆmL
)1
have been taken from
Azuaga et al. [19]. Fragments SKA, SKB and SKC show
single unfolding transitions with high reversibility and no
evidence of protein aggregation, even after heating to
high-temperature. This indicates that the thermal unfold-
ing of all the isolated SK domains at pH 7.0 occurs
essentially at equilibrium. Fragment SKBC unfolds in
two reversible transitions, corresponding to the consecu-
tive unfolding of domain B and C, as described elsewhere
[4]. At this low protein concentration (0.94 mgÆmL
)1
)
intact SK also unfolds reversibly in two well-separated
peaks.
When the sample concentration of SK or SKA is raised
above 1.5 mgÆmL
)1
at pH 7.0 the DSC profiles are clearly
modified, due to the presence of protein aggregation
processes (see below). Similar effects of concentration or
aggregation processes were not observed in the rest of the
fragments (results not shown). The DSC curves of SK at
pH 6.0 are also affected by extensive aggregation under all
concentrations (1.0–10.3 mgÆmL
)1
) investigated. On the
other hand, at pH 8.0 the thermal unfolding of both intact
SK and SKA is fully reversible at all concentrations used in
this study (1.0–10 mgÆmL
)1
for SK and 0.9–5.5 mgÆmL
)1
for SKA).
The DSC curves of each protein moiety for which
thermodynamic equilibrium conditions are unequivocally
verified (those measured at pH 8.0 or pH 7.0 and low
sample concentrations) have been fitted assuming that each
protein domain unfolds independently in a two-state
transition. In the fits of the DSC curves of multidomain
moieties [intact SK (three domains) and SKBC (two
domains)], the heat capacity increment, DC
p
,forthe
independent unfolding of each domain has been fixed by
using the values obtained from the fits corresponding to
single-domain fragments. All the fits are good, as can be
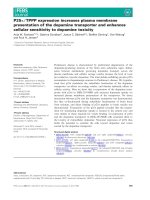
seen for pH 7.0 in Fig. 1. Figure 2 shows the deconvolution
of the heat capacity curves for intact SK at pH 7.0 and
pH 8.0 into three independent two-state transitions, which
can easily be identified as corresponding to each SK
domain. The parameters obtained from these fits are listed
Fig. 1. Partial molar heat capacity curves, C
p
,ofintactSKandfrag-
ments SKBC, SKA, SKB and SKC obtained by DSC at pH 7.0, 20 m
M
sodium phosphate. Experiments were performed at a heating rate of
2 °CÆmin
)1
Sample concentrations employed were about 1 mgÆmL
)1
(see text). Open circles represent the experimental data. Lines corres-
pond to the best fittings using equilibrium models of single or multiple
two-state transitions (see text for details).
Ó FEBS 2002 Unfolding and aggregation of streptokinase (Eur. J. Biochem. 269) 4123
in Table 1. These results indicate that during the equilibrium
unfolding of SK, each domain behaves as a single cooper-
ative unit, regardless of whether it is isolated or linked to
other domains.
The effect of protein concentration and scan rate
on the DSC curves
At pH 7.0 and sample concentrations higher than
% 1.5 mgÆmL
)1
, the DSC curves of intact SK show a clear
concentration effect (Fig. 3B); the second peak observed at
low concentration, which corresponds to the sum of the
equilibrium unfolding transitions of domains A and C, splits
into two well-separated peaks as the sample concentration
increases. This effect is even more pronounced at pH 6.0
(Fig. 3C), where protein precipitates are also visually
evident after heating in the DSC cell. At pH 7.0, on the
other hand, the samples remain transparent during the
heating although soluble, high molecular mass aggregates
are formed (see below). At pH 8.0 the DSC curves are
independent of protein concentration (Fig. 3A) showing
that aggregation does not occur at concentrations below
10 mgÆmL
)1
.
Fig. 4 shows the results of a set of DSC experiments
carried out with SK to assess the reversibility of each of the
transitions under different conditions. At pH 7.0 and low
sample concentration (1.04 mgÆmL
)1
; Fig. 4A) or at pH 8.0
even at relatively high protein concentration (3.3 mgÆmL
)1
;
Fig. 4C), the peaks observed are highly reversible. At
pH 7.0 and sample concentration of 3.4 mgÆmL
)1
(Fig. 4B),
only the peak corresponding to the unfolding of domain B
is highly reproducible in a consecutive scan. Moreover,
heating the sample to higher temperatures results in a major
loss of area for the transitions in a further scan. At pH 6.0
the irreversibility is even more pronounced (Fig. 4D). These
results indicate that irreversible denaturation processes
concomitant with the thermal unfolding of SK occur at
pH 7.0 and high sample concentrations and at pH 6.0 at all
concentrations.
The effect of the temperature scan rate on the DSC curves
of SK at pH 7.0 and 3.4 mgÆmL
)1
hasalsobeeninvestigated
to check whether the irreversible processes result in a kinetic
control of the DSC traces [23,24] (Fig. 5). The unfolding
transition corresponding to domain B is not affected by the
scan rate, indicating that it occurs under equilibrium
conditions. On the other hand, there is a significant effect
Fig. 2. Partial molar heat capacity curves, C
p
, of intact SK at pH 7.0
and 8.0 showing the result of the fitting of the curves using an equilibrium
model with three two-state transitions. Symbols stand for the experi-
mental C
p
data. Continuous lines correspond to the best fittings.
Dashed lines represent the predicted C
p
curve of each of the two-state
transitions in which the global curves can be deconvoluted.
Table 1. Thermodynamic parameters for the independent thermal unfolding of the three SK domains observed by DSC. DC
p
values marked with (f)
were fixed in the fitting and correspond to the values obtained for the isolated domains. The uncertainties of the parameters correspond to the
standard errors obtained in the fittings. Reproducibility of T
m
and DH values in different experiments was better than 0.5 °C and 10 kJ mol
)1
,
respectively.
Domain A Domain B Domain C
T
m
(°C)
DH (T
m
)
(kJÆmol
)1
)
DC
p
(T
m
)
(kJÆK
)1
Æmol
)1
)
T
m
(°C)
DH (T
m
)
(kJÆmol
)1
)
DC
p
(T
m
)
(kJÆK
)1
Æmol
)1
)
T
m
(°C)
DH (T
m
)
(kJÆmol
)1
)
DC
p
(T
m
)
(kJÆK
)1
Æmol
)1
)
pH 7.0
SKA 52.3 ± 0.1 281 ± 1 6.1 ± 0.3 – – – – – –
SKB – – – 45.14 ± 0.03 377 ± 1 6.0 ± 0.3 – – –
SKC – – – – – – 71.2 ± 0.2 201 ± 1 0.8 ± 0.2
SKBC – – – 43.52 ± 0.05 320 ± 2 (f) 69.6 ± 0.2 224 ± 3 (f)
Intact SK 61.4 ± 0.2 319 ± 10 (f) 46.2 ± 0.1 363 ± 3 (f) 69.7 ± 0.7 199 ± 5 (f)
pH 8.0
SKA 47.1 ± 0.1 233 ± 1 5.5 ± 0.1 – – – – – –
SKC – – – – – – 67.8 ± 0.1 193 ± 1 0.6 ± 0.1
Intact SK 57.0 ± 0.2 270 ± 5 (f) 45.9 ± 0.1 363 ± 3 (f) 69.9 ± 0.5 194 ± 2 (f)
4124 A. I. Azuaga et al. (Eur. J. Biochem. 269) Ó FEBS 2002
of scan rate for the rest of the DSC curves. A decrease in the
scan rate shifts the second peak towards lower temperatures
together with a reduction in its area. The scan rate also
affects the high-temperature transition.
These results indicate that time-dependent aggregation
processes are involved in the thermal denaturation of
SK at pH 7.0 and sample concentrations higher than
% 1.5 mgÆmL
)1
, and at pH 6.0 at all concentrations studied.
This results in considerable modification of the shape of the
DSC curves, which become kinetically controlled and
therefore impossible to analyse on thermodynamic grounds
alone. The most pronounced effects are observed at
temperatures at which domain A unfolds suggesting a
particularly significant role for this domain in the overall
aggregation of SK.
Thermal denaturation of isolated SK domain A
A marked concentration effect on the DSC curves was also
found for SKA at pH 7.0 (Fig. 6). At sample concentrations
equal to or higher than 2 mgÆmL
)1
, the DSC traces show
two well-resolved peaks. The increase of sample concentra-
tion shifts the first peak towards lower temperatures. This
peakalsobecomesnarrowerandhasasmallerareathanthe
single two-state unfolding transition observed at a concen-
tration of 0.88 mgÆmL
)1
. The partial development of
denaturation heat suggests the formation of partially
unfolded forms. The first peak is essentially irreversible in
a second consecutive scan (result not shown). A second
transition at a higher temperature (about 75 °C) appears
approximately to complete the total heat of unfolding.
Similarly to intact SK, the solution remains clear after
heating. Although the DSC curves are much simpler than
for intact SK, the concentration effects are very similar
under the same conditions. Therefore an aggregation
process similar to that found for intact SK appears to
occur with the isolated A domain. This result indicates that
the aggregation tendency observed for intact SK resides at
least in part within domain A.
The high-temperature transition occurring at high sample
concentrations is partially reversible for both SKA and
intact SK. In a previous paper, we analysed the thermal
unfolding of SK by one-dimensional NMR under the same
conditions studied here and at high sample concentrations
[4]. We found that at temperatures near to 65 °CtheNMR
signals became very broad and further heating at 85 °C
produced a sharpening of the NMR signals, the spectrum
becoming similar to that expected for an unfolded poly-
peptide chain. This line broadening of the NMR signals can
now be attributed to the aggregation processes that we have
seen here. These observations suggest that the high-
temperature transition at around 75–80 °C observed for
SK, and in all probability for SKA, corresponds to the
unfolding and dissociation of protein aggregates, leading
finally to the fully unfolded state.
A simple model for transient, kinetically controlled
aggregation
A simple model can explain the effect of concentration on
the DSC curves of SKA. The thermal unfolding of fragment
SKA at low concentrations is very well described by a two-
state transition, without the presence of intermediates with a
significant population. Therefore, the monomeric states in
Fig. 3. The effect of sample concentration on the DSC curves of intact SK at pH 8.0 (A), 7.0 (B) and 6.0 (C). Sample concentrations in mg per mL are
indicated along each curve. Curves have been displaced in the vertical axis for clarity. The length of the vertical segment in each panel represents
30 kJÆK
)1
Æmol
)1
on the vertical axis.
Ó FEBS 2002 Unfolding and aggregation of streptokinase (Eur. J. Biochem. 269) 4125
equilibrium at low concentration are the native, N, and the
unfolded, U.
N
!
U
It can be assumed that the unfolded state, U, forms
n-order aggregates, A
n
.
nU
!
k
1
k
2
A
n
The aggregation process is considered to be reversible
because state A
n
can dissociate and unfold at high
temperatures. Nevertheless, association and dissociation
can be slow at certain temperatures and therefore kinetically
controlled. Constants k
1
and k
2
are the association and
dissociation rate constants, respectively, related by the
equilibrium constant of the aggregation process, K
A
. Thus,
aggregation will be detected only for large k
1
values and
high concentrations of the state that undergoes aggregation.
The equations of this simple model have been included in
the Appendix. The heat capacity curves, C
p
,canbe
predicted from these equations using the following set of
parameters: a linear heat capacity function for the native
state, C
p
(N); the enthalpies and the heat capacities of the
unfolded state, DH
U
and DC
pU
, and of the aggregate, DH
A
and DC
pA
, all them relative to the native state, expressed per
mol of monomer at a given reference temperature, T
0
;the
temperature at which the Gibbs energy of unfolding is zero,
T
m
; the activation enthalpy for the aggregation process,
DH
6¼
1
; the values of k
1
and K
A
at T
0
; and finally the
aggregation order, n. It should be pointed out that
according to these equations, the DSC curves will depend
on both total protein concentration and scan rate, as seen in
our experimental data.
Using this model we carried out the simultaneous fitting
of the DSC profiles obtained for SKA at pH 7.0 and
different sample concentrations, using only the DSC data
corresponding to the first of the two transitions present in
Fig. 5. The effect of the scan rate of the DSC calorimeter on the heat
capacity curves of intact SK at pH 7.0 and 3.36 mgÆmL
)1
. Scan rates
are: continuous line, 2.04 °CÆmin
)1
; dashed line, 1.03 °CÆmin
)1
; dotted
line, 0.51 °CÆmin
)1
; dashed-dotted line, 0.25 °CÆmin
)1
.
Fig. 4. Tests of reversibility of the DSC transitions of intact SK by consecutive heating of the same sample in the calorimeter. The sample concen-
trations and pH values are indicated in the panels. First heatings of the sample are represented in continuous line, second heating in dashed lines,
third heating in dotted lines and fourth heating in dashed-dotted lines.
4126 A. I. Azuaga et al. (Eur. J. Biochem. 269) Ó FEBS 2002
the curves at high sample concentrations. To reduce the
number of fitting parameters, T
m
, DH
U
and DC
pU
were
fixed in the fits using the values in Table 1 for SKA at
pH 7.0. In addition, for the sake of simplicity the relative
heat capacity function of the aggregate, DC
p,A
,andthe
activation enthalpy for the aggregation process, DH
6¼
1
,were
fixed to zero. The last assumption implies a temperature-
independent k
1
, which is a reasonable approximation
considering the narrow temperature interval in which
association is taking place. With these approximations,
the number of adjustable parameters is reduced to five,
which is a reasonable number taking into account that a
single two-state transition also requires five parameters to be
correctly described. The aggregation order, n,hasbeen
modified in different fitting attempts starting from n ¼ 2to
n ¼ 10. Higher values of n were not used due to numerical
problems in the computer fitting procedure. The fit for n ¼ 8
is represented in Fig. 6 together with the experimental
curves. Despite the large number of simplifications, the
model is consistent with the effect of concentration on the
shape and T
m
of the first transition occurring at % 50 °C.
Good descriptions of the DSC curves are obtained when the
n values are higher than 6. The parameters obtained from
these fits are listed in Table 2.
Fitting the DSC curves including the second transition at
high sample concentrations gives poor results. The model
predicts the second transition to be much sharper (more
cooperative) than it proved experimentally. This discrep-
ancy may be due to the fact that our model assumes a single
two-state process for the association–dissociation reaction,
whereas this process is very likely to be much more
complicated, probably including many heterogeneous as-
sociation/dissociation steps. Nevertheless, the general fea-
tures of the experimental DSC curves are satisfactorily
represented by the model in spite of its simplicity and the
number of approximations considered in the analysis.
Detection of temperature-induced SK aggregation
by gel-filtration chromatography
With the aim of identifying the nature of the irreversible
processes occurring during the thermal denaturation of SK,
several aliquots of protein in 20 m
M
phosphate, pH 7.0, at
different concentrations of between 0.05 and 18.5 mgÆmL
)1
were incubated at 90 °C for 10 min and immediately cooled
on ice. This procedure was based on the supposition that the
association–dissociation equilibrium becomes effectively
frozen at low temperatures. To estimate the percentage of
aggregated protein the samples were subsequently analysed
by gel-filtration chromatography at room temperature
(Fig. 7A). At concentrations lower than 2.0 mgÆmL
)1
,the
elution profiles consist of a single peak corresponding to the
native protein. At higher sample concentrations, however,
an additional peak appears at the exclusion volume of the
column, which for the Superose 12 column corresponds to
aggregates of at least 40 molecules of SK. No peaks of
intermediate mass were detected. The percentage of protein
in the aggregated form increased with sample concentration,
reaching nearly 100% at the highest concentration investi-
gated.
Another set of SK samples of 9.9 mgÆmL
)1
in 20 m
M
phosphate, pH 7.0, were incubated for 10 min at different
temperatures and immediately cooled on ice. For SK
samples incubated at temperatures below 45 °C, no aggre-
gation was detected. At higher temperatures, the percentage
of protein in the aggregated form increased (Fig. 7B),
reaching a maximum at between 55 and 70 °C, where up to
90% of the protein was aggregated. At higher incubation
temperatures the percentage of protein in the aggregate
decreased and was only about 42% at 100 °C. This is
consistent with the proposal that the aggregates unfold and
Fig. 6. The effect of sample concentration on the DSC curves of SK
domain A (SKA) at pH 7.0. Sample concentrations in mg per mL are
indicated along each DSC curve. Symbols represent the experimental
C
p
data. Lines correspond to the simultaneous fitting of the three C
p
curves using the model described in the text. The parameters of the
fitting are: n ¼ 8; C
p
(N) ¼ 33.1 + 0.11ÆT(kJÆK
)1
Æmol
)1
);
DH
A
(50 °C) ¼ 177 kJÆmol
)1
;lnK
A
(50 °C) ¼ 76.2; lnk
1
¼ 60.7.
Table 2. Parameters resulting from the simultaneous fitting of the DSC
curves of SKA at pH 7.0 and different sample concentrations, using the
equations of the model described in the text. All parameters correspond
to T ¼ 50 °C. The uncertainties of the parameters correspond to the
standard errors obtained in the fittings.
n
DH
An
a
(kJÆmol
)1
)lnK
A
DG
A
–DG
U
a
(kJÆmol
)1
)lnk
1
b
6 182 ± 6 54.4 ± 0.5 )24.4 42.8 ± 0.2
7 179 ± 5 65.3 ± 0.7 )25.1 51.7 ± 0.2
8 177 ± 5 76.2 ± 0.5 )25.6 60.7 ± 0.2
9 174 ± 6 87.1 ± 0.9 )26.0 69.6 ± 0.2
10 172 ± 6 110 ± 5 )29.6 78.5 ± 0.3
a
Expressed per mol of monomer.
b
k
1
units are mol
–(n)1)
Æmin
)1
.
Ó FEBS 2002 Unfolding and aggregation of streptokinase (Eur. J. Biochem. 269) 4127
dissociate at high temperatures. Nevertheless, during this
procedure, in which samples are cooled from 100 to 0 °C,
some additional aggregation of SK cannot be avoided
unless the cooling is extremely fast.
These results allow us to identify the irreversible process
induced by high temperatures with the formation of high
molecular mass aggregates of SK. The maximum degree of
aggregation occurs at high sample concentrations and at
temperatures where domain A unfolds, and decreases at
higher temperatures.
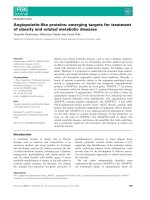
Limited proteolysis of the SK aggregates
Limited proteolysis with a-chymotrypsin was used to
characterize the heat-induced aggregates of intact SK.
Figure 8 shows SDS/PAGE gels monitoring the course of
proteolysis of a 10 mgÆmL
)1
SK sample in 20 m
M
phos-
phate, pH 7.0, which was heated to 65 °C for 10 min and
then cooled on ice. The proteolytic behaviour of an
unheated identical sample is also shown for comparison.
During the course of chymotryptic proteolysis of native
SK, several fragments accumulated as reported elsewhere
[3]. The pattern of proteolysis of the aggregated SK sample
was, however, dramatically different. Despite forming high
molecular mass aggregates, its sensitivity to proteolysis was
much higher than that of native monomeric SK. Further-
more, the SK chain was cleaved much more heterogene-
ously. This indicates that the accessibility of the chain to
proteolytic attack and therefore its structural disorder is
higher than in the native protein. In contrast to native SK,
the 16 kDa fragment, corresponding to domain B, is not
resistant to proteolysis, meaning that this domain is
unstructured in the SK aggregates.
The two most highly populated fragments were generated
very quickly, within 2 min of proteolysis, corresponding to
molecular masses of approximately 7 and 12 kDa, and
remained in the proteolytic mixture for up to 60 min. This
suggests that both fragments might be involved in stable
structures in the protein aggregates. ESI-MS analysis of
these fragments revealed a mass of 6765.6 ± 0.2 Da for the
7 kDa fragment, whereas the 12 kDa fragment is in fact a
mixture of two fragments with masses of 12 265.2 ±
0.2 Da and 12 428.3 ± 0.3 Da. These experimental
SK [1-414]
SKB [
147-287]
SKC
[288-380]
[1-63]
[1-63]
[275(6)-380]
0 2 5 10 20 60 0 2 5 10 20 60
Time (min
)
A
B
SK [1-414]
Molecular
Mass (Da)
45000
30000
25000
17000
12000
6000
[64-380]
SKBC [147-380]
Fig. 8. SDS/PAGE gels monitoring the time course of proteolysis of native SK (A) and aggregated SK (B). Labels adjacent to the gels indicate the
sequence of some fragments. The molecular mass scale has been obtained using SDS/PAGE protein standards.
Fig. 7. Gel filtration analysis of the percentage of heat induced SK
aggregation at pH 7.0. (A) Aliquots of SK were preincubated at 90 °C
for 10 min at different sample concentrations prior analysis. (B)
Aliquots of SK of 9.9 mgÆmL
)1
were preincubated for 10 min at dif-
ferent temperatures prior analysis.
4128 A. I. Azuaga et al. (Eur. J. Biochem. 269) Ó FEBS 2002
masses, together with the sequence specificity of chymo-
trypsin, allowed us to identify the sequences of the three
fragments as: 1–63 (defined previously as fragment SKA1),
276–380 and 275–380, respectively.
A sample of aggregated SK was subjected to proteolysis
for 10 min as described above, filtered and then analysed by
gel-filtration chromatography. Aliquots were collected and
analysed by SDS/PAGE. It was observed that the fragments
1–63 and 275(6))380 migrated together in the chromato-
grams (results not shown), indicating that these two
fragments interact in the proteolysed mixture.
Structural characterization of SK fragment 1–63
Isolated SK fragment 1–63 (SKA1) was structurally char-
acterized in solution using a variety of techniques. Far-UV
CD spectra of SKA1 were obtained at a series of pH values
between 2.0 and 8.0 (Fig. 9A). The shape of the CD spectra
was strongly dependent on pH, changing from a typical
b sheet spectrum at pH 4.0 and 5.0 to the characteristic
random-coil spectrum at both pH 2.0 and pH 8.0. The
near-UVspectrumofSKA1atpH4.5,10m
M
acetate
buffer and a sample concentration of 1.0 mgÆmL
)1
, how-
ever, shows very little ellipticity in the 320–250 nm wave-
length range (results not shown), suggesting that the
fragment has only a small amount of fixed tertiary structure
even when it contains a large amount of secondary
structure.
In the light of this latter observation, we investigated the
interaction between the SKA1 fragment and the hydropho-
bic dye ANS. ANS has a strong tendency to interact with
hydrophobic clusters exposed to the solvent, resulting in a
strong enhancement in the fluorescence of the dye and a
blue shift of the wavelength of the maximum, k
max
,ofthe
fluorescence spectrum. ANS has been frequently used to
monitor conformational changes and to characterize parti-
ally folded states in proteins [29–31]. Figure 9B shows the
fluorescence spectrum of a 10 l
M
solution of ANS in the
presence and absence of 10 l
M
of SKA1, at pH 7.0 and 4.4.
The presence of the fragment produces a large increase in
the intensity of ANS fluorescence, which is higher at pH 4.4
than at pH 7.0. k
max
also changes in the presence of SKA1,
with shifts of up to )50 nm compared to free ANS (see inset
in Fig. 9B). The maximum shift occurred at around pH 5,
the pH at which the fragment has the greatest amount of
sheet b structure.
These results indicate that under mildly acid conditions
SKA1 has a significant amount of b sheet structure, a
partially exposed hydrophobic core but little or no fixed
tertiary structure. These features are characteristic of the
compact denatured states often known as molten globules.
DISCUSSION
In this paper we have described how the thermal denatur-
ation of SK is highly affected by pH and sample concen-
tration. The most significant effect is the occurrence of high-
order aggregation processes accompanying the unfolding of
the protein, which are enhanced by lowering the pH or
increasing the sample concentration. The presence of
aggregation has a significant effect on the shape of the
DSC curves, which become both concentration dependent
and kinetically controlled. The primary consequence of
these effects is the unsuitabilility of using standard,
thermodynamics-based deconvolution methods to analyse
the curves.
At pH 7.0 and a sample concentration of less than
% 1.5 mgÆmL
)1
, the thermal unfolding of SK occurs
unequivocally under equilibrium conditions. This conclu-
sion is also valid for pH 8.0 and sample concentrations
between 1.0 and 10 mgÆmL
)1
. The DSC curves obtained for
SK under these conditions are accurately described by the
sum of three two-state transitions, indicating that SK
contains three independent cooperative folding units. This
finding agrees with our previous studies [3,4,19] and with the
number of structural domains observed in the crystal
structure of SK complexed with microplasmin [5].
Previous reports on studies into the thermal unfolding of
SK made by several authors using different techniques
reveal significant discrepancies in their account of the
number of unfolding units involved [4,13–20]. One of the
reasons for this disagreement might arise from the fact that
in some of these studies the number of independent
Fig. 9. Structural properties of SK fragment 1–63. (A) Far-UV CD
spectra of SK fragment 1–63 at different pH values. Symbols are:
pH 2.0 (j); pH 3.0 (h); pH 4.0 (d); pH 5.0 (s); pH 6.0 (m); pH 7.0
(n); pH 8.0 (r). (B) Fluorescence spectra of mixtures of 10 l
M
ANS
and 10 l
M
SK fragment 1–63, at pH 4.4 (dashed line) and 7.0 (dotted
line). Spectra in continuous lines represent the corresponding spectra
of 10 l
M
ANS in the absence of the SK fragment. (B inset) Depend-
ence with the pH of the wavelength of the maximum of the fluores-
cence spectra for the ANS + SK 1–63 mixtures relative to the
spectrum of free ANS.
Ó FEBS 2002 Unfolding and aggregation of streptokinase (Eur. J. Biochem. 269) 4129
unfolding transitions of intact SK has been inferred by
standard deconvolution methods of the complex DSC
curves, without recourse to any additional information
external to these curves. Direct deconvolution can some-
times suffer from uncertainties in the chemical baseline
corrections to the thermograms, which may bias the
resulting number of unfolding transitions. We have shown
here that the use of changes in the heat capacity of unfolding
determined independently for the isolated domains allows
this difficulty to be circumvented without having to resort to
chemical baseline corrections. Using this procedure, the
complex DSC profiles of SK can be perfectly explained in
terms of three independent transitions. Additionally, under
some of the experimental conditions used in previous
studies, aggregation processes, such as those shown here,
may severely deform the DSC curves, which if unnoticed
could lead to misleading results when deconvolution
procedures are applied.
The unfolding temperatures, T
m
, of the SK domains
decrease in the order: C > A > B. This order is contrary to
that of the values of the specific enthalpy of unfolding when
compared at the same temperature (B > A > C). The
values of the specific DC
p
for the unfolding of domains A
and B are similar (about 0.4 JÆK
)1
Æg
)1
), consistent with their
high structural homology, and fall within the range of
values observed for small globular proteins [32]. In contrast,
the specific DC
p
for the unfolding of domain C is very low
(about 0.06 JÆK
)1
Æg
)1
). This value, together with the low
unfolding enthalpy of the domain, is consistent with its
lower degree of structure [5].
Under the same equilibrium conditions, the values of T
m
and DH
m
for either of the isolated domains B and C agree
well with the values obtained when these domains form part
of larger protein moieties. These values also agree well with
those already published derived from studies of their
thermal unfolding followed by CD and NMR [4]. Thus,
the stabilities of domains B and C are not significantly
affected by their detachment from the remainder of the
protein. Domain A, on the other hand, is destabilized by
9–10 °C when excised from the rest of the chain. Visual
inspection of the crystal structure of SK [5] indicates that
there are significant contacts between domains A and B. It is
surprising that removal of these interactions does not affect
the stability of domain B. Nevertheless, interdomain con-
tacts may be conditioned by the complex formation with
microplasmin in the crystal structure. An alternative
explanation could be that some interactions internal to
domain A are affected by chain excision. Domain C is, in
constrast, relatively isolated from the rest of the SK
structure and the linker with domain B appears to be very
flexible.
An increase in pH from 7.0 to 8.0 does not affect the
stability of either domain B or C; only domain A shows a
clear reduction of its T
m
when the pH is raised from 7.0 to
8.0. This dependence of the stability upon pH suggests that
unfolding is coupled to the change in ionization of the
His140 sidechain, which in the crystal structure forms a clear
double salt bridge with the Asp32 and Asp106 sidechains
within domain A [5], although we cannot exclude the
participation of other ionisable groups.
On the other hand, the results described here demonstrate
that under certain experimental conditions, i.e. pH 7.0 and
sample concentrations higher than a few mg per mL, or
pH 6.0 at all the concentrations investigated, the thermal
unfolding of SK domain A, either isolated or when part of
the intact protein, is accompanied by formation of high
molecular mass aggregates. Further heating, however,
produces dissociation and unfolding of these aggregates,
which result in a cooperative transition in the DSC curves.
A very simple model reproduces well the effects that the
kinetically controlled aggregation process exert over the
unfolding transition of SK domain A. The enthalpy of
the aggregate per mol of monomer unit (177 kJÆmol
)1
) lies
between the enthalpies of the native state (the reference
state) and the unfolded state (267 kJÆmol
)1
), indicating that
the aggregate contains a significant degree of structure. This
conclusion is consistent with the development of an
additional cooperative transition accompanying the disso-
ciation of the aggregates, and suggests that at least some of
the structure within the aggregates could be specific.
The aggregation process at pH 7.0 is slow enough at the
intermediate temperatures where it occurs to lead to the
kinetic control of the DSC curves. We have described a
similar slow association process for a thermolysin fragment
in a previous paper [33].
Different values for the aggregation order, n, in our
model give good fits for the first transition of the DSC
curves of SKA. This finding could be interpreted in
principle as an indication of the insensitivity of this model
to the value of n, although it could also suggest that the
aggregation process is more heterogeneous and complex
than represented by this simple model. In spite of this, the
thermodynamic parameters of the aggregated state, when
expressed per mol of monomer, are essentially independent
of the aggregation order (See Table 2). It is interesting to
note that at 50 °C, close to the unfolding temperature of
domain A, aggregation is highly favoured, as the Gibbs
energy change of the aggregation process is about )26 kJ
per mol of monomer.
The gel filtration study indicates that the SK aggregates at
room temperature consist of at least 40 molecules. As
mentioned in the Results, we could not test high values of n
in our fittings of the DSC curves due to numerical problems.
We should bear in mind, however, that the value of n in the
model actually represents an apparent average of the
molecularity of the rate-limiting step of aggregation, which,
depending on the specific aggregation mechanism, could be
markedly different from the size of the final aggregates that
are formed after cooling.
The most significant resistance of the SK aggregates to
limited proteolysis is located in two separate sequence
regions: segment 1–63, within domain A, and segment
275(6))380, which corresponds principally to domain C
(residues 292–380). As the isolated A domain also under-
goes an aggregation process similar to that of intact SK, it is
very likely that the region that principally stabilizes the
aggregated state resides within the segment 1–63. We cannot
exclude, however, the participation of domain C in these
interactions because domain C and fragment 1–63 migrate
together in the gel-filtration chromatography of a proteo-
lysed sample of aggregated SK. Nevertheless, the presence
of domain C is not necessary for aggregation, while region
1–63 of domain A is both necessary and sufficient.
It is interesting that the two 12 kDa fragments that
accumulate during proteolysis of the aggregate encompass
the whole of domain C (starting at Leu292) plus an
4130 A. I. Azuaga et al. (Eur. J. Biochem. 269) Ó FEBS 2002
additional segment [274(5))292], which includes the linker
between domains B and C and extends into the domain B
structure in native SK. Indeed, proteolytic cleavages occur
at positions Tyr274–Tyr275 and Tyr275–Val276, instead of
at position Phe287–Asp288, in the flexible linker between
domains B and C, as it is the case in native SK. Tyr274 and
Tyr275arelocatedinthemiddleofab sheet within
domain B in the crystal structure of SK [5]. It appears then
that domain B is not correctly folded in the aggregates
because part of its sequence is involved in interactions
associated with the formation of the aggregate.
At mildly acidic pH, the fragment SKA1 in isolation can
adopt a conformation rich in b sheet, containing a hydro-
phobic patch that can interact with ANS. This conforma-
tion is destabilized by an increase in pH, and SKA1 is fully
unfolded at pH 8.0. This structural change correlates with
the pH dependence of the aggregation of both SK and
SKA, the extent of which is reduced by an increase in pH
from 6.0 to 8.0. This result suggests that unfolding of
domain A under experimental conditions stabilizing the
b sheet rich conformation of segment 1–63 and its hydro-
phobic cluster produces SK species prone to high order
aggregation. This is highly consistent with the general
conclusion that protein aggregation is promoted by an
increased propensity of b sheet structures that dominate
stable intermolecular interactions [34].
CONCLUSIONS
When the thermal denaturation of SK occurs unequivocally
under equilibrium conditions (in this work pH 7.0 and low
protein concentration, or pH 8.0) an analysis of the DSC
profiles in conjunction with those of the isolated domains
shows that this protein consists of three independent
unfolding units, each of which corresponds to one of its
three structural domains.
At pH 6.0 or at pH 7.0 with high sample concentrations,
the thermal unfolding of SK domain A, either in isolation
orwhenformingpartofintactSK,isaccompaniedbythe
formation of high molecular mass aggregates. This associ-
ation is reversible at pH 7.0 but at low and intermediate
temperatures the equilibrium slows down, severely deform-
ing the unfolding profiles and rendering them kinetically
controlled, which precludes their simple interpretation by
equilibrium models.
The SK aggregates are largely unstructured but remain
resistant to proteolysis in specific sequences of the protein
chain [1–63, 274(75))380]. Of these, the N-terminal region
1–63 is both necessary and sufficient for the formation of
aggregates and appears to be the nucleus of aggregation. As
well as shedding light on the specific events associated with
the aggregation of SK, this study provides insight into the
nature of protein aggregation more generally. In particular
it supports real evidence for the specificity of the aggregation
process, and for the role of nucleation events in this
mechanism.
ACKNOWLEDGEMENTS
We thank Dr Richard A.G. Smith of AdProTech Limited for
supplying the streptokinase. We also thank Dr J. Trout for revising
the English text. This work has been financed by the European Union
Network ERB4061-PL-950200 and by grants PB96-1446 and
BIO2000-1459 of the Spanish Ministry of Science and Technology.
The Oxford Centre for Molecular Sciences is funded by BBSRC,
EPSRC and MRC. The research of CMD is also supported by the
Wellcome Trust.
REFERENCES
1. Malke,H.,Roe,B.&Ferretti,J.J.(1985)Nucleotidesequenceof
the streptokinase gene from Streptococcus equisimilis H46A. Gene
34, 357–362.
2. Christensen, L.R. (1945) Streptococcal fibrinolysis: a proteolytic
reaction due to a serum enzyme activated by streptococcal
fibrinolysin. J. Gen. Physiol. 28, 363–383.
3. Parrado, J., Conejero-Lara, F., Smith, R.A.G., Marshall, J.M.,
Ponting, C.P. & Dobson, C.M. (1996) The domain organization
of streptokinase: nuclear magnetic resonance, circular dichroism,
and functional characterization of proteolytic fragments. Protein
Sci. 5, 693–704.
4. Conejero-Lara, F., Parrado, J., Azuaga, A.I., Smith, R.A.G.,
Ponting, C.P. & Dobson, C.M. (1996) Thermal stability of the
three domains of streptokinase studied by circular dichroism and
nuclear magnetic resonance. Protein Sci. 5, 2583–2591.
5. Wang, X., Lin, X., Loy, J.A., Tang, J. & Zhang, X.C. (1998)
Crystal structure of the catalytic domain of human plasmin
complexed with streptokinase. Science 281, 1662–1665.
6. Damaschun, G., Damaschun, H., Gast, K., Gerlach, D., Missel-
witz, R., Welfle, H. & Zirwer, D. (1992) Streptokinase is a flexible
multi-domain protein. Eur. Biophys. J. 20, 355–361.
7. Young, K.C., Shi, G.Y., Wu, D.H., Chang, L.C., Chang, B.I., Ou,
C.P. & Wu, H.L. (1998) Plasminogen activation by streptokinase
via a unique mechanism. J. Biol. Chem. 273, 3110–3116.
8. Conejero-Lara, F., Parrado, J., Azuaga, A.I., Dobson, C.M. &
Ponting, C.P. (1998) Analysis of the interactions between strep-
tokinase domains and human plasminogen. Protein Sci. 7, 2190–
2199.
9. Nihalani, D., Kumar, R., Rajagopal, K. & Sahni, G. (1998) Role
of the amino-terminal region of streptokinase in the generation of
a fully functional plasminogen activator complex probed with
synthetic peptides. Protein Sci. 7, 637–648.
10. Chaudhary, A., Vasudha, S., Rajagopal, K., Komath, S.S., Garg,
N.,Yadav,M.,Mande,S.C.&Sahni,G.(1999)Functionofthe
central domain of streptokinase in substrate plasminogen docking
and processing revealed by site-directed mutagenesis. Protein Sci.
8, 2791–2805.
11. Reed, G.L., Houng, A.K., Liu, L., Parhami-Seren, B., Matsueda,
L.H., Wang, S. & Hedstrom, L. (1999) A catalytic switch and the
conversion of streptokinase to a fibrin-targeted plasminogen
activator. Proc.NatlAcad.Sci.USA96, 8879–8883.
12. Lin, L.F., Houng, A. & Reed, G.L. (2000) Epsilon amino caproic
acid inhibits streptokinase–plasminogen activator complex for-
mation and substrate binding through kringle-dependent mecha-
nisms. Biochemistry 39, 4740–4745.
13. Radek, J.T. & Castellino, F.J. (1989) Conformational properties
of streptokinase. J. Biol. Chem. 264, 9915–9922.
14. Welfle, H., Misselwitz, R., Fabian, H., Damerau, W., Hoelzer, W.,
Gerlach, D., Halnin, N.N. & Venyaminov, S.Y. (1992) Con-
formational properties of streptokinase – secondary structure and
localization of aromatic amino acids. Int. J. Biol. Macromol. 14,
9–18.
15. Welfle,K.,Pfeil,W.,Misselwitz,R.,Welfle,H.&Gerlach,D.
(1992) Conformational properties of streptokinase – differential
scanning calorimetric investigations. Int. J. Biol. Macromol. 14,
19–22.
16. Misselwitz,R.,Kraft,R.,Kotska,H.,Fabian,K.,Welfle,K.,
Pfeil, W., Welfle, H. & Gerlach, D. (1992) Limited proteolysis of
streptokinase and properties of some fragments. Int. J. Biol.
Macromol. 14, 107–116.
Ó FEBS 2002 Unfolding and aggregation of streptokinase (Eur. J. Biochem. 269) 4131
17. Teuten, A.J., Broadhurst, R.W., Smith, R.A.G. & Dobson, C.M.
(1993) Characterization of structural and folding properties of
streptokinase by n.m.r. spectroscopy. Biochem. J. 290, 313–319.
18. Medved, L.V., Solovjov, D.A. & Ingham, K.C. (1996) Domain
structure, stability and interactions in streptokinase. Eur. J.
Biochem. 239, 333–339.
19. Azuaga, A.I., Woodruff, N., Conejero-Lara, F., Cox, V.F., Smith,
R.A.G. & Dobson, C.M. (1999) Expression and characterization
of the intact N-terminal domain of streptokinase. Protein Sci. 8,
443–446.
20. Beldarrain, A., Lopez-Lacomba, J.L., Kutyshenko, V.P., Serrano,
R. & Cortijo, M. (2001) Multidomain structure of a recombinant
streptokinase. A differential scanning calorimetry study. J. Protein
Chem. 20, 9–17.
21. Gill, S.C. & von Hippel, P.H. (1989) Calculation of protein
extinction coefficients from amino acid sequence data. Anal.
Biochem. 182, 319–326.
22. Privalov, P.L. & Plotnikov, S.A. (1989) Three generations of
scanning microcalorimeters for liquids. Thermochim. Acta 139,
257–277.
23. Sa
´
nchez-Ruiz, J.M., Lo
´
pez-Lacomba,J.L.,Cortijo,M.&Mateo,
P.L. (1988) Differential scanning calorimetry of the irreversi-
ble thermal denaturation of thermolysin. Biochemistry 27, 1648–
1652.
24. Conejero-Lara, F., Sa
´
nchez-Ruiz, J.M., Mateo, P.L., Burgos, F.J.,
Vendrell, J. & Avile
´
s, F.X. (1991) Differential scanning calori-
metric study of carboxypeptidase B, procarboxypeptidase B and
its globular activation domain. Eur. J. Biochem. 200, 663–670.
25. Lo
´
pez-Mayorga, O. & Freire, E. (1987) Dynamic analysis of dif-
ferential scanning calorimetry data. Biophys. Chem. 27, 87–96.
26. Privalov, P.L. & Khechinashvili, N.N. (1974) A thermodynamic
approach to the problem of stabilization of globular protein
structure: a calorimetric study. J. Mol. Biol. 86, 665–684.
27. Viguera, A.R., Martı
´
nez, J.C., Filimonov, V.V., Mateo, P.L. &
Serrano, L. (1994) Thermodynamic and kinetic analysis of the
SH3 domain of spectrin shows a two-state folding transition.
Biochemistry 33, 2142–2150.
28. Makhatadze, G.I. & Privalov, P.L. (1990) Heat capacity of pro-
teins. I. Partial molar heat capacity of individual amino acid
residues in aqueous solution: hydration effect. J. Mol. Biol. 213,
375–384.
29. Semisotnov, G.V., Rodionova, N.A., Razgulyaev, O.I., Uversky,
V.N., Gripas¢, A.F. & Gilmanshin, R.I. (1991) Study of the
Ômolten globuleÕ intermediate state in protein folding by a hydro-
phobic fluorescent probe. Biopolymers 31, 119–128.
30. Guijarro, J.I., Sunde, M., Jones, J.A., Campbell, I.D. & Dobson,
C.M. (1998) Amyloid fibril formation by an SH3 domain. Proc.
Natl Acad. Sci. USA 95, 4224–4228.
31. Van Nuland, N.A., Meijberg, W., Warner, J., Forge, V., Scheek,
R.M., Robillard, G.T. & Dobson, C.M. (1998) Slow cooperative
folding of a small globular protein HPr. Biochemistry 37, 622–637.
32. Privalov, P.L. (1979) Stability of proteins. Adv. Prot. Chem. 33,
167–241.
33. Conejero-Lara, F. & Mateo, P.L. (1996) Presence of a slow
dimerization equilibrium on the thermal unfolding of the
205–316 thermolysin fragment at neutral pH. Biochemistry 35,
3477–3486.
34. Chiti, F., Taddei, N., Baroni, F., Capanni, C., Stefani, M.,
Ramponi, G. & Dobson, C.M. (2002) Kinetic partitioning of
protein folding and aggregation. Nat. Struct. Biol. 9, 137–143.
APPENDIX
We present here the mathematical development of the
model introduced in Results.
The equilibrium between N and U can be treated
separately by defining the following partition function:
Q
m
¼ 1 þ K
U
¼ 1 þ e
À
DG
U
RT
ð1Þ
where K
U
is the equilibrium constant of unfolding and DG
U
is the change in the standard Gibbs energy of unfolding. The
fractions of N and U, relative to the total concentration of
monomeric species, are given by:
y
U
¼
e
À
DG
U
RT
Q
m
y
N
¼
1
Q
m
ð2Þ
The fraction of protein monomers in each state relative to
the total concentration of protein monomers, C
0
, is defined
as:
x
N
¼
½N
C
0
x
U
¼
½U
C
0
x
A
¼
n½A
n
C
0
ð3Þ
Taking into account that the total concentration of protein
is C
0
¼ [N] + [U] + n[A
n
], we can relate the fractions, y
i
and x
i
by
x
i
¼ y
i
Áð1 À x
A
Þð4Þ
where i stands for either N or U.
We can define the average enthalpy of the monomeric
species, relative to N by:
hDHi
m
¼
X
i
y
i
Á DH
i
¼ y
U
Á DH
U
ð5Þ
where DH
U
is the enthalpy change of unfolding.
The average enthalpy of the whole system is:
hDHi¼x
A
DH
A
þ x
U
DH
U
¼ x
A
DH
A
þð1 À x
A
Þy
U
DH
U
¼hDHi
m
þ x
A
ðDH
A
ÀhDHi
m
Þð6Þ
where DH
A
is the enthalpy of the aggregate relative to
N, expressed per mol of monomer. Differentiating this
expression with respect to temperature provides the
heat capacity relative to N, also known as the excess
heat capacity. The addition of the heat capacity of the
native state, C
p
(N), gives the total heat capacity of the
protein:
C
p
¼ C
p
ðNÞþC
p;m
þ x
A
ðDC
p;A
À C
p;m
Þ
þðDH
A
ÀhDHi
m
Þ
dx
A
dT
ð7Þ
Here C
p
(N) + C
p,m
is the heat capacity curve that would be
observed in the absence of aggregation, i.e. at pH 7.0 and
low protein concentrations. C
p,m
can be easily obtained by
differentiating Eqn (5) with respect to temperature.
C
p;m
¼ y
U
DC
p;U
þ
1
RT
2
y
U
DH
U
ðDH
U
ÀhDHi
m
Þð8Þ
For the purpose of these equations DC
p,U
, DC
p,A
, DH
U
and DH
A
are taken to be in general functions of tempera-
ture.
The rate of formation of the aggregate can be expressed
as:
dx
A
dt
¼ nC
nÀ1
0
k
1
y
n
U
ð1 À x
A
Þ
n
À k
2
x
A
ð9Þ
Taking into account the constant scan rate, v ¼ dT/dt,ina
DSC experiment:
4132 A. I. Azuaga et al. (Eur. J. Biochem. 269) Ó FEBS 2002
dx
A
dT
¼
1
v
½nC
nÀ1
0
k
1
y
n
U
ð1 À x
A
Þ
n
À k
2
x
A
ð10Þ
The association and dissociation rate constants, k
1
and k
2
,
can be related by the equilibrium constant of the aggrega-
tion process:
K
A
¼
k
1
k
2
¼
½A
n
½U
n
ð11Þ
The van’t Hoff equation gives the temperature dependence
of K
A
:
dlnK
A
dT
¼
nðDH
A
À DH
U
Þ
RT
2
ð12Þ
and the aggregation rate constant, k
1
, changes with
temperature, as given by the equation:
ln k
1
¼ ln k
1
ðT
0
ÞÀ
n Á DH
6¼
1
R
1
T
À
1
T
0
þ ln
T
T
0
ð13Þ
DH
6¼
1
represents the activation enthalpy of the association
process, expressed per mol of monomer, and T
0
is a
reference temperature, chosen as 50 °Chereforthesakeof
convenience.
Eqn (10) can be integrated numerically to calculate x
A
and dx
A
/dT as functions of temperature. The C
p
curves
predicted by the model can be calculated by substituting
these two functions into Eqn (7).
Ó FEBS 2002 Unfolding and aggregation of streptokinase (Eur. J. Biochem. 269) 4133