Tài liệu NATURAL HAZARDS AND DISASTER MANAGEMENT doc
Bạn đang xem bản rút gọn của tài liệu. Xem và tải ngay bản đầy đủ của tài liệu tại đây (4.72 MB, 51 trang )
NATURAL HAZARDS
AND
DISASTER MANAGEMENT
A Supplementary Textbook in Geography for Class XI
on
UNIT 11 : Natural Hazards and Disasters
CENTRAL BOARD OF SECONDARY EDUCATION
PREET VIHAR, DELHI - 110092
FIRST EDITION 2006
© CBSE, DELHI
Price:
Published By: The Secretary, Central Board of Secondary Education,
2, Community Centre, Preet Vihar, Delhi-110092
Design, Layout and Illustration By: Chandu Press, D-97, Shakarpur, Delhi-110092
Printed By: Chandu Press, D-97, Shakarpur, Delhi-110092
ACKNOWLEDGEMENTS
❖❖
❖❖
❖ CBSE Advisors:
ο Shri Ashok Ganguly, Chairman, CBSE.
ο Shri G. Balasubramanian, Director (Academics), CBSE.
❖❖
❖❖
❖ Editor:
ο Shri M.P Sajnani, Advisor Disaster Management & Dy. National Project Director,
GOI-UNDP, DRM Programme.
❖❖
❖❖
❖ Authors:
ο Ms. Balaka Dey, Programme Associate, GoI – UNDP, DRM Programme.
ο Dr. R.B Singh, Reader, Dept. of Geography, Delhi School of Economics,
University of Delhi, Delhi – 110007.
❖❖
❖❖
❖ Review Team:
ο Prof. Noor Mohammad, Dept. of Geography, Delhi School of Economics,
University of Delhi, Delhi – 110007.
ο Shri S.S Rastogi, Retd. Principal, Directorate of Education, Delhi
❖❖
❖❖
❖ Coordinator: Ms. Sugandh Sharma, Education Officer (Commerce), CBSE
CONTENTS
Foreword (i)
For Students (ii)
Chapter 1: 1
Introduction to Disaster Management
Chapter 2:
Natural Hazards: causes, distribution pattern,
consequences and mitigation measures for :
❖❖
❖❖
❖ Earthquake 10
❖❖
❖❖
❖ Tsunami 17
❖❖
❖❖
❖ Cyclone 23
❖❖
❖❖
❖ Flood 30
❖❖
❖❖
❖ Drought 34
❖❖
❖❖
❖ Landslide 39
Page Nos.
FOREWORD
The recurrent occurrences of various natural and manmade disasters like the December
2004 Tsunami, the bomb blasts in the cinema halls of Delhi and many such incidences
have diverted our focus towards safety of one’s own life. In the previous class of VIII, IX
and X as students you must have read about various natural and manmade hazards –
their preparedness and mitigation measures. In class XI, the Board had introduced frontline
curriculum on Disaster Management in Unit 11 of the Geography syllabus. In supplementary
textbook on Disaster Management in Geography the Board intends to explain in detail
various concepts used in Disaster Management and discussed about the causes, distribution
pattern, consequences and mitigation measures for various natural hazards like earthquake,
tsunami, flood, cyclone, landslide and drought which are a recurrent phenomena in our
country.
I hope this book will help all students of Geography, who are the future citizens, to have a
better understanding of the subject so that they are well prepared to combat it. Being
senior students of the school I would appreciate if all of you (including teachers) as
responsible citizens and as volunteers take up the initiative of preparing the school disaster
management plan and also educate the younger students of the school on various safety
measures that need to be taken up for a better living.
I would like to thank Ministry of Home Affairs for their support and guidance in the preparation
of the course material and helping the Board in carrying out training programmes for the
teachers across the country. I would also like to extend my sincere thanks to the Geography
Department, University of Delhi for the support they have extended to come up with the
course outline for the Board and also helping in the development of the textbook. My
sincere thanks to the UNDP team who have contributed the most and have tirelessly put
all their effort in development of the textbook and also carrying out training programmes
for the teachers and the school principals across the country without whose support the
initiative would have been difficult to continue. I am grateful to the teachers who have
played a key role in making the subject so interesting and demanding. Their understanding
and interest have made teachers, students and other staff members of the school design
the school disaster management plans which have made the schools a better and safer
place.
Last but not the least my sincere thanks and appreciation to Shri G. Balasubramanian
(Director, Academics) who has always guided the team while developing the textbook and
introducing innovative ways to make the subject as a necessary life skill than a mere
subject.
Ashok Ganguly
Chairman, CBSE
(i)
For the Students………………
Some of you must have encountered one or the other natural or manmade hazard which
has caused a huge loss to life and property and have disrupted the normal life of the
people. Those who have had the opportunity to undergo certain training on safety like first
aid or search and rescue would have helped those in misery but then all of you are not well
equipped with both theoretical and practical knowledge. As a young responsible citizen
you can take up initiatives to prepare the community and make the community a safer
place to live.
The Board in its endeavor to make the students good managers and volunteers and effec-
tive carrier of messages, have introduced Disaster Management at various levels starting
from Standard VIII with effect from the academic year 2003. The Standard VIII textbook on
“Together Towards a Safer India – Part I” focuses on various natural and manmade
hazards and its preparedness measures. Taking it forward the Standard IX textbook “To-
gether Towards a Safer India – Part II” explains explicitly on the mitigation measures
that need to be taken up to save lives, livelihood and property. Apart from understanding it
as a subject, CBSE has felt the need to understand the subject as a necessary life skill.
Standard X textbook “Together Towards a Safer India – Part III” looks disaster manage-
ment from a different perspective of making the students and teachers help in preparation
of Disaster Management Plans for the school and the community and also making them
understand the various First Aid and Search and Rescue techniques and also on the role
of government, NGOs and others in managing disasters.
Those who have had the opportunity to read these books are by now better equipped but,
as a student the Board doesn’t refrain you from gaining knowledge and have a basic
understanding of the subject. In this textbook we have tried to give some basic
understanding about various natural hazards from the geography point of view. Apart from
various concepts the chapter tries to analyse various hazards prevalent in our country.
Understanding the causes, distribution pattern, consequences and mitigation measures
will help you to get better prepared.
(ii)
Natural Hazards & Disaster Management
1
Objectives of the chapter:
The main objective of this chapter is to
have a basic understanding of various
concepts used in Disaster Management.
The concepts explained here are:
Disaster, Hazard, Vulnerability, Capacity,
Risk and Disaster Management Cycle.
Apart from the terminologies, the chapter
also tries to explain various types of
disasters. In standard VIII, IX and X
many of you have already been
introduced to some of these concepts.
This chapter has been designed
to upgrade your knowledge and skill
so as to have a better understanding of
natural hazards, disasters and their
management.
After reading this chapter the
students and the teachers will be
able to have a basic understanding
of the concepts and should be able
to differentiate between them with
suitable examples.
Chapter 1
INTRODUCTION TO DISASTER MANAGEMENT
Background:
The global context:
Disasters are as old as human history but
the dramatic increase and the damage
caused by them in the recent past have
become a cause of national and international
concern. Over the past decade, the number
of natural and manmade disasters has
climbed inexorably. From 1994 to 1998,
reported disasters average was 428 per year
but from 1999 to 2003, this figure went up to
an average of 707 disaster events per year
showing an increase of about 60 per cent
over the previous years. The biggest rise was
in countries of low human development,
which suffered an increase of 142 per cent.
The figure 1.1 shows the deadliest disasters
of the decade (1992 – 2001). Drought and
famine have proved to be the deadliest
disasters globally, followed by flood,
technological disaster, earthquake, winds-
torm, extreme temperature and others. Global
economic loss related to disaster events
average around US $880 billion per year.
Fig : 1.1 World Scenario: Reported Deaths from all
Disasters (1992-2001)
Natural Hazards & Disaster Management
2
Indian scenario:
The scenario in India is no different from
the global context. The super cyclone of
Orissa (1999), the Gujarat earthquake
(2001) and the recent Tsunami (2004)
Table 1.1
Major disasters in India since 1970
Sl. No Disaster Impact
Cyclone
129
th
October 1971, Orissa Cyclone and tidal waves killed 10,000
people
219
th
November, 1977, Cyclone and tidal waves killed 20,000
Andhra Pradesh people
329
th
and 30
th
October 1999, Cyclone and tidal waves killed 9,000 and
Orissa 18 million people were affected
Earthquake
420
th
October 1991 Uttarkashi An earthquake of magnitude 6.6 killed
723 people
530
th
September 1993 Latur Approximately 8000 people died and
there was a heavy loss to infrastructure
6 22 May 1997 Jabalpur 39 people dead
729
th
March 1997, Chamoli 100 people dead
826
th
January, 2001, Bhuj, More than 10,000 dead and heavy loss
Gujarat to infrastructure
Landslide
9 July 1991, Assam 300 people killed, heavy loss to roads
and infrastructure
10 August 1993, Nagaland 500 killed and more than 200 houses
destroyed and about 5kms. Road
damaged.
11 18
th
August 1998, Malpa 210 people killed. Villages were washed
away
Flood
12 1978 Floods in North East India 3,800 people killed and heavy loss to
property.
13 1994 Floods in Assam, More than 2000 people killed and
Arunachal Pradesh, Jammu and thousands affected
Kashmir, Himachal Pradesh,
Panjab, Uttar Pradesh, Goa,
Kerala and Gujarat
affected millions across the country
leaving behind a trail of heavy loss of life,
property and livelihood. Table 1.1 shows
a list of some of the major disasters that
have caused colossal impact on the
community.
Natural Hazards & Disaster Management
3
While studying about the impact we need to
be aware of potential hazards, how, when
and where they are likely to occur, and the
problems which may result of an event. In
India, 59 per cent of the land mass is
susceptible to seismic hazard; 5 per cent of
the total geographical area is prone to floods;
8 per cent of the total landmass is prone to
cyclones; 70 per cent of the total cultivable
area is vulnerable to drought. Apart from this
the hilly regions are vulnerable to avalanches/
landslides/hailstorms/cloudbursts. Apart from
the natural hazards, we need to know about
the other manmade hazards which are
frequent and cause huge damage to life and
property. It is therefore important that we are
aware of how to cope with their effects.
We have seen the huge loss to life, property
and infrastructure a disaster can cause but
let us understand what is a disaster, what
are the factors that lead to it and its impact.
What is a Disaster ?
Almost everyday, newspapers, radio and
television channels carry reports on disaster
striking several parts of the world. But what
is a disaster? The term disaster owes its
origin to the French word “Desastre” which
is a combination of two words ‘des’ meaning
bad and ‘aster’ meaning star. Thus the term
refers to ‘Bad or Evil star’. A disaster can
be defined as
“A serious disruption in the
functioning of the community or a society
causing wide spread material, economic,
social or environmental losses which exceed
the ability of the affected society to cope
using its own resources”
.
A disaster is a result from the combination
of hazard, vulnerability and insufficient
capacity or measures to reduce the potential
chances of risk.
A disaster happens when a hazard impacts
on the vulnerable population and causes
damage, casualties and disruption. Fig: 1.2
would give a better illustration of what a
disaster is. Any hazard – flood, earthquake
or cyclone which is a triggering event along
with greater vulnerability (inadequate access
to resources, sick and old people, lack of
awareness etc) would lead to disaster
causing greater loss to life and property. For
example; an earthquake in an uninhabited
desert cannot be considered a disaster, no
matter how strong the intensities produced.
Fig: 1.2
Natural Hazards & Disaster Management
4
An earthquake is disastrous only when it
affects people, their properties and activities.
Thus, disaster occurs only when hazards
and vulnerability meet. But it is also to be
noted that with greater capacity of the
individual/community and environment to
face these disasters, the impact of a hazard
reduces. Therefore, we need to understand
the three major components namely hazard,
vulnerability and capacity with suitable
examples to have a basic understanding of
disaster management.
What is a Hazard ? How is it clas-
sified ?
Hazard may be defined as
“a dangerous
condition or event, that threat or have the
potential for causing injury to life or damage
to property or the environment.”
The word
‘hazard’ owes its origin to the word ‘hasard’
in old French and ‘az-zahr’ in Arabic
meaning ‘chance’ or ‘luck’. Hazards can be
grouped into two broad categories namely
natural and manmade.
Table 1.2: Various types of hazards
Types Hazards
Geological Hazards 1. Earthquake 4. Landslide
2. Tsunami 5. Dam burst
3. Volcanic eruption 6. Mine Fire
Water & Climatic Hazards 1. Tropical Cyclone 6. Cloudburst
2. Tornado and Hurricane 7. Landslide
3. Floods 8. Heat & Cold wave
4. Drought 9. Snow Avalanche
5. Hailstorm 10.Sea erosion
Environmental Hazards 1. Environmental pollutions 3. Desertification
2. Deforestation 4. Pest Infection
Biological 1. Human / Animal Epidemics 3. Food poisoning
2. Pest attacks 4. Weapons of Mass
Destruction
1. Natural hazards
are hazards which are
caused because of natural phenomena
(hazards with meteorological, geological or
even biological origin). Examples of natural
hazards are cyclones, tsunamis, earth-
quake and volcanic eruption which are
exclusively of natural origin. Landslides,
floods, drought, fires are socio-natural
hazards since their causes are both natural
and man made. For example flooding may
be caused because of heavy rains, landslide
or blocking of drains with human waste.
2. Manmade hazards
are hazards which
are due to human negligence. Manmade
hazards are associated with industries or
energy generation facilities and include
explosions, leakage of toxic waste, pollution,
dam failure, wars or civil strife etc.
The list of hazards is very long. Many occur
frequently while others take place
occasionally. However, on the basis of their
genesis, they can be categorized as
follows:
Natural Hazards & Disaster Management
5
What is vulnerability ?
Vulnerability may be defined as
“The extent
to which a community, structure, services
or geographic area is likely to be damaged
or disrupted by the impact of particular
hazard, on account of their nature,
construction and proximity to hazardous
terrains or a disaster prone area.”
Vulnerabilities can be categorized into
physical and socio-economic vulnerability.
Physical Vulnerability:
It includes notions of
who and what may be damaged or
destroyed by natural hazard such as earth-
quakes or floods. It is based on the physical
condition of people and elements at risk,
such as buildings, infrastructure etc; and their
proximity, location and nature of the hazard.
It also relates to the technical capability of
building and structures to resist the forces
acting upon them during a hazard event.
Figure 1.3 shows the settlements which are
located in hazardous slopes. Many landslide
and flooding disasters are linked to what you
see in the figure 1.3. Unchecked growth of
settlements in unsafe areas exposes the
people to the hazard. In case of an earth-
quake or landslide the ground may fail and
the houses on the top may topple or slide
and affect the settlements at the lower level
even if they are designed well for earthquake
forces.
Socio-economic Vulnerability:
The degree
to which a population is affected by a hazard
Chemical, Industrial and 1. Chemical disasters 3. Oil spills/Fires
Nuclear Accidents 2. Industrial disasters 4. Nuclear
Accident related 1. Boat / Road / Train 3. Building collapse
accidents / air crash 4. Electric Accidents
Rural / Urban fires 5. Festival related
Bomb /serial bomb disasters
blasts 6. Mine flooding
2. Forest fires
Types Hazards
Figure 1.3 : Site after pressures from population growth and urbanization
Natural Hazards & Disaster Management
6
will not merely lie in the physical components
of vulnerability but also on the socio-
economic conditions. The socio-economic
condition of the people also determines the
intensity of the impact. For example, people
who are poor and living in the sea coast don’t
have the money to construct strong concrete
houses. They are generally at risk and
loose their shelters when ever there is
strong wind or cyclone. Because of their
poverty they too are not able to rebuild their
houses.
What is capacity ?
Capacity can be defined as
“resources,
means and strengths which exist in
households and communities and which
enable them to cope with, withstand,
prepare for, prevent, mitigate or quickly
recover from a disaster”.
People’s capacity
can also be taken into account. Capacities
could be:
Physical Capacity:
People whose houses
have been destroyed by the cyclone or crops
have been destroyed by the flood can
salvage things from their homes and from
their farms. Some family members have
skills, which enable them to find employment
if they migrate, either temporarily or
permanently.
Socio-economic Capacity:
In most of the
disasters, people suffer their greatest losses
in the physical and material realm. Rich
people have the capacity to recover soon
because of their wealth. In fact, they are
seldom hit by disasters because they live in
safe areas and their houses are built with
stronger materials. However, even when
everything is destroyed they have the
capacity to cope up with it.
Hazards are always prevalent, but the
hazard becomes a disaster only when there
is greater vulnerability and less of capacity
to cope with it. In other words the frequency
or likelihood of a hazard and the vulnerability
of the community increases the risk of being
severely affected.
What is risk ?
Risk is a
“measure of the expected losses
due to a hazard event occurring in a given
area over a specific time period. Risk is a
function of the probability of particular
hazardous event and the losses each
would cause.”
The level of risk depends
upon:
❖ Nature of the hazard
❖ Vulnerability of the elements which are
affected
❖ Economic value of those elements
A community/locality is said to be at ‘risk’
when it is exposed to hazards and is
likely to be adversely affected by its
impact. Whenever we discuss ‘disaster
management’ it is basically ‘disaster risk
management’. Disaster risk management
includes all measures which reduce disaster
related losses of life, property or assets by
either reducing the hazard or vulnerability
of the elements at risk.
Natural Hazards & Disaster Management
7
Disaster Management Cycle
Disaster Risk Management includes sum
total of all activities, programmes and
measures which can be taken up before,
during and after a disaster with the purpose
to avoid a disaster, reduce its impact or
recover from its losses. The three key stages
of activities that are taken up within disaster
risk management are:
1. Before a disaster (pre-disaster).
Activities taken to reduce human and
property losses caused by a potential
hazard. For example carrying out aware-
ness campaigns, strengthening the existing
weak structures, preparation of the disaster
management plans at household and
community level etc. Such risk reduction
measures taken under this stage are termed
as
mitigation and preparedness activities.
2. During a disaster (disaster
occurrence).
Initiatives taken to ensure that the needs and
provisions of victims are met and suffering is
minimized. Activities taken under this stage
are called
emergency response activities.
3. After a disaster (post-disaster)
Initiatives taken in response to a disaster
with a purpose to achieve early recovery and
rehabilitation of affected communities,
immediately after a disaster strikes. These are
called as
response and recovery activities.
Disaster Risk Reduction can take place in the following ways:
1. Preparedness
This protective process embraces measures which enable governments, communities
and individuals to respond rapidly to disaster situations to cope with them effectively.
Preparedness includes the formulation of viable emergency plans, the development
of warning systems, the maintenance of inventories and the training of personnel.
It may also embrace search and rescue measures as well as evacuation plans for
areas that may be at risk from a recurring disaster.
Preparedness therefore encompasses those measures taken before a disaster event
which are aimed at minimising loss of life, disruption of critical services, and damage
when the disaster occurs.
2. Mitigation
Mitigation embraces measures taken to reduce both the effect of the hazard and the
vulnerable conditions to it in order to reduce the scale of a future disaster. Therefore
mitigation activities can be focused on the hazard itself or the elements exposed to
the threat. Examples of mitigation measures which are hazard specific include water
management in drought prone areas, relocating people away from the hazard prone
areas and by strengthening structures to reduce damage when a hazard occurs.
In addition to these physical measures, mitigation should also aim at reducing the
economic and social vulnerabilities of potential disasters
Natural Hazards & Disaster Management
8
Reference: Are you prepared? Learning from the Great Hanshin-Awaji
Earthquake Disaster - Handbook for Disaster Reduction and Volunteer activities
Figure 1.4 : Disaster Management
In the subsequent chapters we would
discuss in detail some of the major hazards
prevalent in our country its causes, impact,
preparedness and mitigation measures that
need to be taken up.
Reference for further reading:
1. Reading materials of 11
th
Community Based
Disaster Risk Management Course,
Bangkok, Thailand July 21 – August 1, 2003.
2. Anderson, M. and P. Woodrow. 1989. Rising
from the Ashes: Development Strategies in
Times of Disaster. UNESCO and West view
Press, Inc., Colorado.
3. Anderson M. Vulnerability to Disaster and
Sustainable Development: A General
Framework for Assessing Vulnerability.
4. UNDP Disaster Management Training
Programme.1992. An Overview of Disaster
Management.
5. International Federation of Red Crescent
Societies World Disaster Report: Focus on
Community resilience.
6. />terminology
Natural Hazards & Disaster Management
9
Exercise
1) Explain with examples the difference
between hazard, and vulnerability. How
does capacity influence vulnerability?
2) Explain in detail the vulnerability
profile of our country.
3) Define risk and suggest two ways of
reducing risk with appropriate
examples.
4) Briefly discuss the Disaster
Management Cycle with suitable
examples.
Natural Hazards & Disaster Management
10
The discussion on various terminologies has
helped us in having a basic understanding
of disaster management. However, each
hazard has its own characteristics. To
understand the significance and implications
of various types of hazards we must have a
basic understanding about the nature,
causes and effects of each hazard type and
the mitigation measures that need to be
taken up. In this chapter, we would discuss
the following hazards namely earthquake,
tsunami, landslide, flood, cyclone and
drought that we normally face in our country.
Chapter 2
NATURAL HAZARDS - CAUSES, DISTRIBUTION
PATTERN, CONSEQUENCE, AND MITIGATION
MEASURES
kilometers under the sea to 65 kilometers
under the continents. The crust is
not
one
piece but consists of portions called
‘plates’
which vary in size from a few hundred to
thousands of kilometers (Fig 2.1.1). The
‘
theory of plate tectonics’
holds that the
plates ride up on the more mobile mantle,
and are driven by some yet unconfirmed
mechanisms, perhaps thermal convection
currents. When these plates contact each
other, stress arises in the crust (Fig 2.1.2).
These stresses can be classified according
to the type of movement along the plate’s
boundaries:
a) pulling away from each other,
b) pushing against one another and
c) sliding sideways relative to each other.
All these movements are associated with
earthquakes.
The areas of stress at plate boundaries
which release accumulated energy by
slipping or rupturing are known as
'faults'
.
The theory of 'elasticity' says that the crust
is continuously stressed by the movement
of the tectonic plates; it eventually reaches
a point of maximum supportable strain. A
rupture then occurs along the fault and the
rock rebounds under its own elastic stresses
until the strain is relieved. The fault rupture
generates vibration called seismic (from the
Greek 'seismos' meaning shock or
2.1 Earthquake
Earthquake is one of the most destructive
natural hazard. They may occur at any time
of the year, day or night, with sudden impact
and little warning. They can destroy buildings
and infrastructure in seconds, killing or
injuring the inhabitants. Earthquakes not
only destroy the entire habitation but may
de-stabilize the government, economy and
social structure of the country.
But what is
an earthquake?
It is the sudden shaking of
the earth crust. The impact of an earthquake
is sudden and there is hardly any warning,
making it
impossible
to predict.
Cause of Earthquake :
The earth’s crust is a rocky layer of varying
thickness ranging from a depth of about 10
Natural Hazards & Disaster Management
11
Fig. : 2.1.1 : Tectonic Plates
Seven major plates and several minor ones- They move a few inches a year,
riding on semi-molten layers of rock underneath the crust
Fig. : 2.1.2 : Tectonic Plates
Natural Hazards & Disaster Management
12
San Andreas fault,
California, U.S.A
Table 2.1.1 Different types of plate movement
Plate Motions Examples Illustrations
Divergent - where new
crust is generated as the
plates pull away from each
other.
The Mid-Atlantic Ridge,
which splits nearly the entire
Atlantic Ocean north to
south, is probably the best-
known and most-studied
example of a divergent-plate
boundary. The rate of
spreading along the Mid-
Atlantic Ridge averages
about 2.5 centimeters per
year (cm/yr), or 25 km in a
million years.
2. Convergent - where
crust is destroyed as one
plate dives under another.
Ring of Fire and The
Himalayan mountain range
dramatically demonstrates
one of the most visible and
spectacular consequences
of plate tectonics.
3. Transformational - where
crust is neither produced
nor destroyed as the plates
slide horizontally past each
other.
The San Andreas fault
slicing through the Carrizo
Plain in the Temblor Range
east of the city of San Luis
Obispo
Mid Atlantic Ridge
Natural Hazards & Disaster Management
13
Body waves (P and S waves) penetrate
the body of the earth, vibrating fast. ‘P’
waves travel about 6 kilometers per hour
and ‘S’ waves travel with a speed of 4
kilometers per hour.
Surface waves
vibrate the ground
horizontally and vertically. These long
period waves cause swaying of tall buildings
and slight waves motion in bodies of water
even at great distances from the epicenter.
earthquake) waves, which radiates from the
focus in all directions.
The point of rupture is called the
'focus'
and
may be located near the surface or deep
below it. The point on the surface directly
above the focus is termed as the
'epicenter'
of the earthquake (see Fig 2.1.3).
Fig 2.1.3
General characteristics
Earthquake vibrations occur in a variety of
frequencies and velocities. The actual
rupture process may last for a few seconds
to as long as one minute for a major
earthquake. The ground shaking is caused
by ‘
body waves’ and ‘surface wave’.
♦ Deep:- 300 to 700 kms from the earth
surface
♦ Medium:- 60 to 300 kms
♦ Shallow: less than 60 kms
The deep focus earthquakes are rarely
destructive because by the time the waves
reach the surface the impact reduces.
Shallow focus earthquakes are more
common and are extremely damaging
because of their proximity to the surface.
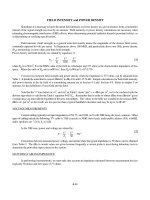
Measuring Earthquakes
Earthquakes can be described by the use
of two distinctively different scales of
measurement demonstrating magnitude
and intensity. Earthquake magnitude or
amount of energy released is determined
by the use of a
seismograph’
which is an
instrument that continuously records ground
vibration. The scale was developed by a
seismologist named
Charles Richter.
An
earthquake with a magnitude 7.5 on the
Richter scale releases 30 times the energy
than one with 6.5 magnitudes. An earthquake
of magnitude 3 is the smallest normally felt
by humans. The largest earthquake that has
been recorded with this system is 9.25
(Alaska, 1969 and Chile, 1960).
The second type of scale, the earthquake
intensity scale measures the effects of an
earthquake where it occurs. The most widely
used scale of this type was developed in 1902
by
Mercalli
an Italian seismologist. The scale
was extended and modified to suit the modern
times. It is called the Modified Mercalli Scale,
which expresses the intensity of earthquake
effect on people, structure and the earth’s
surface in values from I to XII. With an intensity
of VI and below most of the people can feel
the shake and there are cracks on the walls,
Earthquakes can be of three types based
on the focal depth:
Natural Hazards & Disaster Management
14
Fig 2.1.4 shows the adverse effect s of an earthquake
but with an intensity of XII there is general
panic with buildings collapsing totally and there
is a total disruption in normal life.
Predictability: Although some scientists claim
ability to predict earthquakes, the methods are
controversial. Accurate and exact predictions
of such sudden incidents are still not possible.
Typical adverse effects
Physical damage:
down of communication facilities. The effect
of an earthquake is diverse. There are large
number of casualties because of the poor
engineering design of the buildings and
close proximity of the people. About 95 per
cent of the people who are killed or who are
affected by the earthquake is because of
the building collapse. There is also a huge
loss to the public health system, transport
and communication and water supply in the
affected areas.
Distribution pattern of Earthquakes
in India
India falls quite prominently on the 'Alpine -
Himalayan Belt'. This belt is the line along
which the Indian plate meets the Eurasian
plate. This being a convergent plate, the
Indian plate is thrusting underneath the
Eurasian plate at a speed of 5 cm per year.
The movement gives rise to tremendous
stress which keeps accumulating in the
rocks and is released from time to time in
the form of earthquakes.
Fig 2.1.5: Fault line in India
Damage occurs to human settlement,
buildings, structures and infrastructure,
especially bridges, elevated roads, railways,
water towers, pipelines, electrical generating
facilities. Aftershocks of an earthquake can
cause much greater damage to already
weakened structures.
Secondary effects include fires, dam failure
and landslides which may block water ways
and also cause flooding. Damage may occur
to facilities using or manufacturing
dangerous materials resulting in possible
chemical spills. There may also be a break
Fig 2.1.5 Fault lines in India
Natural Hazards & Disaster Management
15
The seismic zoning map of India is divided
into four zones namely Zone II, III, IV and V,
with zone V shown in red colour in
figure 2.1.6 being most vulnerable to
earthquakes. Much of India lies in zone III.
New Delhi the capital city of India lie in zone
IV where as big cities like Mumbai and
Chennai are in zone III.
Table 2.1.2: List of significant Earthquakes in India
Year Location Magnitude of 6+
1950 Arunachal Pradesh - China Border 8.5
1956 Anjar, Gujarat 7.0
1967 Koyna, Maharashtra 6.5
1975 Kinnaur, Himachal Pradesh 6.2
1988 Manipur - Myanmar Boarder 6.6
1988 Bihar - Nepal Border 6.4
1991 Uttarkashi - Uttar Pradesh Hills 6.0
1993 Latur - Maharashtra 6.3
1997 Jabalpur, Madhya Pradesh 6.0
1999 Chamoli, Uttar Pradesh 6.8
2001 Bhuj, Gujarat 6.9
2005 Muzaffarabad (Pakistan) Impact in 7.4
Jammu & Kashmir
Fig: 2.1.6
Natural Hazards & Disaster Management
16
Possible risk reduction measures:
Community preparedness:
Community
preparedness is vital for mitigating
earthquake impact. The most effective way
to save you even in a slightest shaking is
'DROP, COVER and HOLD'.
Planning:
The Bureau of Indian Standards
has published building codes and guidelines
for safe construction of buildings against
earthquakes. Before the buildings are
constructed the building plans have to be
checked by the Municipality, according to
the laid down bylaws. Many existing lifeline
buildings such as hospitals, schools and fire
stations may not be built with earthquake
safety measures. Their earthquake safety
needs to be upgraded by retrofitting
techniques.
Public education
is educating the public
on causes and characteristics of an
Effect of Soil type on ground shaking Essential requirements in a Masonry building
earthquake and preparedness measures. It
can be created through sensitization and
training programme for community,
architects, engineers, builders, masons,
teachers, government functionaries
teachers and students.
Engineered structures: Buildings need
to be designed and constructed as per the
building by laws to withstand ground
shaking. Architectural and engineering
inputs need to be put together to improve
building design and construction practices.
The soil type needs to be analyzed before
construction. Building structures on soft
soil should be avoided. Buildings on soft
soil are more likely to get damaged even
if the magnitude of the earthquake is not
strong as shown in Figure 2.1.7. Similar
problems persist in the buildings
constructed on the river banks which have
alluvial soil.
Fig: 2.1.7
Natural Hazards & Disaster Management
17
Web Resources:
§ www.nicee.org: Website of The National
Information Center of Earthquake
Engineering (NICEE) hosted at Indian
Institute of Technology Kanpur (IITK) is
intended to collect and maintain information
resources on Earthquake Engineer-ing and
make these available to the interested
professionals, researche-rs, academicians
and others with a view to mitigate
earthquake disasters in India. The host also
gives IITK-BMTPC Earthquake Tips.
§ www.imd.ernet.in/section/seismo/static/
welcome.htm Earthquake Information –
India Meteorological Department, India. IMD
detects and locates earthquakes and
evaluates seismicity in different parts of the
country.
§ www.bmtpc.org In order to bridge the gap
between research and development and
large scale application of new building
material technologies, the erstwhile Ministry
of Urban Development, Government of
India, had established the Building Materials
And Technology Promotion Council in July
1990.
§ www.earthquake.usgs.gov Source for
science about the Earth, its natural and living
resources, natural hazards, and the
environment.
Exercise:
1. What are earthquakes ? List out the
causes of an earthquake.
2. Differentiate between magnitude and
intensity of an earthquake. How are
they measured ?
3. Identify three major mitigation
measures to reduce earthquake risk.
2.2 Tsunami
The term Tsunami has been derived from
a Japanese term Tsu meaning 'harbor' and
nami meaning 'waves'. Tsunamis are
popularly called tidal waves but they
actually have nothing to do with the tides.
These waves which often affect distant
shores, originate by rapid displacement of
water from the lake or the sea either by
seismic activity, landslides, volcanic
eruptions or large meteoroid impacts.
What ever the cause may be sea water is
displaced with a violent motion and swells
up, ultimately surging over land with great
destructive power. The effects of a
tsunami can be unnoticeable or even
destructive.
Causes of a Tsunami
The geological movements that cause
tsunamis are produced in three major
ways. The most common of these are
fault
movements on the sea floor
, accom-
panied by an earth-quake. They release
huge amount of energy and have the
capacity to cross oceans. The degree of
movement depends on how fast the
earthquake occurs and how much water
is displaced. Fig 3.1 shows how an
earthquake causes tsunami.
The second most common cause of the
tsunami is a
landslide
either occurring under
water or originating above the sea and then
plunging into the water. The largest tsunami
ever produced by a landslide was in Lituya
Natural Hazards & Disaster Management
18
Fig 2.2.2 Picture of a Tsunami
Fig 3.1 An Earthquake causing Tsunami
Bay, Alaska 1958. The massive rock slide
produced a wave that reached a high water
mark of 50 - 150 meters above the shoreline.
The third major cause of tsunami is
volcanic
activity
. The flank of a volcano located near
the shore or under water may be uplifted or
depressed similar to the action of a fault, or,
the volcano may actually explode. In 1883,
the violent explosion of the famous volcano,
Krakotoa in Indonesia, produced tsunami
measuring 40 meters which crushed upon
Java and Sumatra. Over 36,000 people lost
their lives in this tyrant waves.
General Characteristics:
Tsunami differs from ordinary ocean waves,
which are produced by wind blowing over
water. The tsunamis travel much faster than
ordinary waves. Compared to normal wave
speed of 100 kilometers per hour, tsunami
in the deep water of the ocean may travel
the speed of a jet airplane - 800 kilometers
per hour! And yet, in spite of their speed,
tsunami increases the water height only
30-45cm and often passes unnoticed by
ships at sea.
Contrary to the popular belief, the tsunami
is not a single giant wave. It is possible for a
tsunami to consist of ten or more waves
which is then termed as 'tsunami wave train'.
The waves follow each other 5 to 90 minutes
apart. Tsunami normally causes flooding as
a huge wall of water enters the main land.
Predictability:
There are two distinct types of tsunami
warning:
a) International tsunami warning systems
and
b) Regional warning systems.
Natural Hazards & Disaster Management
19
Fig 2.2.3 Flooding caused by the 2004 Tsunami in
Tamil Nadu
Tsunamis have occurred in all the oceans
and in the Mediterranean Sea, but the great
majority of them have occurred in the Pacific
Ocean. Since scientists cannot exactly
predict earthquakes, they also cannot
exactly predict when a tsunami will be
generated.
a)
International Tsunami Warning
Systems:
Shortly after the Hilo
Tsunami (1946), the Pacific Tsunami
Warning System (PTWS) was
developed with its operational center
at the Pacific Tsunami Warning Center
(PTWC) near Honolulu, Hawaii. The
PTWC is able to alert countries several
hours before the tsunami strikes. The
warning includes predicted arrival time
at selected coastal communities where
the tsunami could travel in few hours.
A tsunami watch is issued with
subsequent arrival time to other
geographic areas.
b)
Regional Warning Systems
usually
use seismic data about nearby
earthquakes to determine if there is a
possible local threat of a tsunami. Such
systems are capable enough to
provide warnings to the general public
in less than 15 minutes.
In 1995 the US National Oceanic and
Atmospheric Administration (NOAA)
began developing the Deep Ocean
Assessment and Reporting of Tsunami
(DART) system. By 2001 six stations had
been deployed in the Pacific Ocean. Each
station consists of a sea bed bottom
pressure recorder (at a depth of about
6000 m) which detects the passage of a
tsunami and transmits the data to a
surface buoy. The surface buoy then
radios the information to the PTWC.
In India, the
Survey of India
maintains a
tide gauge network along the coast of India.
The gauges are located in major ports as
shown in the figure 2.2.4. The day-to-day
maintenance of the gauge is carried with the
assistance from authorities of the ports.
Fig. 2.2.4 : Tide gauge network in India
Apart from the tide gauge, tsunami can be
detected with the help of radars. The 2004
Indian Ocean tsunami, recorded data from
four radars and recorded the height of
tsunami waves two hours after the
earthquake. It should be noted that the
satellites observations of the Indian Ocean
tsunami would not have been of any use in