COURSES FINANCIAL MANAGEMENT TOPIC FINANCIAL STATEMENTS OF VIETJET AIR JOINT STOCK COMPANY
Bạn đang xem bản rút gọn của tài liệu. Xem và tải ngay bản đầy đủ của tài liệu tại đây (2.38 MB, 130 trang )
UNIVERSITY OF TECHNOLOGY AND EDUCATION
FACULTY FOR HIGH QUALITY TRAINING
----
----
COURSES: FINANCIAL MANAGEMENT
TOPIC: FINANCIAL STATEMENTS OF VIETJET AIR JOINT STOCK
COMPANY
LECTURERS: NGUYỄN THỊ LAN ANH
STUDENTS
HÀ THỊ NGỌC ANH
PHẠM THỊ NGỌC GIÀU
TRẦN THỊ NGỌC TRÀ
NGUYỄN THỊ TÚ VY
HO CHI MINH 2021
TIEU LUAN MOI download :
UNIVERSITY OF TECHNOLOGY AND EDUCATION
FACULTY FOR HIGH QUALITY TRAINING
----
----
JOB BOOKING SCHEDULE
Major: Industrial Management Course: 2019 School year 2021 – 2022
Group: 5
Class: 19124CLA
NO.
NAME
1
HÀ THỊ NGỌC ANH
2
PHẠM THỊ NGỌC GIÀU
3
TRẦN THỊ NGỌC TRÀ
4
NGUYỄN THỊ TÚ VY
2
TIEU LUAN MOI download :
TABLE OF CONTENTS
PREAMBLE........................................................................................................................
CHAPTER 1 OVERVIEW OF VIETJET AVIATION JOINT STOCK COMPANY.......
1.1
Overview of Vietjet Aviation Joint Stock Company .....................................................
1.2
Line of business .............................................................................................................
CHAPTER 2 ANALYSIS OF FINANCIAL STATEMENTS OF VIETJET AVIATION
JOINT STOCK COMPANY...............................................................................................
2.1
Data source for analyzing financial statements of Vietjet Aviation Joint Stock
Company ..............................................................................................................................
2.2
Analysis of balance sheet: .............................................................................................
2.2.1 Analysis of the situation of asset fluctuations: ...........................................................
2.2.1.1 Horizontal analysis: .................................................................................................
2.2.1.2 Vertical analysis: ...................................................................................................
2.2
Analysis the situation of capital fluctuations: .............................................................
2.2.2.1 Horizontal analysis: ...............................................................................................
2.2.2.2 Vertical analysis: ...................................................................................................
2.3
Analysis of Income sheet: ...........................................................................................
2.3.1 Horizontal analysis: ..................................................................................................
2.3.1.1 Gross Revenues from Sales and Services Rendered: ............................................
2.3.1.2 Net profit from operating activities: ......................................................................
2.3.1.3 Results from other activities: .................................................................................
2.3.1.4 Earnings before interest and taxes: ........................................................................
2.3.1.5 Profits After Enterprise Income Tax: ....................................................................
2.3.2 Vertical analysis: ......................................................................................................
3
TIEU LUAN MOI download :
2.4 Analysis Statements of Cash Flows: ...........................................................................
2.4.1
Net Profits from Operating Activities .................................................................
2.4.1
Cash Flow from Investing Activities:..................................................................
2.4.2.1 Horizontal analysis: ...............................................................................................
2.4.2.2 Vertical analysis: ...................................................................................................
2.4.3
Cash Flow from Financing Activities..................................................................
2.5 Analysis of financial ratios: .........................................................................................
2.5.1
Analysis Liquidity Ratio: ....................................................................................
2.5.1.1 Liquidity ratio: .......................................................................................................
2.5.1.2 Analysis quick ratios: ............................................................................................
2.5.1.3. Analysis Cash Ratio: ............................................................................................
2.5.2
Analysis Solvency: ...............................................................................................
2.5.2.1 Total-Debt-to-Total-Assets Ratio: .........................................................................
2.5.2.2 Debt to equity ratio: ...............................................................................................
2.5.2.3 Times interest earned Ratio: ..................................................................................
2.5.3
Analysis activity ratios: ........................................................................................
2.5.3.1 Asset turnover ratio: ..............................................................................................
2.5.3.2.
Fixed asset turnover: ...................................
2.5.3.2.
Inventory Turnover: ......................................
2.5.4
Profitability index analysis: ..................................................................................
2.5.4.1
Return on Sales (ROSA) ..............................
2.5.4.2
Return on Assets (ROAA): ...........................
2.5.4.3 Return on Equity (ROEA): ...............................................................................
2.5.4.4 Return on capital employed (ROCE): .................................................................
4
TIEU LUAN MOI download :
2.5.4.5 Correlation analysis of P/E and EPS:............................................... 107
CHAPTER 3 COMMENTS AND SUGGESTIONS......................................... 114
3.1 Comment on financial situation:........................................................... 114
3.1.1 Comments on the property:.............................................................. 114
3.1.2 Comments on capital sources:.......................................................... 114
3.1.3 Comments on business activities:..................................................... 114
3.1.4 Comments on solvency:................................................................... 115
3.2 Recommendations:............................................................................ 115
3.2.1 Recommendations on the company's financial position:........................ 115
CONCLUSION....................................................................................... 118
REFERENCES....................................................................................... 119
APPENDIX 1......................................................................................... 120
APPENDIX 2......................................................................................... 121
APPENDIX 3......................................................................................... 123
5
TIEU LUAN MOI download :
TABLE LIST
Table 2.1 Balance sheet ....................................................................................................... 6
Table of vertical asset movements from the first quarter of 2019 to the second quarter of
2021 ................................................................................................................................... 26
Table 2.2.2.1 The situation of capital fluctuations from quarter I/2019 to quarter II/2021
........................................................................................................................................... 30
Table: Movement of vertical capital from the first quarter of 20129 to the second quarter
of 2021 ...............................................................................................................................
Table of data analyzing business results from the first quarter of 2019 to the second
quarter of 2021 ...................................................................................................................
Table Business Ratio Analysis ..........................................................................................
Table “Results from other activities from quarter I/2019 to quarter II/2021” ..................
Table Vertical analysis of business results from the first quarter of 2019 to the second
quarter of 2021 ...................................................................................................................
Table 2.9 Summary of cash flow statement for the period from the first quarter of 2019 to
the second quarter of 2021 ................................................................................................
Table 2.10 Cash Flow Ratio Analysis: ..............................................................................
Table 2.11
Cash Flow A
Table Component breakdown of net cash flows from vertical investing ..........................
Table 2.13
Analysis of f
Table 2.14
Liquidity Ra
Table 2.15: quick ratios off the capabilities of peers ........................................................
Table 2.16
Table of debt to equity ratio compared to peers in the same industry...............................
Table Profitability Index ....................................................................................................
TIEU LUAN MOI download :
Cash Ratio o
Table Return on Sales (ROS) compared to companies in the same industry......97
Table Return on total assets ROA compared to companies in the same industry
100
Table Return on Equity ROE compared to peers in the same industry.............103
Table EPS ratio compared to other companies in the same industry................ 112
7
TIEU LUAN MOI download :
LIST OF CHARTS
Graph 2.1. Changes in assets of Vietjet from the first quarter of 2019 to the second
quarter of 2021 .....................................................................................................................
Graph 2.11
"Cha
Graph 2.12
“Cha
Graph 2.14
“C
Graph 2.16
“T
quarter of 2019 to the second quarter of 2021” .................................................................
Graph: The situation in gross profit between quarters in the period of 2019-2021 ..........
Graph “The fluctuation of net profit between quarters in the period of 2019-2021” ........
Graph earnings before interest and taxes ...........................................................................
Graph Profits After Enterprise Income Tax: .....................................................................
Graph Net Profits from Operating Activities ....................................................................
Graph “Cash flow fluctuations from investment activities in the first quarter of 2019 to
the second quarter of 2021” ...............................................................................................
Graph of Cash Flow Analysis from quarter I/2019 to quarter II/2021 ..............................
Graph 2.22
Ca
2021 ...................................................................................................................................
Graph 2.23
C
2021 of Vietjet ...................................................................................................................
Graph 2.24: Changes Liquidity Ratio between 2019 and 2021 of Vietjet and Vietnam
Airlines ..............................................................................................................................
Graph 2.25
Ch
8
TIEU LUAN MOI download :
Graph 2.26 Fluctuations in cash Ratio 2019 – 2021 of Vietjet and Vietnam Airlines ......
Graph "The volatility of long-term debt solvency ratios for the period of 2019 - 2021" . 86
Table "Total-Debt-to-Total-Assets Ratio of companies in the same industry" .................
Graph Total-Debt-to-Total-Assets Ratio of companies in the same industry ...................
Graph Debt-to-equity ratio compared to companies in the same industry ........................
Graph Times interest earned Ratio compared to companies in the same industry ...........
Graph of Vietjet's asset turnover from the first quarter of 2019 to the second quarter of
2021 ................................................................................................................................... 91
Graph The chart of fixed asset turnover of Vietjet from quarter I/2019 to quarter II/2021
...........................................................................................................................................
Graph The chart of Vietjet's inventory turnover from the first quarter of 2019 to the
second quarter of 2021 ......................................................................................................
Graph Profitability Index ...................................................................................................
Graph Return on Sales (ROS) compared to companies in the same industry ...................
Graph Return on total assets ROA compared to companies in the same industry ..........
Graph P / E system number compared with companies in the same industry ................
Graph EPS ratio compared to other companies in the same industry .............................
9
TIEU LUAN MOI download :
ROS
ROA
ROE
ROC
PE
EPS
VJC
HVN
QOQ
YOY
10
TIEU LUAN MOI download :
PREAMBLE
The business's financial situation is one of the issues that are always of concern not
only to business owners, managers but also to bankers, lenders, and investors. That is
why regular financial analysis is very important. The calculation and financial analysis
will show the asset situation, the situation and results of production and business
activities, the cash flow situation, and the movement of capital use of the enterprise.
From there, businesses will grasp their strengths and weaknesses, and based on that
business managers can identify the causes, make suggestions to overcome
weaknesses as well as promote the weaknesses. the strength that your business has.
For a business or any business organization, big or small, it is imperative to understand
the business performance and financial situation of your business or organization. To do
this, one of the first things to do is analyze the financial statements.
Financial statement analysis not only provides information to those interested in
the business such as managers, investors, etc., but it also evaluates the inherent
potentials, capabilities, and strengths in the business. production and business of
enterprises as well as the problems that enterprises are facing. Through that, it will
be easier for businesses to determine effective decisions and steps for future
development. Therefore, analyzing financial statements is an important tool that
any business or business organization should have.
Currently, in the context of the outbreak of the Covid-19 epidemic in many parts of
the world and even in Vietnam, this has severely affected the business activities of
the aviation industry in general and Vietjet Air Joint Stock Company. in particular.
Therefore, the writer chooses the topic "Analysis of financial statements of "Vietjet
Air Joint Stock Company" to analyze the group's report.
1
TIEU LUAN MOI download :
CHAPTER 1 OVERVIEW OF VIETJET AVIATION JOINT STOCK COMPANY 1.1
Overview of Vietjet Aviation Joint Stock Company
Vietjet Air is the first airline in Vietnam operating under the new generation airline model,
low cost and providing a variety of services for customers to choose from. The airline
not only transports air but also provides the consumer needs of goods and services to
customers through advanced e-commerce technology applications.
Vietjet is an official member of the International Air Transport Association (IATA)
with the IOSA Operational Safety Certificate. Safety Culture is an important part of
Vietjet's corporate culture, which is thoroughly understood from the leadership to
each employee throughout the system.
Business information:
•
Vietnamese name: VIETJET AIRLINES JOINT STOCK COMPANY
•
Short name: VIETJET., JSC
•
Trade Name: VIETJET AIR
• Enterprise code: 0102325399 issued by Hanoi Department of Planning and Investment for
the first time on July 23, 2007, changed for the 27th time on August 1, 2018
•
Air transport business license: No. 04/2016/GPKDVCHK issued on December 30, 2016
•
Charter capital: 5,416,113,340,000 VND
•
Total ordinary shares: 541,611,334 shares
•
Listing date on Ho Chi Minh City Stock Exchange (HOSE): February 28, 2017
•
Stock code: VJC
• Independent Auditor: Branch of KPMG Co., Ltd in Ho Chi Minh City. Ho Chi Minh
– Vietnam
2
TIEU LUAN MOI download :
1.2 Line of business
Vietjet's business activities focus on 5 main groups, including:
Main activities the main activities of the Company and its subsidiaries are to provide
passenger and cargo transportation services on domestic and international routes and
related support activities and purchases. aircraft and aircraft parts.
3
TIEU LUAN MOI download :
CHAPTER 2 ANALYSIS OF FINANCIAL STATEMENTS OF VIETJET
AVIATION JOINT STOCK COMPANY
2.1 Data source for analyzing financial statements of Vietjet Aviation Joint
Stock Company
- Consolidated financial statements for the quarters of 2019 include:
Financial statements for the first quarter of 2019 for the period from January 1,
2019 to March 31, 2019 (form B01 - DH/HN) issued in accordance with Circular
No. 202/2014/TT-BTC dated 22 December 2014 of the Ministry of Finance.
Financial statements for the second quarter of 2019 for the period from April 1,
2019 to June 30, 2019 (form B01 - DH/HN) issued in accordance with Circular No.
202/2014/TT-BTC dated 22 December 2014 of the Ministry of Finance.
Financial statements for the third quarter of 2019 for the period from July 1, 2019
to September 30, 2019 (form B01 - DH/HN) issued in accordance with Circular No.
202/2014/TT-BTC dated 22 December 2014 of the Ministry of Finance.
Financial statements for the fourth quarter of 2019 for the period from October 1, 2019
to December 31, 2019 (form B01 - DH/HN) issued in accordance with Circular No.
202/2014/TT-BTC dated 22 December 2014 of the Ministry of Finance.
Consolidated financial statements for the quarters of 2020 include:
Financial statements for the first quarter of 2020 for the period from January 1,
2020 to March 31, 2020 (form B01 - DH/HN) issued in accordance with Circular
No. 202/2014/TT-BTC dated 22 December 2014 of the Ministry of Finance.
Financial statements for the second quarter of 2020 for the period from April 1,
2020 to June 30, 2019 (form B01 - DH/HN) issued according to Circular No.
202/2014/TT-BTC dated 22 December 2014 of the Ministry of Finance.
Financial statements for the third quarter of 2020 for the period from July 1, 2020
to September 30, 2020 (form B01 - DH/HN) issued in accordance with Circular No.
202/2014/TT-BTC dated 22 December 2014 of the Ministry of Finance.
4
TIEU LUAN MOI download :
Financial statements for the fourth quarter of 2020 for the period from October 1, 2019
to December 31, 2020 (form B01 - DH/HN) issued in accordance with Circular No.
202/2014/TT-BTC dated 22 December 2014 of the Ministry of Finance.
Consolidated financial statements for the quarters of 2021 include:
Financial statements for the first quarter of 2021 for the period from January 1,
2021 to March 31, 2019 (form B01 - DH/HN) issued in accordance with Circular
No. 202/2014/TT-BTC dated 22 December 2014 of the Ministry of Finance.
Financial statements for the second quarter of 2021 for the period from April 1,
2021 to June 30, 2019 (form B01 - DH/HN) issued in accordance with Circular No.
202/2014/TT-BTC dated 22 December 2014 of the Ministry of Finance.
2.2 Analysis of balance sheet:
2.2.1 Analysis of the situation of asset fluctuations:
The balance sheet is a consolidated financial statement, which generally reflects
the total value of existing assets and the source of capital to form an enterprise's
assets at a certain asset.
The content of the balance sheet is shown through a system of indicators
reflecting the situation of assets and the source of capital to form assets. The
targets are classified and arranged into categories, specific objectives and targets
in accordance with the requirements of management.
2.2.1.1 Horizontal analysis:
5
TIEU LUAN MOI download :
Table 2.1 Balance sheet
Criteria
Quarter 1-2019
I – SHORT19,002,091,982,471
TERM
ASSETS
1. Cash and
cash
5,098,305,305,035
equivalents
2. Short-term
876,400,000,000
investments
3. Short-term
12,230,652,002,429
receivables
4. Inventory
5. Other
current assets
362,996,426,991
399,813,148,008
433,738,248,016
473,263,092,074
446,029,517,428
427,280,833,678
300,225,325,630
245,592,743,777
243,836,047,088
II - LONGTERM 22,385,118,532,293 21,954,917,384,417 22,301,728,341,075 20,981,887,293,169 24,672,632,357,080 23,584,364,727,989 22,753,771,934,233 22,591,631,380,013 2
ASSET
1. Long-term
receivables
13,503,018,744,273
12,116,403,885,432
12,909,933,171,407
12,939,507,707,180
14,656,334,734,962
14,784,259,222,748
15,501,406,488,782
15,410,005,431,192
1
2. Fixed
1,
assets
6
TIEU LUAN MOI download :
3. Long-term
assets in 1,251,646,735,143 1,798,970,950,725 1,783,715,438,065 1,318,591,797,825 1,355,314,286,902 738,283,912,782 785,340,638,606 788,714,653,737 progress
4. Long-term
investments
68,424,629,818
68,424,629,818
215,973,206,218
215,973,206,218
215,973,206,218
215,973,206,218
215,973,206,218
215,973,206,218
5. Other
long-term 5,953,366,117,413 6,401,771,697,767 5,832,735,772,462 5,212,893,496,563 7,163,327,271,607 7,105,421,705,853 5,409,985,468,639 5,326,441,697,527 4 assets
TOTAL
41,387
ASSETS
7
TIEU LUAN MOI download :
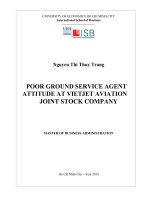
Graph 2.1. Changes in assets of Vietjet from the first quarter of 2019 to the
second quarter of 2021
Total asset
50,000,000,000,000
48,000,000,000,000
46,000,000,000,000
44,000,000,000,000
42,000,000,000,000
40,000,000,000,000
38,000,000,000,000
36,000,000,000,000
Quarter Quarter Quarter Quarter Quarter Quater Quarter Quarter Quarter Quarter
1-2019 2-2019 3-2019 4-2019 1-2020 2-2020 3-2020 4-2020 1-2021 2-2021
(Source: Table 2.1. Movement of assets from the first quarter of 2019 to the
second quarter of 2021)
From "Graph 2.1: Changes in total assets between the second quarter of 2021 compared to
the first quarter and the quarters of 2019 and 2020", we can see that the company's total
assets grew in the second quarter of 2019 reaching VND 44,460,886,357,649 and started to
decrease in the third quarter of 2019 with VND 43,146,293,080,207. Then there was a strong
growth in the fourth quarter of 2019 reaching VND 47,608,358,739,075. However, the
company's total assets began to show signs of a slight decrease in the first quarter of 2020
with VND 46,905,133,409,742 and continued to grow strongly in the second quarter of 2020
with total assets of VND 48,392,509,085,938. Then it decreased again in the third quarter of
2020 with VND
45,304,421,406,045. From the fourth quarter of 2020, the company's total assets tended to
grow steadily in the fourth quarter of 2020 and the first quarter of 2021 with total assets of
47,088,256,669,717 VND and 47,497,810,235,588 VND respectively. Then
8
TIEU LUAN MOI download :