Diff eqs computing modeling 5e henry edwards
Bạn đang xem bản rút gọn của tài liệu. Xem và tải ngay bản đầy đủ của tài liệu tại đây (10.54 MB, 579 trang )
DIFFERENTIAL
EQUATIONS
Computing and Modeling
www.pdfgrip.com
This page intentionally left blank
www.pdfgrip.com
DIFFERENTIAL
EQUATIONS
Computing and Modeling
Fifth Edition
C. Henry Edwards
David E. Penney
The University of Georgia
with the assistance of
David Calvis
Baldwin Wallace College
Boston Columbus Indianapolis New York San Francisco Upper Saddle River
´
Amsterdam Cape Town Dubai London Madrid Milan Munich Paris Montreal
Toronto
˜ Paulo Sydney Hong Kong Seoul Singapore Taipei Tokyo
Dehli Mexico City Sao
www.pdfgrip.com
Editor: William Hoffman
Editorial Assistant: Salena Casha
Project Manager: Beth Houston
Marketing Manager: Jeff Weidenaar
Marketing Assistant: Brooke Smith
Senior Author Support/Technology Specialist: Joe Vetere
Rights and Permissions Advisor: Aptara, Inc.
Procurement Specialist: Carol Melville
Associate Director of Design: Andrea Nix
Design Team Lead: Heather Scott
Text Design, Production Coordination, Composition: Dennis Kletzing, Kletzing Typesetting Corp.
Illustrations: George Nichols
Cover Design: Studio Montage
Cover Image: Onne van der Wal/Corbis
Many of the designations used by manufacturers and sellers to distinguish their products are claimed
as trademarks. Where those designations appear in this book, and Pearson Education was aware of a
trademark claim, the designations have been printed in initial caps or all caps.
Library of Congress Cataloging-in-Publication Data
Edwards, C. Henry (Charles Henry), author.
[Differential equations and boundary value problems. Chapter 1–7]
Differential equations : computing and modeling / C. Henry Edwards, David E. Penney, The
University of Georgia, David Calvis, Baldwin Wallace College. -- Fifth edition.
pages cm
Includes bibliographical references and index.
ISBN-13: 978-0-321-81625-2 (hardcover)
ISBN-10: 0-321-81625-0 (hardcover)
1. Differential equations. I. Penney, David E., author. II. Calvis, David, author. III.
Title.
QA371.E29 2015
515'.35--dc23
2013041777
Copyright c 2015, 2008, 2004 Pearson Education, Inc.
All rights reserved. No part of this publication may be reproduced, stored in a retrieval system, or transmitted, in any form or by any means, electronic, mechanical, photocopying, recording, or otherwise,
without the prior written permission of the publisher. Printed in the United States of America. For
information on obtaining permission for use of material in this work, please submit a written request to
Pearson Education, Inc., Rights and Contracts Department, 501 Boylston Street, Suite 900, Boston, MA
02116, fax your request to 617-671-3447, or e-mail at />
1 2 3 4 5 6 7 8 9 10—EB—18 17 16 15 14
www.pearsonhighered.com
ISBN 10: 0-321-81625-0
ISBN 13: 978-0-321-81625-2
www.pdfgrip.com
CONTENTS
Application Modules
Preface ix
CHAPTER
1
First-Order Differential Equations
1.1
1.2
1.3
1.4
1.5
1.6
CHAPTER
2
2.1
2.2
2.3
2.4
2.6
3
1
Differential Equations and Mathematical Models
Integrals as General and Particular Solutions 10
Slope Fields and Solution Curves 17
Separable Equations and Applications 30
Linear First-Order Equations 45
Substitution Methods and Exact Equations 57
1
Mathematical Models and Numerical Methods
2.5
CHAPTER
vii
Population Models 75
Equilibrium Solutions and Stability 86
Acceleration–Velocity Models 93
Numerical Approximation: Euler’s Method
A Closer Look at the Euler Method 116
The Runge–Kutta Method 126
Linear Equations of Higher Order
3.1
3.2
3.3
3.4
3.5
3.6
3.7
3.8
75
104
136
Introduction: Second-Order Linear Equations 136
General Solutions of Linear Equations 149
Homogeneous Equations with Constant Coefficients 162
Mechanical Vibrations 172
Nonhomogeneous Equations and Undetermined Coefficients
Forced Oscillations and Resonance 197
Electrical Circuits 209
Endpoint Problems and Eigenvalues 216
184
v
www.pdfgrip.com
vi
Contents
CHAPTER
4
CHAPTER
5
Introduction to Systems of Differential Equations
4.1
4.2
4.3
5.1
5.2
5.3
5.4
5.6
5.7
6
7
Matrices and Linear Systems 264
The Eigenvalue Method for Homogeneous Systems 282
A Gallery of Solution Curves of Linear Systems 296
Second-Order Systems and Mechanical Applications 322
Multiple Eigenvalue Solutions 335
Matrix Exponentials and Linear Systems 349
Nonhomogeneous Linear Systems 363
Nonlinear Systems and Phenomena
6.1
6.2
6.3
6.4
6.5
CHAPTER
264
Linear Systems of Differential Equations
5.5
CHAPTER
First-Order Systems and Applications 228
The Method of Elimination 239
Numerical Methods for Systems 249
Stability and the Phase Plane 372
Linear and Almost Linear Systems 383
Ecological Models: Predators and Competitors
Nonlinear Mechanical Systems 408
Chaos in Dynamical Systems 426
Laplace Transform Methods
7.1
7.2
7.3
7.4
7.5
7.6
372
395
437
Laplace Transforms and Inverse Transforms 437
Transformation of Initial Value Problems 447
Translation and Partial Fractions 458
Derivatives, Integrals, and Products of Transforms 467
Periodic and Piecewise Continuous Input Functions 474
Impulses and Delta Functions 484
References for Further Study 494
Appendix: Existence and Uniqueness of Solutions 497
Answers to Selected Problems 511
Index 558
www.pdfgrip.com
228
APPLICATION MODULES
The modules listed here follow the indicated sections in the text. Most provide computing projects that illustrate the
content of the corresponding text sections. Maple, Mathematica, and MATLAB versions of these investigations are
included in the Applications Manual that accompanies this text.
Computer-Generated Slope Fields and
Solution Curves
1.4 The Logistic Equation
1.5 Indoor Temperature Oscillations
1.6 Computer Algebra Solutions
1.3
2.1
2.3
2.4
2.5
2.6
3.1
3.2
3.3
3.5
3.6
6.1
6.2
6.3
6.4
Logistic Modeling of Population Data
Rocket Propulsion
Implementing Euler’s Method
Improved Euler Implementation
Runge–Kutta Implementation
7.1
7.2
Plotting Second-Order Solution Families
Plotting Third-Order Solution Families
Approximate Solution of Linear Equations
Automated Variation of Parameters
Forced Vibrations
Gravitation and Kepler’s Laws of Planetary
Motion
4.2 Computer Algebra Solution of Systems
4.3 Comets and Spacecraft
7.3
7.5
8.2
8.3
8.4
4.1
5.1
5.2
5.3
5.4
5.5
5.6
5.7
Automatic Solution of Linear Systems
Automatic Calculation of Eigenvalues and
Eigenvectors
Dynamic Phase Plane Graphics
Earthquake-Induced Vibrations of Multistory
Buildings
Defective Eigenvalues and Generalized
Eigenvectors
Automated Matrix Exponential Solutions
Automated Variation of Parameters
8.6
9.2
9.3
9.5
9.6
10.1
10.2
10.3
10.4
Phase Plane Portraits and First-Order
Equations
Phase Plane Portraits of Almost Linear
Systems
Your Own Wildlife Conservation Preserve
The Rayleigh, van der Pol, and
FitzHugh-Nagumo Equations
Computer Algebra Transforms and Inverse
Transforms
Transforms of Initial Value Problems
Damping and Resonance Investigations
Engineering Functions
Automatic Computation of Series
Coefficients
Automating the Frobenius Series Method
The Exceptional Case by Reduction of
Order
Riccati Equations and Modified Bessel
Functions
Computer Algebra Calculation of Fourier
Coefficients
Fourier Series of Piecewise Smooth Functions
Heated-Rod Investigations
Vibrating-String Investigations
Numerical Eigenfunction Expansions
Numerical Heat Flow Investigations
Vibrating Beams and Diving Boards
Bessel Functions and Heated Cylinders
vii
www.pdfgrip.com
PREFACE
T
his is a textbook for the standard introductory differential equations course
taken by science and engineering students. Its updated content reflects the
wide availability of technical computing environments like Maple, Mathematica,
and MATLAB that now are used extensively by practicing engineers and scientists. The traditional manual and symbolic methods are augmented with coverage
of qualitative and computer-based methods that employ numerical computation and
graphical visualization to develop greater conceptual understanding. A bonus of
this more comprehensive approach is accessibility to a wider range of more realistic
applications of differential equations.
Principal Features of This Revision
This 5th edition is a comprehensive and wide-ranging revision.
In addition to fine-tuning the exposition (both text and graphics) in numerous
sections throughout the book, new applications have been inserted (including biological), and we have exploited throughout the new interactive computer technology
that is now available to students on devices ranging from desktop and laptop computers to smart phones and graphing calculators. It also utilizes computer algebra
systems such as Mathematica, Maple, and MATLAB as well as online web sites
such as WolframjAlpha.
However, with a single exception of a new section inserted in Chapter 5 (noted
below), the classtested table of contents of the book remains unchanged. Therefore,
instructors’ notes and syllabi will not require revision to continue teaching with this
new edition.
A conspicuous feature of this edition is the insertion of about 75 new computergenerated figures, many of them illustrating how interactive computer applications
with slider bars or touchpad controls can be used to change initial values or parameters in a differential equation, allowing the user to immediately see in real time the
resulting changes in the structure of its solutions.
Some illustrations of the various types of revision and updating exhibited in
this edition:
New Interactive Technology and Graphics New figures inserted throughout illustrate the facility offered by modern computing technology platforms
for the user to interactively vary initial conditions and other parameters in real
time. Thus, using a mouse or touchpad, the initial point for an initial value
problem can be dragged to a new location, and the corresponding solution
curve is automatically redrawn and dragged along with its initial point. For
instance, see the application modules for Sections 1.3 (page 28) and 3.1 (page
148). Using slider bars in an interactive graphic, the coefficients or other parameters in a linear system can be varied, and the corresponding changes in
its direction field and phase plane portrait are automatically shown; see the
Section 5.3 application module (page 319).
viii
www.pdfgrip.com
Preface
ix
New Exposition In a number of sections, new text and graphics have been
inserted to enhance student understanding of the subject matter. For instance,
see the new introductory treatments of separable equations in Section 1.4
(page 30), of linear equations in Section 1.5 (page 45), of isolated critical
points in Sections 6.1 (page 372) and 6.2 (page 383) and the new example in
Section 9.6 (on page 618) showing a vibrating string with a momentary “flat
spot”. Examples and accompanying graphics have been updated in Sections
2.4-2.6 and 4.2-4.3 to illustrate new graphing calculators.
New Content The single entirely new section for this edition is Section
5.3, which is devoted to the construction of a “gallery” of phase plane portraits illustrating all the possible geometric behaviors of solutions of the 2dimensional linear system x D Ax. In motivation and preparation for the
detailed study of eigenvalue-eigenvector methods in subsequent sections of
Chapter 5 (which then follow in the same order as in the previous edition), Section 5.3 shows how the particular arrangements of eigenvalues and
eigenvectors of the coefficient matrix A correspond to identifiable patterns—
“fingerprints,” so to speak—in the phase plane portrait of the system x D Ax.
The resulting gallery is shown in the two pages of phase plane portraits that
comprise Figure 5.3.16 (pages 315–316) at the end of the section. The new 5.3
application module (on dynamic phase plane portraits, page 319) shows how
students can use interactive computer systems to “bring to life” this gallery, by
allowing initial conditions, eigenvalues, and even eigenvectors to vary in real
time. This dynamic approach is then illustrated with several new graphics inserted in the remainder of Chapter 5. Finally, for a new biological application,
see the application module for Section 6.4, which now includes a substantial investigation (page 423) of the nonlinear FitzHugh-Nagumo equations in
neuroscience, which were introduced to model the behavior of neurons in the
nervous system.
Computing Features
The following features highlight the computing technology that distinguishes much
of our exposition.
Over 500 computer-generated figures show students vivid pictures of direction
fields, solution curves, and phase plane portraits that bring symbolic solutions
of differential equations to life.
About 30 application modules follow key sections throughout the text. Most
of these applications outline “technology neutral” investigations illustrating
the use of technical computing systems and seek to actively engage students
in the application of new technology.
A fresh numerical emphasis that is afforded by the early introduction of numerical solution techniques in Chapter 2 (on mathematical models and numerical methods). Here and in Chapter 4, where numerical techniques for
systems are treated, a concrete and tangible flavor is achieved by the inclusion of numerical algorithms presented in parallel fashion for systems ranging
from graphing calculators to MATLAB.
Modeling Features
Mathematical modeling is a goal and constant motivation for the study of differential equations. To sample the range of applications in this text, take a look at the
following questions:
What explains the commonly observed time lag between indoor and outdoor
daily temperature oscillations? (Section 1.5)
www.pdfgrip.com
x
Preface
What makes the difference between doomsday and extinction in alligator populations? (Section 2.1)
How do a unicycle and a twoaxle car react differently to road bumps? (Sections 3.7 and 5.4)
How can you predict the time of next perihelion passage of a newly observed
comet? (Section 4.3)
Why might an earthquake demolish one building and leave standing the one
next door? (Section 5.4)
What determines whether two species will live harmoniously together, or
whether competition will result in the extinction of one of them and the survival of the other? (Section 6.3)
Why and when does non-linearity lead to chaos in biological and mechanical
systems? (Section 6.5)
If a mass on a spring is periodically struck with a hammer, how does the
behavior of the mass depend on the frequency of the hammer blows? (Section
7.6)
Organization and Content
We have reshaped the usual approach and sequence of topics to accommodate new
technology and new perspectives. For instance:
After a precis of first-order equations in Chapter 1 (though with the coverage of certain traditional symbolic methods streamlined a bit), Chapter 2 offers an early introduction to mathematical modeling, stability and qualitative
properties of differential equations, and numerical methods—a combination
of topics that frequently are dispersed later in an introductory course. Chapter
3 includes the standard methods of solution of linear differential equations of
higher order, particularly those with constant coefficients, and provides an especially wide range of applications involving simple mechanical systems and
electrical circuits; the chapter ends with an elementary treatment of endpoint
problems and eigenvalues.
Chapters 4 and 5 provide a flexible treatment of linear systems. Motivated
by current trends in science and engineering education and practice, Chapter 4 offers an early, intuitive introduction to first-order systems, models, and
numerical approximation techniques. Chapter 5 begins with a self-contained
treatment of the linear algebra that is needed, and then presents the eigenvalue
approach to linear systems. It includes a wide range of applications (ranging
from railway cars to earthquakes) of all the various cases of the eigenvalue
method. Section 5.5 includes a fairly extensive treatment of matrix exponentials, which are exploited in Section 5.6 on nonhomogeneous linear systems.
Chapter 6 on nonlinear systems and phenomena ranges from phase plane analysis to ecological and mechanical systems to a concluding section on chaos
and bifurcation in dynamical systems. Section 6.5 presents an elementary introduction to such contemporary topics as period-doubling in biological and
mechanical systems, the pitchfork diagram, and the Lorenz strange attractor
(all illustrated with vivid computer graphics).
Laplace transform methods (Chapter 7) follow the material on linear and nonlinear systems, but can be covered at any earlier point (after Chapter 3) the
instructor desires.
This book includes enough material appropriately arranged for different
courses varying in length from one quarter to two semesters. The longer version
Differential Equations and Boundary Value Problems: Computing and Modeling
www.pdfgrip.com
Preface
xi
(0-321-79698-5) contains additional chapters on power series methods, Fourier series, separation of variables and partial differential equations).
Student and Instructor Resources
The answer section has been expanded considerably to increase its value as a learning aid. It now includes the answers to most odd-numbered problems plus a good
many even-numbered ones. The Instructor’s Solutions Manual (0-321-797019) available at www.pearsonhighered.com/irc provides worked-out solutions
for most of the problems in the book, and the Student Solutions Manual (0-32179700-0) contains solutions for most of the odd-numbered problems. Both manuals
have been reworked extensively for this edition with improved explanations and
more details inserted in the solutions of many problems.
The approximately 30 application modules in the text contain additional problem and project material designed largely to engage students in the exploration
and application of computational technology. These investigations are expanded
considerably in the Applications Manual (0-321-79704-3) that accompanies the
text and supplements it with additional and sometimes more challenging investigations. Each section in this manual has parallel subsections Using Maple, Using
Mathematica, and Using MATLAB that detail the applicable methods and techniques of each system, and will afford student users an opportunity to compare the
merits and styles of different computational systems. These materials—as well as
the text of the Applications Manual itself—are freely available at the web site
www.pearsonhighered.com/mathstatsresources.
Acknowledgments
In preparing this revision, we profited greatly from the advice and assistance of the
following very capable and perceptive reviewers:
Anthony Aidoo, Eastern Connecticut State University
Brent Solie, Knox College
Elizabeth Bradley, University of Louisville
Gregory Davis, University of Wisconsin-Green Bay
Zoran Grujic, University of Virginia
Richard Jardine, Keene State College
Yang Kuang, Arizona State University
Dening Li, West Virginia University
Francisco Sayas-Gonzalez, University of Delaware
Luther White, University of Oklahoma
Hong-Ming Yin, Washington State University
Morteza Shafii-Mousavi, Indiana University-South Bend
It is a pleasure to (once again) credit Dennis Kletzing and his extraordinary
TEXpertise for the attractive presentation of the text and the art in this book. We
are grateful to our editor, William Hoffman, for his support and inspiration of this
revision; to Salena Casha for her coordination of the editorial process and Beth
Houston for her supervision of the production of this book; and to Joe Vetere for his
assistance with technical aspects of the development of its extensive supplementary
resources. Finally, we dedicate this edition to our colleague David E. Penney who
passed away on June 3, 2014.
Henry Edwards
David Calvis
www.pdfgrip.com
This page intentionally left blank
www.pdfgrip.com
1
First-Order
Differential Equations
1.1 Differential Equations and Mathematical Models
T
he laws of the universe are written in the language of mathematics. Algebra
is sufficient to solve many static problems, but the most interesting natural
phenomena involve change and are described by equations that relate changing
quantities.
Because the derivative dx=dt D f 0 .t / of the function f is the rate at which
the quantity x D f .t / is changing with respect to the independent variable t , it
is natural that equations involving derivatives are frequently used to describe the
changing universe. An equation relating an unknown function and one or more of
its derivatives is called a differential equation.
Example 1
The differential equation
dx
D x2 C t 2
dt
involves both the unknown function x.t / and its first derivative x 0 .t / D dx=dt . The differential
equation
d 2y
dy
C3
C 7y D 0
2
dx
dx
involves the unknown function y of the independent variable x and the first two derivatives
y 0 and y 00 of y .
The study of differential equations has three principal goals:
1. To discover the differential equation that describes a specified physical
situation.
2. To find—either exactly or approximately—the appropriate solution of that
equation.
3. To interpret the solution that is found.
In algebra, we typically seek the unknown numbers that satisfy an equation
such as x 3 C 7x 2 11x C 41 D 0. By contrast, in solving a differential equation, we
1
www.pdfgrip.com
2
Chapter 1 First-Order Differential Equations
are challenged to find the unknown functions y D y.x/ for which an identity such
as y 0 .x/ D 2xy.x/—that is, the differential equation
dy
D 2xy
dx
—holds on some interval of real numbers. Ordinarily, we will want to find all
solutions of the differential equation, if possible.
Example 2
If C is a constant and
2
y.x/ D C e x ;
(1)
then
Á
Á
dy
2
2
D C 2xe x D .2x/ C e x D 2xy:
dx
Thus every function y.x/ of the form in Eq. (1) satisfies—and thus is a solution of—the
differential equation
dy
D 2xy
(2)
dx
for all x . In particular, Eq. (1) defines an infinite family of different solutions of this differential equation, one for each choice of the arbitrary constant C . By the method of separation of
variables (Section 1.4) it can be shown that every solution of the differential equation in (2)
is of the form in Eq. (1).
Differential Equations and Mathematical Models
The following three examples illustrate the process of translating scientific laws and
principles into differential equations. In each of these examples the independent
variable is time t , but we will see numerous examples in which some quantity other
than time is the independent variable.
Example 3
Temperature A
Newton’s law of cooling may be stated in this way: The time rate of change (the rate of
change with respect to time t ) of the temperature T .t / of a body is proportional to the difference between T and the temperature A of the surrounding medium (Fig. 1.1.1). That is,
dT
D
dt
Temperature T
FIGURE 1.1.1. Newton’s law of
cooling, Eq. (3), describes the cooling
of a hot rock in water.
Example 4
k.T
A/;
(3)
where k is a positive constant. Observe that if T > A, then d T=dt < 0, so the temperature is
a decreasing function of t and the body is cooling. But if T < A, then d T=dt > 0, so that T
is increasing.
Thus the physical law is translated into a differential equation. If we are given the
values of k and A, we should be able to find an explicit formula for T .t /, and then—with the
aid of this formula—we can predict the future temperature of the body.
Torricelli’s law implies that the time rate of change of the volume V of water in a draining
tank (Fig. 1.1.2) is proportional to the square root of the depth y of water in the tank:
dV
D
dt
p
k y;
(4)
where k is a constant. If the tank is a cylinder with vertical sides and cross-sectional area A,
then V D Ay , so d V =dt D A .dy=dt /. In this case Eq. (4) takes the form
dy
D
dt
where h D k=A is a constant.
www.pdfgrip.com
p
h y;
(5)
1.1 Differential Equations and Mathematical Models
Example 5
3
The time rate of change of a population P .t / with constant birth and death rates is, in many
simple cases, proportional to the size of the population. That is,
dP
D kP;
dt
(6)
where k is the constant of proportionality.
Let us discuss Example 5 further. Note first that each function of the form
Volume V
y
P .t / D C e kt
(7)
is a solution of the differential equation
FIGURE 1.1.2. Newton’s law of
cooling, Eq. (3), describes the cooling
of a hot rock in water.
dP
D kP
dt
in (6). We verify this assertion as follows:
Á
P 0 .t / D C ke kt D k C e kt D kP .t /
for all real numbers t . Because substitution of each function of the form given in
(7) into Eq. (6) produces an identity, all such functions are solutions of Eq. (6).
Thus, even if the value of the constant k is known, the differential equation
dP=dt D kP has infinitely many different solutions of the form P .t / D C e kt , one for
each choice of the “arbitrary” constant C . This is typical of differential equations.
It is also fortunate, because it may allow us to use additional information to select
from among all these solutions a particular one that fits the situation under study.
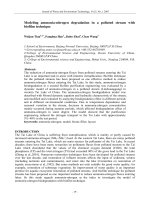
Example 6
Suppose that P .t / D C e kt is the population of a colony of bacteria at time t , that the population at time t D 0 (hours, h) was 1000, and that the population doubled after 1 h. This
additional information about P .t / yields the following equations:
1000 D P .0/ D C e 0 D C;
2000 D P .1/ D C e k :
It follows that C D 1000 and that e k D 2, so k D ln 2
differential equation in (6) is
dP
D .ln 2/P
dt
0:693147. With this value of k the
.0:693147/P:
Substitution of k D ln 2 and C D 1000 in Eq. (7) yields the particular solution
8
P .t / D 1000e .ln 2/t D 1000.e ln 2 /t D 1000 2t
C = 12 C = 6 C = 3
C=1
6
that satisfies the given conditions. We can use this particular solution to predict future populations of the bacteria colony. For instance, the predicted number of bacteria in the population
after one and a half hours (when t D 1:5) is
4
P
2
C=
0
1
2
P .1:5/ D 1000 23=2
C = – 12
–2
–4
C = –1
–6
–8
0
–2
–1
C = –6
C = –12
t
1
2
C = –3
FIGURE 1.1.3. Graphs of
P .t / D C e kt with k D ln 2.
(because e ln 2 D 2)
3
2828:
The condition P .0/ D 1000 in Example 6 is called an initial condition because
we frequently write differential equations for which t D 0 is the “starting time.”
Figure 1.1.3 shows several different graphs of the form P .t / D C e kt with k D ln 2.
The graphs of all the infinitely many solutions of dP=dt D kP in fact fill the entire
two-dimensional plane, and no two intersect. Moreover, the selection of any one
point P0 on the P -axis amounts to a determination of P .0/. Because exactly one
solution passes through each such point, we see in this case that an initial condition
P .0/ D P0 determines a unique solution agreeing with the given data.
www.pdfgrip.com
4
Chapter 1 First-Order Differential Equations
Mathematical Models
Our brief discussion of population growth in Examples 5 and 6 illustrates the crucial
process of mathematical modeling (Fig. 1.1.4), which involves the following:
1. The formulation of a real-world problem in mathematical terms; that is, the
construction of a mathematical model.
2. The analysis or solution of the resulting mathematical problem.
3. The interpretation of the mathematical results in the context of the original
real-world situation—for example, answering the question originally posed.
Real-world
situation
Formulation
Mathematical
model
Interpretation
Mathematical
analysis
Mathematical
results
FIGURE 1.1.4. The process of mathematical modeling.
In the population example, the real-world problem is that of determining the
population at some future time. A mathematical model consists of a list of variables (P and t ) that describe the given situation, together with one or more equations
relating these variables (dP=dt D kP , P .0/ D P0 ) that are known or are assumed to
hold. The mathematical analysis consists of solving these equations (here, for P as
a function of t ). Finally, we apply these mathematical results to attempt to answer
the original real-world question.
As an example of this process, think of first formulating the mathematical
model consisting of the equations dP=dt D kP , P .0/ D 1000, describing the bacteria population of Example 6. Then our mathematical analysis there consisted of
solving for the solution function P .t / D 1000e .ln 2/t D 1000 2t as our mathematical result. For an interpretation in terms of our real-world situation—the actual
bacteria population—we substituted t D 1:5 to obtain the predicted population of
P .1:5/
2828 bacteria after 1.5 hours. If, for instance, the bacteria population is
growing under ideal conditions of unlimited space and food supply, our prediction
may be quite accurate, in which case we conclude that the mathematical model is
adequate for studying this particular population.
On the other hand, it may turn out that no solution of the selected differential
equation accurately fits the actual population we’re studying. For instance, for no
choice of the constants C and k does the solution P .t / D C e kt in Eq. (7) accurately
describe the actual growth of the human population of the world over the past few
centuries. We must conclude that the differential equation dP=dt D kP is inadequate
for modeling the world population—which in recent decades has “leveled off” as
compared with the steeply climbing graphs in the upper half (P > 0) of Fig. 1.1.3.
With sufficient insight, we might formulate a new mathematical model including
a perhaps more complicated differential equation, one that takes into account such
factors as a limited food supply and the effect of increased population on birth and
death rates. With the formulation of this new mathematical model, we may attempt
to traverse once again the diagram of Fig. 1.1.4 in a counterclockwise manner. If
we can solve the new differential equation, we get new solution functions to comwww.pdfgrip.com
1.1 Differential Equations and Mathematical Models
5
pare with the real-world population. Indeed, a successful population analysis may
require refining the mathematical model still further as it is repeatedly measured
against real-world experience.
But in Example 6 we simply ignored any complicating factors that might affect our bacteria population. This made the mathematical analysis quite simple,
perhaps unrealistically so. A satisfactory mathematical model is subject to two contradictory requirements: It must be sufficiently detailed to represent the real-world
situation with relative accuracy, yet it must be sufficiently simple to make the mathematical analysis practical. If the model is so detailed that it fully represents the
physical situation, then the mathematical analysis may be too difficult to carry out.
If the model is too simple, the results may be so inaccurate as to be useless. Thus
there is an inevitable tradeoff between what is physically realistic and what is mathematically possible. The construction of a model that adequately bridges this gap
between realism and feasibility is therefore the most crucial and delicate step in
the process. Ways must be found to simplify the model mathematically without
sacrificing essential features of the real-world situation.
Mathematical models are discussed throughout this book. The remainder of
this introductory section is devoted to simple examples and to standard terminology
used in discussing differential equations and their solutions.
Examples and Terminology
Example 7
If C is a constant and y.x/ D 1=.C
x/, then
dy
1
D y2
D
dx
.C x/2
if x 6D C . Thus
y.x/ D
1
C
(8)
x
defines a solution of the differential equation
dy
D y2
dx
(9)
on any interval of real numbers not containing the point x D C . Actually, Eq. (8) defines a
one-parameter family of solutions of dy=dx D y 2 , one for each value of the arbitrary constant
or “parameter” C . With C D 1 we get the particular solution
y.x/ D
1
1
x
that satisfies the initial condition y.0/ D 1. As indicated in Fig. 1.1.5, this solution is continuous on the interval . 1; 1/ but has a vertical asymptote at x D 1.
Example 8
Verify that the function y.x/ D 2x 1=2
x 1=2 ln x satisfies the differential equation
4x 2 y 00 C y D 0
Solution
(10)
for all x > 0.
First we compute the derivatives
y 0 .x/ D
1=2
1
ln x
2x
and
y 00 .x/ D
3=2
1
ln x
4x
3=2
1
:
2x
Then substitution into Eq. (10) yields
4x 2 y 00 C y D 4x 2
3=2
1
ln x
4x
3=2
1
2x
Á
C 2x 1=2
if x is positive, so the differential equation is satisfied for all x > 0.
www.pdfgrip.com
x 1=2 ln x D 0
6
Chapter 1 First-Order Differential Equations
The fact that we can write a differential equation is not enough to guarantee
that it has a solution. For example, it is clear that the differential equation
.y 0 /2 C y 2 D
(11)
1
has no (real-valued) solution, because the sum of nonnegative numbers cannot be
negative. For a variation on this theme, note that the equation
.y 0 /2 C y 2 D 0
(12)
obviously has only the (real-valued) solution y.x/ Á 0. In our previous examples
any differential equation having at least one solution indeed had infinitely many.
The order of a differential equation is the order of the highest derivative that
appears in it. The differential equation of Example 8 is of second order, those in
Examples 2 through 7 are first-order equations, and
y .4/ C x 2 y .3/ C x 5 y D sin x
is a fourth-order equation. The most general form of an nth-order differential
equation with independent variable x and unknown function or dependent variable
y D y.x/ is
Á
F x; y; y 0 ; y 00 ; : : : ; y .n/ D 0;
(13)
5
y = 1/(1 – x)
y
(0, 1)
where F is a specific real-valued function of n C 2 variables.
Our use of the word solution has been until now somewhat informal. To be
precise, we say that the continuous function u D u.x/ is a solution of the differential
equation in (13) on the interval I provided that the derivatives u0 , u00 , : : : , u.n/ exist
on I and
Á
F x; u; u0 ; u00 ; : : : ; u.n/ D 0
x=1
0
–5
–5
0
x
FIGURE 1.1.5. The solution of
y 0 D y 2 defined by y.x/ D 1=.1
5
for all x in I . For the sake of brevity, we may say that u D u.x/ satisfies the
differential equation in (13) on I .
x/.
Remark Recall from elementary calculus that a differentiable function on an open interval
is necessarily continuous there. This is why only a continuous function can qualify as a
(differentiable) solution of a differential equation on an interval.
Example 7
Continued
Example 9
Figure 1.1.5 shows the two “connected” branches of the graph y D 1=.1 x/. The left-hand
branch is the graph of a (continuous) solution of the differential equation y 0 D y 2 that is
defined on the interval . 1; 1/. The right-hand branch is the graph of a different solution of
the differential equation that is defined (and continuous) on the different interval .1; 1/. So
the single formula y.x/ D 1=.1 x/ actually defines two different solutions (with different
domains of definition) of the same differential equation y 0 D y 2 .
If A and B are constants and
y.x/ D A cos 3x C B sin 3x;
(14)
then two successive differentiations yield
y 0 .x/ D
y 00 .x/ D
3A sin 3x C 3B cos 3x;
9A cos 3x
9B sin 3x D
9y.x/
for all x . Consequently, Eq. (14) defines what it is natural to call a two-parameter family of
solutions of the second-order differential equation
y 00 C 9y D 0
on the whole real number line. Figure 1.1.6 shows the graphs of several such solutions.
www.pdfgrip.com
(15)
1.1 Differential Equations and Mathematical Models
Although the differential equations in (11) and (12) are exceptions to the general rule, we will see that an nth-order differential equation ordinarily has an nparameter family of solutions—one involving n different arbitrary constants or parameters.
In both Eqs. (11) and (12), the appearance of y 0 as an implicitly defined function causes complications. For this reason, we will ordinarily assume that any differential equation under study can be solved explicitly for the highest derivative that
appears; that is, that the equation can be written in the so-called normal form
5
y3
y1
y
y2
0
y .n/ D G x; y; y 0 ; y 00 ; : : : ; y .n
–5
–3
0
x
7
3
FIGURE 1.1.6. The three solutions
y1 .x/ D 3 cos 3x , y2 .x/ D 2 sin 3x ,
and y3 .x/ D 3 cos 3x C 2 sin 3x of
the differential equation y 00 C 9y D 0.
1/
Á
;
(16)
where G is a real-valued function of n C 1 variables. In addition, we will always
seek only real-valued solutions unless we warn the reader otherwise.
All the differential equations we have mentioned so far are ordinary differential equations, meaning that the unknown function (dependent variable) depends
on only a single independent variable. If the dependent variable is a function of
two or more independent variables, then partial derivatives are likely to be involved;
if they are, the equation is called a partial differential equation. For example, the
temperature u D u.x; t / of a long thin uniform rod at the point x at time t satisfies
(under appropriate simple conditions) the partial differential equation
@u
@2 u
D k 2;
@t
@x
where k is a constant (called the thermal diffusivity of the rod). In Chapters 1
through 8 we will be concerned only with ordinary differential equations and will
refer to them simply as differential equations.
In this chapter we concentrate on first-order differential equations of the form
dy
D f .x; y/:
dx
(17)
We also will sample the wide range of applications of such equations. A typical
mathematical model of an applied situation will be an initial value problem, consisting of a differential equation of the form in (17) together with an initial condition y.x0 / D y0 . Note that we call y.x0 / D y0 an initial condition whether or not
x0 D 0. To solve the initial value problem
dy
D f .x; y/;
dx
y.x0 / D y0
(18)
means to find a differentiable function y D y.x/ that satisfies both conditions in
Eq. (18) on some interval containing x0 .
Example 10
Given the solution y.x/ D 1=.C x/ of the differential equation dy=dx D y 2 discussed in
Example 7, solve the initial value problem
dy
D y2;
dx
Solution
y.1/ D 2:
We need only find a value of C so that the solution y.x/ D 1=.C x/ satisfies the initial
condition y.1/ D 2. Substitution of the values x D 1 and y D 2 in the given solution yields
2 D y.1/ D
www.pdfgrip.com
1
C
1
;
8
Chapter 1 First-Order Differential Equations
so 2C
5
2 D 1, and hence C D
y = 2/(3 – 2x)
x = 3/2
y
With this value of C we obtain the desired solution
y.x/ D
(1, 2)
(2, –2)
0
x
FIGURE 1.1.7. The solutions of
y 0 D y 2 defined by
y.x/ D 2=.3 2x/.
1
3
2
x
D
2
3
2x
:
Figure 1.1.7 shows the two branches of the graph y D 2=.3 2x/. The left-hand branch is
the graph on . 1; 23 / of the solution of the given initial value problem y 0 D y 2 , y.1/ D 2.
The right-hand branch passes through the point .2; 2/ and is therefore the graph on . 32 ; 1/
of the solution of the different initial value problem y 0 D y 2 , y.2/ D 2.
0
–5
–5
3
2.
5
The central question of greatest immediate interest to us is this: If we are given
a differential equation known to have a solution satisfying a given initial condition,
how do we actually find or compute that solution? And, once found, what can we do
with it? We will see that a relatively few simple techniques—separation of variables
(Section 1.4), solution of linear equations (Section 1.5), elementary substitution
methods (Section 1.6)—are enough to enable us to solve a variety of first-order
equations having impressive applications.
1.1 Problems
In Problems 1 through 12, verify by substitution that each
given function is a solution of the given differential equation.
Throughout these problems, primes denote derivatives with respect to x .
1.
2.
3.
4.
5.
6.
7.
8.
9.
10.
11.
12.
y 0 D 3x 2 ; y D x 3 C 7
y 0 C 2y D 0; y D 3e 2x
y 00 C 4y D 0; y1 D cos 2x , y2 D sin 2x
y 00 D 9y ; y1 D e 3x , y2 D e 3x
y 0 D y C 2e x ; y D e x e x
y 00 C 4y 0 C 4y D 0; y1 D e 2x , y2 D xe 2x
y 00 2y 0 C 2y D 0; y1 D e x cos x , y2 D e x sin x
y 00 C y D 3 cos 2x , y1 D cos x cos 2x , y2 D sin x cos 2x
1
y 0 C 2xy 2 D 0; y D
1 C x2
1
x 2 y 00 C xy 0 y D ln x ; y1 D x ln x , y2 D
ln x
x
1
ln x
x 2 y 00 C 5xy 0 C 4y D 0; y1 D 2 , y2 D 2
x
x
x 2 y 00 xy 0 C 2y D 0; y1 D x cos.ln x/, y2 D x sin.ln x/
In Problems 13 through 16, substitute y D e rx into the given
differential equation to determine all values of the constant r
for which y D e rx is a solution of the equation.
13. 3y 0 D 2y
15. y 00 C y 0 2y D 0
14. 4y 00 D y
16. 3y 00 C 3y 0
4y D 0
In Problems 17 through 26, first verify that y.x/ satisfies the
given differential equation. Then determine a value of the constant C so that y.x/ satisfies the given initial condition. Use a
computer or graphing calculator (if desired) to sketch several
typical solutions of the given differential equation, and highlight the one that satisfies the given initial condition.
17. y 0 C y D 0; y.x/ D C e x , y.0/ D 2
18. y 0 D 2y ; y.x/ D C e 2x , y.0/ D 3
19. y 0 D y C 1; y.x/ D C e x 1, y.0/ D 5
20. y 0 D x y ; y.x/ D C e x C x 1, y.0/ D 10
3
21. y 0 C 3x 2 y D 0; y.x/ D C e x , y.0/ D 7
y
0
22. e y D 1; y.x/ D ln.x C C /, y.0/ D 0
dy
23. x
C 3y D 2x 5 ; y.x/ D 14 x 5 C C x 3 , y.2/ D 1
dx
24. xy 0 3y D x 3 ; y.x/ D x 3 .C C ln x/, y.1/ D 17
25. y 0 D 3x 2 .y 2 C 1/; y.x/ D tan.x 3 C C /, y.0/ D 1
26. y 0 C y tan x D cos x ; y.x/ D .x C C / cos x , y. / D 0
In Problems 27 through 31, a function y D g.x/ is described
by some geometric property of its graph. Write a differential
equation of the form dy=dx D f .x; y/ having the function g as
its solution (or as one of its solutions).
27. The slope of the graph of g at the point .x; y/ is the sum
of x and y .
28. The line tangent to the graph of g at the point .x; y/ intersects the x -axis at the point .x=2; 0/.
29. Every straight line normal to the graph of g passes through
the point .0; 1/. Can you guess what the graph of such a
function g might look like?
30. The graph of g is normal to every curve of the form
y D x 2 C k (k is a constant) where they meet.
31. The line tangent to the graph of g at .x; y/ passes through
the point . y; x/.
In Problems 32 through 36, write—in the manner of Eqs. (3)
through (6) of this section—a differential equation that is a
mathematical model of the situation described.
32. The time rate of change of a population P is proportional
to the square root of P .
33. The time rate of change of the velocity v of a coasting
motorboat is proportional to the square of v .
34. The acceleration dv=dt of a Lamborghini is proportional
to the difference between 250 km/h and the velocity of the
car.
www.pdfgrip.com
1.1 Differential Equations and Mathematical Models
35. In a city having a fixed population of P persons, the time
rate of change of the number N of those persons who have
heard a certain rumor is proportional to the number of
those who have not yet heard the rumor.
36. In a city with a fixed population of P persons, the time rate
of change of the number N of those persons infected with
a certain contagious disease is proportional to the product
of the number who have the disease and the number who
do not.
In Problems 37 through 42, determine by inspection at least
one solution of the given differential equation. That is, use
your knowledge of derivatives to make an intelligent guess.
Then test your hypothesis.
37. y 00 D 0
39. xy 0 C y D 3x 2
41. y 0 C y D e x
38. y 0 D y
40. .y 0 /2 C y 2 D 1
42. y 00 C y D 0
Problems 43 through 46 concern the differential equation
dx
D kx 2 ;
dt
where k is a constant.
43. (a) If k is a constant, show that a general (one-parameter)
solution of the differential equation is given by x.t / D
1=.C k t /, where C is an arbitrary constant.
(b) Determine by inspection a solution of the initial value
problem x 0 D kx 2 , x.0/ D 0.
44. (a) Assume that k is positive, and then sketch graphs of
solutions of x 0 D kx 2 with several typical positive
values of x.0/.
(b) How would these solutions differ if the constant k
were negative?
45. Suppose a population P of rodents satisfies the differential equation dP=dt D kP 2 . Initially, there are P .0/ D 2
rodents, and their number is increasing at the rate of
dP=dt D 1 rodent per month when there are P D 10 rodents. Based on the result of Problem 43, how long will it
take for this population to grow to a hundred rodents? To
a thousand? What’s happening here?
46. Suppose the velocity v of a motorboat coasting in water
satisfies the differential equation dv=dt D kv 2 . The initial speed of the motorboat is v.0/ D 10 meters per second (m/s), and v is decreasing at the rate of 1 m/s2 when
v D 5 m/s. Based on the result of Problem 43, long does
it take for the velocity of the boat to decrease to 1 m/s? To
1
10 m/s? When does the boat come to a stop?
47. In Example 7 we saw that y.x/ D 1=.C x/ defines a
one-parameter family of solutions of the differential equation dy=dx D y 2 . (a) Determine a value of C so that
y.10/ D 10. (b) Is there a value of C such that y.0/ D 0?
Can you nevertheless find by inspection a solution of
dy=dx D y 2 such that y.0/ D 0? (c) Figure 1.1.8 shows
typical graphs of solutions of the form y.x/ D 1=.C x/.
Does it appear that these solution curves fill the entire xy plane? Can you conclude that, given any point .a; b/ in
the plane, the differential equation dy=dx D y 2 has exactly one solution y.x/ satisfying the condition y.a/ D b ?
48. (a) Show that y.x/ D C x 4 defines a one-parameter family of differentiable solutions of the differential equation
xy 0 D 4y (Fig. 1.1.9). (b) Show that
(
x 4 if x < 0,
y.x/ D
x 4 if x = 0
defines a differentiable solution of xy 0 D 4y for all x , but is
not of the form y.x/ D C x 4 . (c) Given any two real numbers a and b , explain why—in contrast to the situation in
part (c) of Problem 47—there exist infinitely many differentiable solutions of xy 0 D 4y that all satisfy the condition
y.a/ D b .
C = –2 C = –1 C = 0 C = 1 C = 2 C = 3
3
100
80
60
40
20
0
–20
– 40
–60
–80
–100
–5 – 4 –3 –2 –1 0 1 2 3 4 5
x
2
1
9
C=4
y
y
0
C = –4
–1
–2
–3
–3 –2 –1
0
1
2
3
C = –3 C = –2 C = –1 C = 0 C = 1 C = 2
x
FIGURE 1.1.9. The graph y D C x 4 for
various values of C .
FIGURE 1.1.8. Graphs of solutions of the
equation dy=dx D y 2 .
www.pdfgrip.com
10
Chapter 1 First-Order Differential Equations
1.2 Integrals as General and Particular Solutions
The first-order equation dy=dx D f .x; y/ takes an especially simple form if the
right-hand-side function f does not actually involve the dependent variable y , so
4
C =3
3
C =2
2
C =1
1
C =0
dy
D f .x/:
dx
C = –1
C = –2
y
0
–1
–2
–4
– 4 –3 –2 –1
0
x
1
2
3
4
FIGURE 1.2.1. Graphs of
y D 14 x 2 C C for various values of C .
6
C=4
4
y
2
C=2
C=0
y.x/ D G.x/ C C:
dy
D f .x/;
dx
C = –4
–4
(3)
The graphs of any two such solutions y1 .x/ D G.x/ C C1 and y2 .x/ D G.x/ C
C2 on the same interval I are “parallel” in the sense illustrated by Figs. 1.2.1 and
1.2.2. There we see that the constant C is geometrically the vertical distance between the two curves y.x/ D G.x/ and y.x/ D G.x/ C C .
To satisfy an initial condition y.x0 / D y0 , we need only substitute x D x0 and
y D y0 into Eq. (3) to obtain y0 D G.x0 / C C , so that C D y0 G.x0 /. With this
choice of C , we obtain the particular solution of Eq. (1) satisfying the initial value
C = –2
–2
–6
–6
(2)
problem
0
–4
In this special case we need only integrate both sides of Eq. (1) to obtain
Z
y.x/ D f .x/ dx C C:
This is a general solution of Eq. (1), meaning that it involves an arbitrary constant
C , and for every choice of C it is a solution of the differential equation in (1). If
G.x/ is a particular antiderivative of f —that is, if G 0 .x/ Á f .x/—then
C = –3
–3
(1)
–2
0
x
2
4
6
FIGURE 1.2.2. Graphs of
y D sin x C C for various values of C .
Example 1
We will see that this is the typical pattern for solutions of first-order differential
equations. Ordinarily, we will first find a general solution involving an arbitrary
constant C . We can then attempt to obtain, by appropriate choice of C , a particular
solution satisfying a given initial condition y.x0 / D y0 .
Remark As the term is used in the previous paragraph, a general solution of a first-order
differential equation is simply a one-parameter family of solutions. A natural question is
whether a given general solution contains every particular solution of the differential equation. When this is known to be true, we call it the general solution of the differential equation.
For example, because any two antiderivatives of the same function f .x/ can differ only by a
constant, it follows that every solution of Eq. (1) is of the form in (2). Thus Eq. (2) serves to
define the general solution of (1).
Solve the initial value problem
dy
D 2x C 3;
dx
Solution
y.x0 / D y0 :
y.1/ D 2:
Integration of both sides of the differential equation as in Eq. (2) immediately yields the
general solution
Z
y.x/ D .2x C 3/ dx D x 2 C 3x C C:
Figure 1.2.3 shows the graph y D x 2 C 3x C C for various values of C . The particular solution
we seek corresponds to the curve that passes through the point .1; 2/, thereby satisfying the
initial condition
y.1/ D .1/2 C 3 .1/ C C D 2:
It follows that C D 2, so the desired particular solution is
y.x/ D x 2 C 3x
www.pdfgrip.com
2:
1.2 Integrals as General and Particular Solutions
11
4
Second-order equations. The observation that the special first-order equation
2
dy=dx D f .x/ is readily solvable (provided that an antiderivative of f can be found)
extends to second-order differential equations of the special form
0
C=2
–2
y
–4
(4)
C = –2
–6
C = –4
–8
–10
–6
d 2y
D g.x/;
dx 2
C=0
C = –6
–4
–2
0
2
4
x
FIGURE 1.2.3. Solution curves for
the differential equation in Example 1.
in which the function g on the right-hand side involves neither the dependent variable y nor its derivative dy=dx . We simply integrate once to obtain
Z
Z
dy
00
D y .x/ dx D g.x/ dx D G.x/ C C1 ;
dx
where G is an antiderivative of g and C1 is an arbitrary constant. Then another
integration yields
Z
Z
Z
0
y.x/ D y .x/ dx D ŒG.x/ C C1 dx D G.x/ dx C C1 x C C2 ;
where C2 is a second arbitrary constant. In effect, the second-order differential
equation in (4) is one that can be solved by solving successively the first-order
equations
dv
dy
D g.x/ and
D v.x/:
dx
dx
Velocity and Acceleration
Direct integration is sufficient to allow us to solve a number of important problems
concerning the motion of a particle (or mass point) in terms of the forces acting
on it. The motion of a particle along a straight line (the x -axis) is described by its
position function
x D f .t /
(5)
giving its x -coordinate at time t . The velocity of the particle is defined to be
v.t / D f 0 .t /I
that is,
vD
dx
:
dt
(6)
Its acceleration a.t / is a.t / D v 0 .t / D x 00 .t /; in Leibniz notation,
aD
R
d 2x
dv
D
:
dt
dt 2
(7)
Equation (6) is sometimes applied either in the indefinite integral form x.t / D
v.t / dt or in the definite integral form
x.t / D x.t0 / C
Z
t
v.s/ ds;
t0
which you should recognize as a statement of the fundamental theorem of calculus
(precisely because dx=dt D v ).
Newton’s second law of motion says that if a force F .t / acts on the particle
and is directed along its line of motion, then
ma.t / D F .t /I
www.pdfgrip.com
that is, F D ma;
(8)
12
Chapter 1 First-Order Differential Equations
where m is the mass of the particle. If the force F is known, then the equation
x 00 .t / D F .t /=m can be integrated twice to find the position function x.t / in terms
of two constants of integration. These two arbitrary constants are frequently determined by the initial position x0 D x.0/ and the initial velocity v0 D v.0/ of the
particle.
Constant acceleration. For instance, suppose that the force F , and therefore the
acceleration a D F=m, are constant. Then we begin with the equation
dv
Da
dt
(a is a constant)
(9)
and integrate both sides to obtain
v.t / D
Z
a dt D at C C1 :
We know that v D v0 when t D 0, and substitution of this information into the
preceding equation yields the fact that C1 D v0 . So
v.t / D
dx
D at C v0 :
dt
(10)
A second integration gives
Z
Z
x.t / D v.t / dt D .at C v0 / dt D 12 at 2 C v0 t C C2 ;
and the substitution t D 0, x D x0 gives C2 D x0 . Therefore,
x.t / D 21 at 2 C v0 t C x0 :
(11)
Thus, with Eq. (10) we can find the velocity, and with Eq. (11) the position, of
the particle at any time t in terms of its constant acceleration a, its initial velocity
v0 , and its initial position x0 .
Example 2
Solution
a
υ
Lunar surface
FIGURE 1.2.4. The lunar lander of
Example 2.
A lunar lander is falling freely toward the surface of the moon at a speed of 450 meters per
second (m=s). Its retrorockets, when fired, provide a constant deceleration of 2.5 meters per
second per second (m=s2 ) (the gravitational acceleration produced by the moon is assumed
to be included in the given deceleration). At what height above the lunar surface should the
retrorockets be activated to ensure a “soft touchdown” (v D 0 at impact)?
We denote by x.t / the height of the lunar lander above the surface, as indicated in Fig. 1.2.4.
We let t D 0 denote the time at which the retrorockets should be fired. Then v0 D 450
(m=s, negative because the height x.t / is decreasing), and a D C2:5, because an upward
thrust increases the velocity v (although it decreases the speed jvj). Then Eqs. (10) and (11)
become
v.t / D 2:5t 450
(12)
and
x.t / D 1:25t 2 450t C x0 ;
(13)
where x0 is the height of the lander above the lunar surface at the time t D 0 when the
retrorockets should be activated.
From Eq. (12) we see that v D 0 (soft touchdown) occurs when t D 450=2:5 D 180 s
(that is, 3 minutes); then substitution of t D 180, x D 0 into Eq. (13) yields
x0 D 0
.1:25/.180/2 C 450.180/ D 40;500
meters—that is, x0 D 40.5 km 25 16 miles. Thus the retrorockets should be activated when
the lunar lander is 40.5 kilometers above the surface of the moon, and it will touch down
softly on the lunar surface after 3 minutes of decelerating descent.
www.pdfgrip.com