Tài liệu Melbourne Mining Club Ian Smith - Managing Director and CEO pdf
Bạn đang xem bản rút gọn của tài liệu. Xem và tải ngay bản đầy đủ của tài liệu tại đây (1.75 MB, 27 trang )
© Orica Limited Group
Melbourne Mining Club
11
th
April 2013
Ian Smith - Managing Director and CEO
Slide 1
Disclaimer
Forward looking statements
This presentation has been prepared by Orica Limited. The information contained in this presentation is for
informational purposes only. The information contained in this presentation is not investment or financial
product advice and is not intended to be used as the basis for making an investment decision. This
presentation has been prepared without taking into account the investment objectives, financial situation or
particular needs of any particular person.
No representation or warranty, express or implied, is made as to the fairness, accuracy, completeness or
correctness of the information, opinions and conclusions contained in this presentation. To the maximum
extent permitted by law, none of Orica Limited, its directors, employees or agents, nor any other person
accepts any liability, including, without limitation, any liability arising out of fault or negligence, for any loss
arising from the use of the information contained in this presentation. In particular, no representation or
warranty, express or implied, is given as to the accuracy, completeness or correctness, likelihood of
achievement or reasonableness of any forecasts, prospects or returns contained in this presentation. Such
forecasts, prospects or returns are by their nature subject to significant uncertainties and contingencies.
Before making an investment decision, you should consider, with or without the assistance of a financial
adviser, whether an investment is appropriate in light of your particular investment needs, objectives and
financial circumstances. Past performance is no guarantee of future performance.
Non-IFRS information
This presentation makes reference to certain non-IFRS financial information. Management use this
information to measure the operating performance of the business and has been presented as this may be
useful for investors. This information has not been reviewed by the Group’s auditor.
Slide 2
Global Leader in Mining Services
1. World’s largest provider of commercial explosives to mining and
infrastructure markets with 28% global market share
2. Global leader in the provision of ground support in mining and tunneling
3. Leading global supplier of cyanide for use in gold extraction
4. Australia and New Zealand’s largest supplier of chemical products to
mining, water treatment and other industrial markets
5. ASX listed with market capitalization of approximately A$9.6B (ASX Top 30)
Australian Base - Global Footprint
~15,000 Employees
Operations in 50 countries
Customers in over 100 countries
Slide 4
Australian Base - Global Footprint
2012 Mining Services Revenue
• 90% of Group EBIT is generated from
mining related industries including
quarrying and construction
• Broad mining exposure – from coal
and iron ore to base and precious
metals and diamonds
• Wide geographic spread
• Commodity and geographic diversity
reduces earnings volatility
Coal -
Thermal, 30%
Coal -
Coking, 6%
Iron Ore, 5%
Gold, 16%
Other Metals,
27%
Q&C, 16%
Slide 5
Attractive Industry Fundamentals
• Long term growth in commodity
volumes, driven by industrialisation and
urbanisation
• Declining ore grades and increasing
strip ratios and ore-body complexity
• Efficiency and productivity focus drives
demand for game-changing technology,
products and services
Slide 6
Attractive Industry Fundamentals
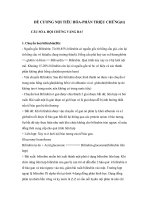
0% 10% 20% 30% 40% 50% 60% 70% 80% 90%
Coal
Iron ore
Lead
Zinc
Aluminium
Copper
Nickel
Change in global demand, 2010 - 2030
Source: ABARES, Deloitte Access Economics – Commissioned by Minerals Council of Australia
Growth in Global Commodity Demand: 2010 - 2030
Slide 7
Attractive Industry Fundamentals
Sources: Orica, ABARES
0
200
400
600
800
1,000
1,200
1,400
1982 1984 1986 1988 1990 1992 1994 1996 1998 2000 2002 2004 2006 2008 2010
Index (1982 = 100)
Growth in Australia (1982 – 2011)
Ammonium Nitrate Demand
CAGR 9.0%
Iron Ore & Minerals Prod.
CAGR 5.8%
Coal Production
CAGR 4.4%
Slide 8
0
20
40
60
80
100
120
140
160
180
2006 2007 2008 2009 2010 2011
Cyanide Demand
1.2
1.3
1.4
1.5
1.6
1.7
1.8
0
20
40
60
80
100
120
2006 2007 2008 2009 2010 2011
Gold Production (Index: 2006=100)
Gold Production and Ore Grades
Global Gold Production Gold Ore Grade (g/t)
Attractive Industry Fundamentals
1. Thomson Reuters GFMS Mine Production Extract Gold Survey – April 2012
Slide 9
Services
Input sourcing
Basic/limited Differentiated
Willing to
source externally
Manufacturing
led model
Differentiated
services led
model
Orica
Competitor
Competitor
Competitor
Competitor
Competitor
Competitor
Competitor
Competitor
Drive to
make internally
Strategic Imperatives
Refine the customer value proposition
Develop people capability & competence
Stabilise the capital spending program
Drive common systems and processes
Focus on performance metrics & targets
Renew manufacturing reliability & integrity
Integrate Minova into Mining Services
Secure low cost & capital efficient supply
Build multiple reliable customer supply
Strategy
Slide 10
Initiatives Supporting Strategy
Slide 11
1. Structure
The new structure; with centralised functional support/services that assist the value
chain steps of Research and Development, Manufacturing and Mining Services and
Chemicals; will enable Orica to grow without the need to duplicate and replicate
functional groups for each individual component of the organisation.
2. Sourcing and Logistics
Through our international network we identify the best and most efficient means by
which we not only acquire, produce and develop our products and techniques, but
provide cost effective multiple channels
of supply to ourselves and our customers.
3. Manufacturing Excellence
Concentration on consistency and constancy of production through the shared
application of maintenance, process control and meeting market demand through
integrated planning and demand profiling.
4. Value in Use
By applying products and techniques in unique and tailored platforms we can share in
the upside of our customers being better able to utilise their capital and resources.
Complete
Started
Started
Started
Orica’s Ability to Build Margin
Slide 12
1. & 2. Structure and Sourcing
Ian Smith
Chief Executive Officer
Andrew Larke
Global Head Strategy & Planning
Noel Meehan
Chief Financial Officer
Eileen Burnett-Kant
Global Head Human Resources
Gavin Jackman
Global Head Corporate Affairs
& Social Responsibility
Alison Andrew
Global Head Chemicals
Craig Elkington
Global Head Mining Services
Tony Edmondstone
Global Head Supply
Sean Winstone
Manufacturing Executive
Molly Zhang
Manufacturing Executive
Ron Douglas
Global Head Projects and Technology
Richard Hoggard
Global Head Manufacturing
Slide 13
Over 50% of our mining related EBIT is
generated within the area shown in the
adjacent map.
Security and flexibility of supply is
supported by:
1. Four large AN prill plants (post
Burrup)
2. Numerous emulsion plants
3. Extensive storage capacity &
locations
These supply points also provide
options for supporting Africa and South
America.
2. Sourcing and Logistics
Slide 14
A deep dive has been performed into Kooragang Island operations
The same process will be progressively applied to all AN and IS manufacturing sites
• Operational and process improvements identified for the next 12
months
• Plant improvements implemented to reduce the risk of major incidents
Results already achieved include:
• All maintenance measures improving month by month
• Enhanced safety and environmental performance
• Plant production more stable
3. Manufacturing Excellence
Slide 15
Accounts Won and Lost at Tender
82%
57%
56%
18%
43%
44%
Existing customer
account
Competitor-held
account
Green-field account
October 2011 to September 2012
Lost
Won
99%
58%
74%
1%
42%
26%
Existing customer
account
Competitor-held
account
Green-field
account
October 2012 to February 2013
4. Value in Use
Slide 16
4. Value in Use
Customer Service /
Supply
59%
Price / Cost
17%
Product
Differentiation
24%
Customer Feedback for Going with Orica
October 2012 - January 2013
Service, supply chain and product differentiation are the most important factors to our customers.
Slide 17
4. Value in Use
Moving Towards Service Orientated Product Offering
YTD 2013 versus Q4 FY 2012
-28%
22%
6%
-40%
-30%
-20%
-10%
0%
10%
20%
30%
Product
On-site service
Advanced blasting
service
Slide 18
Mine Site Conditions for Ongoing Growth in Demand for Explosives
The energy used (% of total site consumption) in completing the following functions on a typical mine
drilling / blasting ~ 2 %
excavation / hauling
~ 10 %
grinding / crushing
~ 53 %
Optimising the use of explosives not only saves total energy consumed on a mine site but improves
dig rates leading to decreased excavation times while increasing the throughput of the grinding and
crushing equipment; this all leads to
GREATER PRODUCTIVITY
(the following tested examples of value in use reinforce the point)
4. Value in Use
Slide 19
4. Value in Use
Soft Ore Bond Work Index (BWI) = 15
Hard Ore Bond Work Index (BWI) = 25
4x increase in powder factor results in
• 40% increase in mill throughput
• 33% reduction in mill energy
4x increase in powder factor results in
• 28% increase in mill throughput
• 23% reduction in mill energy
Slide 20
4. Value in Use
Mines are facing increasingly frequent challenging geological formations
“Through Seam Blasting” provides a solution to these by:
• Increasing the percentage of resource recovered
• Reducing strip ratio
• Providing the ability to selectively mine multiple seams
• Reducing total mining costs per tonne
• Turning previously non-economic resources into economically feasible prospects
Thin & Intermittent Splitting Faulted Dipping
Slide 21
Projects
Slide 22
Proven ability to manufacture to nameplate capacity
• Indonesian plant commissioned with capacity of
300 - 330ktpa
• Proven ability to manufacture to nameplate
capacity and product quality within specification
• Export licence received which will enable
flexibility in the supply chain
Bontang Ammonium Nitrate Plant
Slide 23
Initial production scheduled for 2013
• Construction is substantially complete with
commissioning underway
• Commissioning will occur progressively over
the next 12 – 18 months
• Total project cost expected to be within initial
AUD estimates
HONCE Initiating Systems
Slide 24
Miners have reaffirmed iron ore projects which will deliver > 800mtpa by end of 2015
Burrup JV
• NW Iron Ore = geographic &
commodity diversification
• Site earthworks and civils underway
with late 2015 commissioning
• Unique project & capital structure that
reduces capital risk:-
• $110M entry fee
• 45% of project capital
• 100% marketing rights to all AN
• 94% of revenue from sales of AN
associated initiating systems and
services to Pilbara customers
• 45% of profit from AN sales (inclusive
of the 6% revenue contribution from
sales of AN associated initiating
systems and services)
0
100
200
300
400
500
600
700
800
900
2010 2015
15% CAGR
Announced Iron Ore Production
Increases
North West Regions (mtpa)