Tài liệu Báo cáo khoa học: "Summarizing Neonatal Time Series Data" doc
Bạn đang xem bản rút gọn của tài liệu. Xem và tải ngay bản đầy đủ của tài liệu tại đây (325.02 KB, 4 trang )
Summarizing Neonatal Time Series Data
Somayajulu G. Sripada, Ehud Reiter, Jim Hunter and Jin Yu
Department of Computing Science
University of Aberdeen, Aberdeen, U.K.
fssripada,ereiter,jhunter,
Abstract
We describe our investigations in gener-
ating textual summaries of physiological
time series data to aid medical personnel
in monitoring babies in neonatal intensive
care units. Our studies suggest that sum-
marization is a communicative task that
requires data analysis techniques for de-
termining the content of the summary.
We describe a prototype system that
summarizes physiological time series.
1 Introduction
Time series data is ubiquitous — any measure-
ment humans make over a period of time pro-
duces a time series. We are building a system to
summarize physiological times series data such
as heart rate, and blood pressure measured in
neonatal intensive care units.
2 Background
The SumTimE project aims to develop generic
techniques to produce textual summaries of time
series data (Sripada et al, 2001). We initially
worked in two domains, meteorology and gas
turbines. In meteorology we generate textual
weather forecasts from weather data such as wind
speed, wind direction, and wave heights. In gas
turbines we generate textual summaries of unex-
pected patterns in sensor data such as exhaust
temperature, liquid fuel flow, and turbine speed.
In each of these domains we are working with
industrial collaborators and have built prototype
systems.
Using the experience from both these domains
we have now started working on physiological
time series data in collaboration with
NEONATE
(Ewing et al, 2002) project. The main objective
of
NEONATE has been to produce a decision sup-
port system for the medical personnel working in
the neonatal intensive care unit (NICU).
In the
NEONATE
project, a research nurse has
been employed to collect data from the neonatal
intensive care unit at Simpson Maternity Hospi-
tal, Edinburgh using a software tool, BabyWatch
(Ewing et al, 2002). Physiological parameters
such as heart rate, mean blood pressure and tem-
perature are recorded at one-second frequency
using various probes attached to the baby.
In order to monitor the health of babies, medi-
cal personnel (doctors and nurses) working in the
neonatal unit are required to inspect such data
continually. Currently they use visual displays of
the data. Our system
will
generate textual sum-
maries of these data as an aid to the medical per-
sonnel. We believe that interpreting textual
summaries is lot quicker and does not require
much mathematical (statistical) knowledge when
compared to interpreting graphical displays.
3 Knowledge Acquisition
We have carried out a variety of knowledge ac-
quisition (KA) activities using multiple tech-
niques developed in the expert system
community (Scott, Clayton, and Gibson, 1991) to
understand how humans perform data summari-
zation.
167
20.0
60.0
BM(RD)
27 Feb 96
03:00
03 10
03 20
0333
3343
03:50
04:00
04:10
04:20
04:30
04:40
04:50
05 00
0510
3520
3530
05:40
05:50
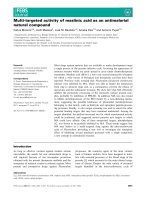
Figure 1. Plot of mean blood pressure
Figure 1 shows a time series plot of mean
blood pressure sampled every second for three
hours. Figure 2 shows its summary extracted
from a small corpus of human written summaries
we analyzed. The summary text in Figure 2 has
the doctor's interpretation of the data (for in-
stance, this is an inadequate blood pressure
' and ` and I suspect that dopamine has been
started ') interwoven with pure data descrip-
tion (for instance,
' BP
is fairly stable at round
about 30kpa ').
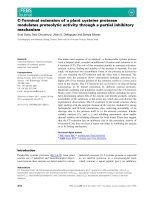
On the BP trace the BP is fairly stable at round
about 30kpa until 04:20 with the exception of
the blood sampling artifact at just about 04:08.
This is an inadequate blood pressure and has
fallen further at 04:20 and
I
suspect that dopa-
mine has been started at this point because from
about 04:23 there is a steady increase in the BP
until 04:50 when the BP is now 40. This is
much more adequate. There are in some oscil-
lations presumably as the infusion rate of do-
pamine has been turned down until the BP
settles down to round about 34.
Figure 2. Human written summary for the data shown
in Figure
1.
Based on our KA studies we have made a
number of observations about neonatal data
summarization. A few of them are:
•
Raw data contains a number of artifacts
due to external events such as baby han-
dling and blood sampling. These artifacts
need to be separated from the input data
before summarizing. The example data
shown in Figure
1,
contains one blood
sampling artifact at 4:08.
•
Summaries should report rises and falls in
the data.
•
Summaries should report actual numerical
values of the parameter being summarized.
Artifact separation was not required in the
other two domains; it was unique to neonatal
data. One of the experts, with whom we did KA
explained that physiological data without arti-
facts reflect the true physiology of the underlying
baby. He explained further that artifact data could
be interesting in its own right if summarized
separately because such summaries show how the
underlying baby is reacting to the external ac-
tions.
Interestingly, we have made some general ob-
servations about data summarization across all
the three domains.
•
Summarization needs some domain
knowledge reflecting how data will be
used. In the domain of neonatal care it is in
the form of knowledge about artifacts. In
the domain of meteorology it is in the form
of knowledge of what is important. For ex-
ample, changes in wind speeds and direc-
tions are important in marine forecasts but
not in public forecasts unless gales are
predicted. Finally in the domain of gas tur-
bine it is in the form of important patterns.
For instance, damped oscillations and steps
are significant for monitoring turbines.
•
This knowledge, however, can be inte-
grated into standard data analysis algo-
168
Artefact
Separation
Doe
planning
Micro-
planning
Inp
Data
rithms. In the domain of meteorology user
thresholds have been used for determining
stopping criterion for segmentation. In the
domain of gas turbines domain knowledge
has been used for classifying patterns.
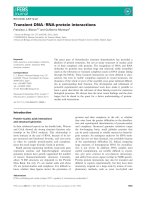
4 System Architecture
Our system follows the pipeline architecture for
text generation (Reiter and Dale, 2000) as shown
in Figure 3.
Figure 3. Architecture of our summarization system
The first module, artifact separation is respon-
sible for detecting and removing artifacts due to
external activities such as blood sampling and
baby handling. Artifact detection in a signal de-
serves a separate study in its own right. However,
in SumTimE we are initially using a median filter
and an impossible value filter developed in our
collaborator project
NEONATE.
Document planning is responsible for selecting
the 'important' data points from the input data
and to organize them into a paragraph. We de-
scribe this module in greater detail in 4.1. The
third module, micro planning is responsible for
lexical selection and aggregation. Finally the
fourth module, realization is responsible for gen-
erating the grammatical output. We have used the
small corpus we collected from
NEONATE,
to
build the micro planner and realizer.
4.1 Content Selection and Segmentation
The most important question in summarization is
'what data points from the input should be in-
cluded in the summary
9
' Any model of summari-
zation needs to find ways to reduce the size of the
input data set (or improve its accessibility) with-
out significantly altering its content (or informa-
tiveness). This process is sensitive to the domain
constraints such as limits on parameter values. It
is clear from our own studies on data summari-
zation and also from the earlier studies by others
(Shahar, 1997; Boyd, 1998; Kulkich, 1983) that
data summarization needs data analysis to deter-
mine the trends and patterns present in the data
set. RESUME (Shahar, 1997) uses knowledge
based temporal abstraction for producing ab-
stractions of clinical data. TREND (Boyd, 1998)
uses wavelets to analyze archives of weather data
to produce weather summaries. ANA (Kulkich,
1983) uses a combination of arithmetic computa-
tions and pattern matching techniques to analyse
raw data from the Dow Jones News service data-
base. SUMTIME-MOUSAM (Sripada et al, 2002)
used segmentation of input weather data to de-
termine intervals with similar trends.
Upon manual inspection of corpus texts we felt
that segmentation should work with neonatal
data. Segmentation is the process of fitting linear
segments to an input data series keeping the
maximum error introduced in segments to be
lower than the user defined value. There are
many algorithms for segmentation developed in
the KDD community. These algorithms differ
from each other in the control information they
use and the way they process data (such as top-
down and bottom-up).
We have selected one of them known as the
bottom-up algorithm. This algorithm has been
explained in great detail in (Keogh et al, 2001)
and will not be described here. According to Ke-
ogh's description, the number of segments pro-
duced (which determines the detail to which the
data is summarized) depends upon a user-
specified limit. In our case, this limit cannot be
the same for all segments. Segments joining
smaller values might have different error limit
compared to those that join larger values. These
user-defined limits (thresholds) control the seg-
mentation process in a way suited for summari-
zation. In general, data analysis algorithms such
as segmentation need to be adapted to suit the
summarization requirements (Sripada et al,
2002). For the initial prototype we have assumed
a variety of control values and produced output
summaries for each. We intend to obtain feed-
back on this from the doctors.
Given an input time series, data analysis such
as segmentation produces what we call a 'sum-
mary series'. In our case, summary series con-
tains intervals with similar trend. In some cases,
content for the summary could be derived from
all the intervals in the summary series. However,
Realization
-4)
utput
Text
169
as we have observed in the domain of meteorol-
ogy, we have to include information related to
only 'significant' intervals in the summary. In the
neonatal domain we need to obtain domain spe-
cific knowledge for identifying significant seg-
ments (intervals).
Initially BP is stable around 30 kpa until
4:23:14. In the next 28 minutes it gradually
rises to 41 kpa. It gradually falls to 34 kpa by
5:59:59.
Figure 4. Output of our system with limit = 10
BP is stable around 30 kpa until 5:59:59.
Figure 5. Output of our system with limit = 30
Figures 4 and 5 show example output of our
system running with different limit values. In this
paper we are interested in producing purely de-
scriptive textual summaries of neonatal data.
Human written summary shown in Figure 2 in-
cludes interpretative parts interwoven with the
descriptive parts. Producing interpretative sum-
maries of data requires lot of expert domain
knowledge. In the current work we do not want
to get into building specialist domain knowledge.
5 Planned Experiments
We plan to conduct small pilot tests with our
software, to get general feedback on how useful
the summaries are. These would be performed
off-ward, and would involve a small number of
doctors looking at generated summaries and sug-
gesting improvements (revisions), and perhaps
making general comments as well.
5.1 Experimental Evaluation
When our system is fully developed, we would
like to do a proper experimental evaluation. For
example, we could set up some kind of diagnosis
task, where doctors examine data from a particu-
lar baby and diagnose what is wrong with the
baby (or say whether the baby has or does not
have a particular problem?). Then we could ask a
group of doctors to do this task with (a) just
graphic visualizations and (b) graphic visualiza-
tions and text summaries, and see if there was
any significant difference in accuracy, time to
make diagnosis, or confidence in decision.
6 Conclusion
We have described our work on summarizing
physiological data from a neonatal intensive care.
Content selection used segmentation (an existing
data analysis technique) controlled by domain
knowledge in a similar way to other prototypes.
This suggests that perhaps this is a generic ap-
proach that could be applied to summarizing
many types of time series data.
References
Sarah Boyd. 1998. TREND: a system for generating intelli-
gent descriptions of time series data. In Proceedings of
the IEEE International Conference on Intelligent Proc-
essing Systems (ICIPS-1998).
Ewing Gary, Ferguson Lindsey, Freer Yvonne, Hunter Jim
and McIntosh Neil 2002. Observational Data Acquired
on a Neonatal Intensive Care Unit, Technical Report
AUCS/TR0205, Dept. of Comp. Science, Univ. of Aber-
deen.
Eamonn Keogh, Selina Chu, David Hart and Michael Paz-
zani. 2001. An Online Algorithm for Segmenting Time
Series.
In: Proceedings of IEEE International Confer-
ence on Data Mining„
pp 289-296.
Karen Kukich. 1983. Design and implementation of a
knowledge-based report generator. In:
Proceedings of the
21st Annual Meeting of the Association for Computa-
tional Linguistics (ACL-1983),
pp 145-150.
Ehud Reiter and Robert Dale. 2000. Building Natural Lan-
guage Generation Systems.
Cambridge
University
Press.
A. Carlisle Scott, Jan E. Clayton, and Elizabeth L.
Gibson. 1991. Practical Guide to Knowledge Ac-
quisition.
Addison-Wesley.
Yuval Shahar. 1997. Framework for knowledge based
temporal abstraction.
Artificial Intelligence,
90:79-
133.
Somayajulu, G. Sripada, Ehud Reiter, Jim Hunter and Jin
Yu. 2001 Modelling the task of Summarising Time Se-
ries Data using KA Techniques. In: Macintosh, A.,
Moulton, M. and Preece, A. (ed) Proceedings of E52001,
pp 183 —196.
Somayajulu, G. Sripada, Ehud Reiter, Jim Hunter and
Jin
Yu. 2002 Segmenting Time
Series
for Weather
Forecasting. In: Macintosh, A., Ellis, R. and Coe-
nen, F. (ed) Proceedings of ES2002,
pp. 193
-
206.
170