Tài liệu Báo cáo khoa học: "Information Presentation in Spoken Dialogue Systems" potx
Bạn đang xem bản rút gọn của tài liệu. Xem và tải ngay bản đầy đủ của tài liệu tại đây (286.07 KB, 8 trang )
Information Presentation in Spoken Dialogue Systems
Vera Demberg
Institute for Natural Language Processing (IMS)
University of Stuttgart
D-70174 Stuttgart
Johanna D. Moore
School of Informatics
University of Edinburgh
Edinburgh, EH8 9LW, GB
Abstract
To tackle the problem of presenting a
large number of options in spoken dia-
logue systems, we identify compelling op-
tions based on a model of user preferences,
and present tradeoffs between alternative
options explicitly. Multiple attractive op-
tions are structured such that the user can
gradually refine her request to find the
optimal tradeoff. We show that our ap-
proach presents complex tradeoffs under-
standably, increases overall user satisfac-
tion, and significantly improves the user’s
overview of the available options. More-
over, our results suggest that presenting
users with a brief summary of the irrele-
vant options increases users’ confidence in
having heard about all relevant options.
1 Introduction
The goal of spoken dialogue systems (SDS) is
to offer efficient and natural access to applica-
tions and services, such as email and calendars,
travel and entertainment booking, and product rec-
ommendation. In evaluating nine SDS in the
DARPA Communicator domain (flight, hotel, and
rental car hire), Walker et al. (2001) found that (1)
shorter task duration correlates with higher user
satisfaction, and (2) the information presentation
phase of dialogues is the primary contributor to
dialogue duration. During this phase, the typical
system enumerates the set of options that match
the user’s constraints, as shown in Figure 1. The
user can then refine these options by offering new
constraints. When the number of options to be
presented is large, this process can be painstaking,
leading to reduced user satisfaction. Moreover, as
S: I found 28 round trips from Edinburgh to Brussels on
October 31st and returning Edinburgh on November
6th. For option 1, I have an outbound flight with KLM
departing at 7 am and arriving at 8:49 am non-stop.
A return flight is with KLM departing at 10:30 am and
arriving at 11:28 am with 1 stopover. Ticket price is
£165. Please say “next option”, or, “flight details”, or,
“I’ll take it”.
U: Next option
S: For option 2, I have an outbound flight with KLM de-
parting at 3:30 pm and arriving at 5:19 pm nonstop.
A return flight is with KLM departing at 8:25 pm and
arriving at 12:28 pm with 1 stopover. Ticket price is
£165 please say “next option”, or, “flight details”, or,
“I’ll take it.”
U: Next option
S: . . .
Figure 1: Typical Information Presentation Phase
of a Communicator Dialogue
Walker et al. (2004) observe, having to access the
set of available options sequentially makes it diffi-
cult for the user to remember the various aspects of
multiple options and to compare them in memory.
Clearly, alternative strategies to sequential pre-
sentation of information in SDS are needed. Re-
cently, two approaches have been proposed. In
the user-model (UM) based approach, the sys-
tem identifies a small number of options that best
match the user’s preferences (Moore et al., 2004;
Walker et al., 2004). In the summarize and re-
fine (SR) approach, the system structures the large
number of options into a small number of clus-
ters that share attributes. The system summa-
rizes the clusters based on their attributes and then
prompts the user to provide additional constraints
(Polifroni et al., 2003; Chung, 2004).
In this paper, we present an algorithm that com-
bines the benefits of these two approaches in an
approach to information presentation that inte-
grates user modelling with automated clustering.
65
Thus, the system provides detail only about those
options that are of some relevance to the user,
where relevance is determined by the user model.
If there are multiple relevant options, a cluster-
based tree structure orders these options to allow
for stepwise refinement. The effectiveness of the
tree structure, which directs the dialogue flow, is
optimized by taking the user’s preferences into ac-
count. Complex tradeoffs between alternative op-
tions are presented explicitly to allow for a bet-
ter overview and a more informed choice. In ad-
dition, we address the issue of giving the user a
good overview of the option space, despite select-
ing only the relevant options, by briefly accounting
for the remaining (irrelevant) options.
In the remainder of this paper, we describe the
prior approaches in more detail, and discuss their
limitations (Section 2). In section 3, we describe
our approach, which integrates user preferences
with automated clustering and summarization in
an attempt to overcome the problems of the origi-
nal approaches. Section 4 presents our clustering
and content structuring algorithms and addresses
issues in information presentation. In Section 5,
we describe an evaluation of our approach and dis-
cuss its implications.
2 Previous Work in Information
Presentation
2.1 Tailoring to a User Model
Previous work in natural language generation
showed how a multi-attribute decision-theoretic
model of user preferences could be used to deter-
mine the attributes that are most relevant to men-
tion when generating recommendations tailored to
a particular user (Carenini and Moore, 2001). In
the MATCH system, Walker et al. (2004) applied
this approach to information presentation in SDS,
and extended it to generate summaries and com-
parisons among options, thus showing how the
model can be used to determine which options to
mention, as well as the attributes that the user will
find most relevant to choosing among them. Eval-
uation showed that tailoring recommendations and
comparisons to the user increases argument effec-
tiveness and improves user satisfaction (Stent et
al., 2002).
MATCH included content planning algorithms
to determine what options and attributes to men-
tion, but used a simple template based approach
to realization. In the FLIGHTS system, Moore
et al. (2004) focussed on organizing and express-
ing the descriptions of the selected options and at-
tributes, in ways that are both easy to understand
and memorable. For example, Figure 2 shows a
description of options that is tailored to a user who
prefers flying business class, on direct flights, and
on KLM, in that order. In FLIGHTS, coherence
and naturalness of descriptions were increased by
reasoning about information structure (Steedman,
2000) to control intonation, using referring expres-
sions that highlight attributes relevant to the user
(e.g., “the cheapest flight” vs. “a KLM flight” ),
and signalling discourse relations (e.g., contrast)
with appropriate intonational and discourse cues.
S: You can fly business class on KLM, arriving at four
twenty p.m., but you’d need to connect in London. There
is a direct flight on BMI, arriving at four ten p.m., but it
has no availability in business class.
Figure 2: Tailored description by FLIGHTS
This prior work demonstrated that the user
model-based approach can concisely present a rel-
atively small number of options, pointing out the
ways in which those options satisfy user prefer-
ences. It is an appropriate strategy for SDS when
there are a small number of options to present, ei-
ther because the number of options is limited or
because users can supply sufficient constraints to
winnow down a large set before querying the data-
base of options.
However, there are several limitations to this ap-
proach. First, it does not scale up to presenting
a large number of options. When there are hun-
dreds of options to consider (e.g., when choosing
among consumer products, hotels, or restaurants)
there may be many options that are close in score.
In addition, users may not be able to provide con-
straints until they hear more information about the
space of options. This brings up a second problem
with the UM-based approach, namely that it does
not provide the user with an overview of the op-
tion space, because options scoring below a speci-
fied threshold are not mentioned. This is related to
the third problem, which is that users might miss
out on options they would have chosen if they had
heard about them. These last two problems may
reduce user confidence in the system, if users have
the perception that the system is not telling them
about all of the available options. This may ulti-
mately lead to a decrease in user satisfaction.
66
2.2 Stepwise Refinement through Clustering
and Summarization
Polifroni et al. (2003) developed an approach that
structures large datasets for summarization and
successive refinement. It supports the user in nar-
rowing in on a suitable option by clustering the
options in the database, summarizing the option
clusters and suggesting further constraints. In this
approach, the prompts presented to the user, and
the order in which they appear are determined at
run-time based on an algorithm that computes the
most useful set of attributes, as dictated by the cur-
rent data subset. For large data sets, attributes that
partition the data into the minimal number of clus-
ters are chosen, so that a concise summary can be
presented to the user to refine, see Figure 3.
M: What restaurants do you have?
S: I have found 983 restaurants. Most of them are located
in Boston and Cambridge. There are 32 choices for cui-
sine. I also have information about price range.
M: Okay tell me about the ones in Boston.
S: I have found 401 restaurants in Boston. There are 29
choices for cuisine.
M: Do you have any that serve seafood?
S: I have found 19 seafood restaurants. They are predomi-
nantly in Back Bay, the North End, South Boston and the
South End.
M: In the South End.
S: I have found 3 restaurants. Grill Fish on Columbus Av-
enue, McCormick & Schmick’s on Columbus Avenue and
Joseph’s on High Street.
Figure 3: Dialogue between simulator (M) and Po-
lifroni system (S)
Polifroni et al.’s approach was extended by
Chung (2004), who proposed a constraint relax-
ation strategy for coping with queries that are too
restrictive to be satisfied by any option. Qu and
Beale (2003) had previously addressed the prob-
lem of responding to user queries with several
constraints and used linguistic cues to determine
which constraints had to be relaxed. Our discus-
sion and evaluation of the SR approach is based
on Chung’s version.
Although the SR approach provides a solution
to the problem of presenting information when
there are large numbers of options in a way that is
suitable for SDS, it has several limitations. First,
there may be long paths in the dialogue struc-
ture. Because the system does not know about the
user’s preferences, the option clusters may contain
many irrelevant entities which must be filtered out
successively with each refinement step. In addi-
tion, the difficulty of summarizing options typi-
cally increases with their number, because values
are more likely to be very diverse, to the point
that a summary about them gets uninformative (“I
found flights on 9 airlines.”).
A second problem with the SR approach is that
exploration of tradeoffs is difficult when there is
no optimal option. If at least one option satis-
fies all requirements, this option can be found effi-
ciently with the SR strategy. But the system does
not point out alternative tradeoffs if no “optimal”
option exists. For example, in the flight book-
ing domain, suppose the user wants a flight that is
cheap and direct, but there are only expensive di-
rect and cheap indirect flights. In the SR approach,
as described by Polifroni, the user has to ask for
cheap flights and direct flights separately and thus
has to explore different refinement paths.
Finally, the attribute that suggests the next user
constraint may be suboptimal. The procedure for
computing the attribute to use in suggesting the
next restriction to the user is based on the con-
siderations for efficient summarization, that is, the
attribute that will partition the data set into the
smallest number of clusters. If the attribute that
is best for summarization is not of interest to this
particular user, dialogue duration is unnecessarily
increased, and the user may be less satisfied with
the system, as the results of our evaluation suggest
(see section 5.2).
3 Our Approach
Our work combines techniques from the UM and
SR approaches. We exploit information from a
user model to reduce dialogue duration by (1) se-
lecting all options that are relevant to the user,
and (2) introducing a content structuring algorithm
that supports stepwise refinement based on the
ranking of attributes in the user model. In this
way, we keep the benefits of user tailoring, while
extending the approach to handle presentation of
large numbers of options in an order that reflects
user preferences. To address the problem of user
confidence, we also briefly summarize options that
the user model determines to be irrelevant (see
section 4.3). Thus, we give users an overview of
the whole option space, and thereby reduce the
risk of leaving out options the user may wish to
choose in a given situation.
The integration of a user model with the cluster-
ing and structuring also alleviates the three prob-
lems we identified for the SR approach. When a
67
user model is available, it enables the system to
determine which options and which attributes of
options are likely to be of interest to the particu-
lar user. The system can then identify compelling
options, and delete irrelevant options from the re-
finement structure, leading to shorter refinement
paths. Furthermore, the user model allows the
system to determine the tradeoffs among options.
These tradeoffs can then be presented explicitly.
The user model also allows the identification of the
attribute that is most relevant at each stage in the
refinement process. Finally, the problem of sum-
marizing a large number of diverse attribute values
can be tackled by adapting the cluster criterion to
the user’s interest.
In our approach, information presentation is
driven by the user model, the actual dialogue con-
text and the available data. We allow for an arbi-
trarily large number of alternative options. These
are structured so that the user can narrow in on one
of them in successive steps. For this purpose, a
static option tree is built. Because the structure of
the option tree takes the user model into account,
it allows the system to ask the user to make the
most relevant decisions first. Moreover, the option
tree is pruned using an algorithm that takes advan-
tage of the tree structure, to avoid wasting time
by suggesting irrelevant options to the user. The
tradeoffs (e.g., cheap but indirect flights vs. direct
but expensive flights) are presented to the user ex-
plicitly, so that the user won’t have to “guess” or
try out paths to find out what tradeoffs exist. Our
hypothesis was that explicit presentation of trade-
offs would lead to a more informed choice and de-
crease the risk that the user does not find the opti-
mal option.
4 Implementation
Our approach was implemented within a spoken
dialogue system for flight booking. While the con-
tent selection step is a new design, the content pre-
sentation part of the system is an adaptation and
extension of the work on generating natural sound-
ing tailored descriptions reported in (Moore et al.,
2004).
4.1 Clustering
The clustering algorithm in our implementation is
based on that reported in (Polifroni et al., 2003).
The algorithm can be applied to any numerically
ordered dataset. It sorts the data into bins that
roughly correspond to small, medium and large
values in the following way. The values of each at-
tribute of the objects in the database (e.g., flights)
are clustered using agglomerative group-average
clustering. The algorithm begins by assigning
each unique attribute value to its own bin, and suc-
cessively merging adjacent bins whenever the dif-
ference between the means of the bins falls below
a varying threshold. This continues until a stop-
ping criterion (a target number of no more than
three clusters in our current implementation) is
met. The bins are then assigned predefined labels,
e.g., cheap, average-price, expensive
for the price attribute.
Clustering attribute values with the above algo-
rithm allows for database-dependent labelling. A
£300 flight gets the label cheap if it is a flight
from Edinburgh to Los Angeles (because most
other flights in the database are more costly) but
expensive if it is from Edinburgh to Stuttgart
(for which there are a lot of cheaper flights in the
data base). Clustering also allows the construc-
tion of user valuation-sensitive clusters for cat-
egorial values, such as the attribute airline:
They are clustered to a group of preferred air-
lines, dispreferred airlines and airlines the
user does not-care about.
4.2 Building up a Tree Structure
The tree building algorithm works on the clusters
produced by the clustering algorithm instead of the
original values. Options are arranged in a refine-
ment tree structure, where the nodes of an option
tree correspond to sets of options. The root of
the tree contains all options and its children con-
tain complementary subsets of these options. Each
child is homogeneous for a given attribute (e.g., if
the parent set includes all direct flights, one child
might include all direct cheap flights whereas an-
other child includes all direct expensive flights).
Leaf-nodes correspond either to a single option or
to a set of options with very similar values for all
attributes.
This tree structure determines the dialogue flow.
To minimize the need to explore several branches
of the tree, the user is asked for the most essential
criteria first, leaving less relevant criteria for later
in the dialogue. Thus, the branching criterion for
the first level of the tree is the attribute that has the
highest weight according to the user model. For
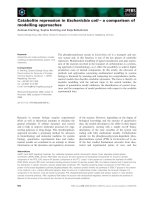
example, Figure 5 shows an option tree structure
68
rank attributes
1 fare class (preferred value: business)
2 arrival time, # of legs, departure time, travel time
6 airline (preferred value: KLM)
7 price, layover airport
Figure 4: Attribute ranking for business user
Figure 5: Option tree for business user
for our “business” user model (Figure 4).
The advantage of this ordering is that it mini-
mizes the probability that the user needs to back-
track. If an irrelevant criterion had to be decided
on first, interesting tradeoffs would risk being scat-
tered across the different branches of the tree.
A special case occurs when an attribute is ho-
mogeneous for all options in an option set. Then a
unary node is inserted regardless of its importance.
This special case allows for more efficient summa-
rization, e.g., “There are no business class flights
on KLM.” In the example of Figure 5, the attribute
airline is inserted far up in the tree despite its
low rank.
The user is not forced to impose a to-
tal ordering on the attributes but may specify
that two attributes, e.g., arrival-time and
number-of-legs, are equally important to her.
This partial ordering leads to several attributes
having the same ranking. For equally ranked at-
tributes, we follow the approach taken by Polifroni
et al. (2003). The algorithm selects the attribute
that partitions the data into the smallest number
of sub-clusters. For example, in the tree in Fig-
ure 5, number-of-legs, which creates two
sub-clusters for the data set (direct and indirect),
comes before arrival-time, which splits the
set of economy class flights into three subsets.
The tree building algorithm introduces one of
the main differences between our structuring and
Polifroni’s refinement process. Polifroni et al.’s
system chooses the attribute that partitions the data
into the smallest set of unique groups for sum-
marization, whereas in our system, the algorithm
takes the ranking of attributes in the user model
into account.
4.3 Pruning the Tree Structure
To determine the relevance of options, we did not
use the notion of compellingness (as was done in
(Moore et al., 2004; Carenini and Moore, 2001)),
but instead defined the weaker criterion of “dom-
inance”. Dominant options are those for which
there is no other option in the data set that is better
on all attributes. A dominated option is in all re-
spects equal to or worse than some other option in
the relevant partition of the data base; it should not
be of interest for any rational user. All dominant
options represent some tradeoff, but depending on
the user’s interest, some of them are more interest-
ing tradeoffs than others.
Pruning dominated options is crucial to our
structuring process. The algorithm uses informa-
tion from the user model to prune all but the dom-
inant options. Paths from the root to a given op-
tion are thereby shortened considerably, leading to
a smaller average number of turns in our system
compared to Polifroni et al.’s system.
An important by-product of the pruning al-
gorithm is the determination of attributes which
make an option cluster compelling with respect
to alternative clusters (e.g., for a cluster con-
taining direct flights, as opposed to flights that
require a connection, the justification would be
#-of-legs). We call such an attribute the “jus-
tification” for a cluster, as it justifies its existence,
i.e., is the reason it is not pruned from the tree. Jus-
tifications are used by the generation algorithm to
present the tradeoffs between alternative options
explicitly.
Additionally, the reasons why options have
been pruned from the tree are registered and pro-
vide information for the summarization of bad op-
tions in order to give the user a better overview of
the option space (e.g., “All other flights are either
indirect or arrive too late.”). To keep summaries
about irrelevant options short, we back off to a de-
fault statement “or are undesirable in some other
way.” if these options are very heterogeneous.
69
4.4 Presenting Clusters
4.4.1 Turn Length
In a spoken dialogue system, it is important not
to mention too many facts in one turn in order to
keep the memory load on the user manageable.
Obviously, it is not possible to present all of the
options and tradeoffs represented in the tree in a
single turn. Therefore, it is necessary to split the
tree into several smaller trees that can then be pre-
sented over several turns. In the current implemen-
tation, a heuristic cut-off point (no deeper than two
branching nodes and their children, which corre-
sponds to the nodes shown in Figure 5) is used.
This procedure produces a small set of options to
present in a turn and includes the most relevant ad-
vantages and disadvantages of an option. The next
turn is determined by the user’s choice indicating
which of the options she would like to hear more
about (for illustration see Figure 6).
4.4.2 Identifying Clusters
The identification of an option set is based on
its justification. If an option is justified by several
attributes, only one of them is chosen for identi-
fication. If one of the justifications is a contex-
tually salient attribute, this one is preferred, lead-
ing to constructions like: “. . . you’d have to make
a connection in Brussels. If you want to fly di-
rect,. . . ”). Otherwise, the cluster is identified by
the highest ranked attribute e.g.,“There are four
flights with availability in business class.”. If an
option cluster has no compelling homogeneous at-
tribute, but only a common negative homogeneous
attribute, this situation is acknowledged: e.g., “If
you’re willing to travel economy / arrive later / ac-
cept a longer travel time, . . . ”.
4.4.3 Summarizing Clusters
After the identification of a cluster, more in-
formation is given about the cluster. All positive
homogeneous attributes are mentioned and con-
trasted against all average or negative attributes.
An attribute that was used for identification of
an option is not mentioned again in the elabora-
tion. In opposition to a single flight, attributes may
have different values for the entities within a set of
flights. In that case, these attribute values need to
be summarized.
There are three main cases to be distinguished:
1. The continuous values for the attributes
price, arrival-time etc. need to be
summarized, as they may differ in their val-
ues even if they are in the same cluster. One
way to summarize them is to use an ex-
pression that reflects their value range, e.g.
“between x and y”. Another solution is to
mention only the evaluation value, leading to
sentences like “The two flights with shortest
travel time” or “The cheapest flights.”
2. For discrete-valued attributes with a
small number of possible values, e.g.,
number-of-legs and fare-class,
summarization is not an issue, because when
homogeneous for a cluster, the attribute
values of its options are identical.
3. The third group are attributes with catego-
rial values, e.g., “airline”. If there are no
more than three different values, we summa-
rize using quantifications like “none/all/both
of them”, as done in (Polifroni et al., 2003).
If the values are more diverse, the user model
comes back into play to produce a tailored
summary based on user preferences (e.g., lik-
ing KLM). For example, we would generate
“None are on KLM.”, which takes into ac-
count the user’s preference and is shorter than
mentioning all airlines the flights are on.
An issue arising from summarization with nega-
tion is that the negated value has to be salient, oth-
erwise the utterance might be irritating. For exam-
ple, it would be better to say “These flights are not
direct.” in a neutral context, but “You would not
need to connect in London Heathrow.” if London
Heathrow had already been mentioned.
A sample dialogue produced by our system,
when given the business user model (see Figure 4),
is shown in Figure 6.
5 Evaluation
A within-participants laboratory experiment was
conducted in order to determine whether user
model-based clustering leads to increased overall
user satisfaction, a better overview of the avail-
able options, quicker accessibility to the optimal
option and higher confidence of having heard all
relevant options. The experiment furthermore as-
sessed whether the options were presented in a
way that users found understandable and recorded
the time users took to read a dialogue turn.
70
U: Hello. I’d like to book a flight from Edinburgh to Brus-
sels for tomorrow arriving at around 3pm.
S: There are four flights with availability in business class.
None are on KLM. The only direct flight arrives at 5:30
pm, which is later than you requested. To arrive earlier,
you’ll have to make a connection.
If you’re willing to travel economy, there is a direct flight
on BMI, arriving at 1:10 pm. There’s also a KLM flight
arriving at 1:50 pm, but it requires a connection in Am-
sterdam. All other economy flights take longer or arrive
after 4 pm.
U: Can you tell me more about the business class flights that
arrive earlier?
S: The two flights with shortest travel time are both on
British Airways and cost 308 pounds. The first takes 4
hours and 20 minutes and arrives at 1:20 pm. The other
takes 4 hours and 30 minutes and arrives at 3:30pm.
There’s a cheaper flight on Lufthansa. It arrives at
3:10pm and costs just 270 pounds, but it takes 5 hours
and 35 minutes. All other business class flights arrive
very early or too late.
Figure 6: Example Dialogue with our System
5.1 Experimental Design
Each of the 38 subjects who completed the exper-
iment was presented with six dialogue pairs, the
first of which was used for training and was thus
not included in the analysis. Each dialogue pair
consisted of one dialogue between a user and our
system and one dialogue between the same user
and a system designed as described in (Polifroni
et al., 2003; Chung, 2004) (cf. Section 2.2). Some
of the dialogues with our system were constructed
manually based on the content selection and struc-
turing step, because the generation component did
not cover all linguistic constructions needed. The
dialogues with the Chung system were designed
manually, as this system is implemented for an-
other domain. The order of the dialogues in a pair
was randomized. The dialogues were provided as
transcripts.
After reading each dialogue transcript, partici-
pants were asked four questions about the system’s
responses. They provided their answers using Lik-
ert scales.
1. Did the system give the information in a way that was
easy to understand?
1: very hard to understand
7: very easy to understand
2. Did the system give you a good overview of the avail-
able options?
1: very poor overview
7: very good overview
3. Do you think there may be flights that are better options
for X
1
that the system did not tell X
1
about?
1
X was instantiated by name of our example users.
1: I think that is very possible
7: I feel the system gave a good overview of all options
that are relevant for X
1
.
4. How quickly did the system allow X
1
to find the opti-
mal flight?
1: slowly
3: quickly
After reading each pair of dialogues, the partic-
ipants were also asked the forced choice question:
“Which of the two systems would you recommend
to a friend?” to assess user satisfaction.
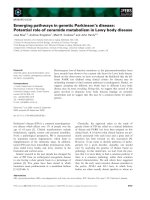
5.2 Results
A significant preference for our system was ob-
served. (In the diagrams, our system which com-
bines user modelling and stepwise refinement is
called UMSR, whereas the system based on Po-
lifroni’s approach is called SR.) There were a total
of 190 forced choices in the experiment (38 par-
ticipants * 5 dialogue pairs). UMSR was preferred
120 times (≈ 0.63%), whereas SR was preferred
only 70 times (≈ 0.37%). This difference is highly
significant (p < 0.001) using a two-tailed bino-
mial test. Thus, the null-hypothesis that both sys-
tems are preferred equally often can be rejected
with high confidence.
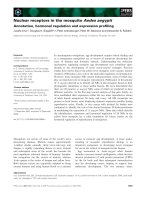
The evaluation results for the Likert scale ques-
tions confirmed our expectations. The SR dia-
logues received on average slightly higher scores
for understandability (question 1), which can be
explained by the shorter length of the system turns
for that system. However, the difference is not
statistically significant (p = 0.97 using a two-
tailed paired t-test). The differences in results
for the other questions are all highly statistically
significant, especially for question 2, assessing
the quality of overview of the options given by
the system responses, and question 3, assessing
the confidence that all relevant options were men-
tioned by the system. Both were significant at
p < 0.0001. These results confirm our hypothe-
sis that our strategy of presenting tradeoffs explic-
itly and summarizing irrelevant options improves
users’ overview of the option space and also in-
creases their confidence in having heard about all
relevant options, and thus their confidence in the
system. The difference for question 4 (accessibil-
ity of the optimal option) is also statistically sig-
nificant (p < 0.001). Quite surprisingly, subjects
reported that they felt they could access options
more quickly even though the dialogues were usu-
ally longer. The average scores (based on 190 val-
71
Figure 7: Results for all Questions
ues) are shown in Figure 7.
To get a feel for whether the content given by
our system is too complex for oral presentation
and requires participants to read system turns sev-
eral times, we recorded reading times and corre-
lated them to the number of characters in a system
turn. We found a linear relation, which indicates
that participants did not re-read passages and is a
promising sign for the use of our strategy in SDS.
6 Conclusions and Future Work
In this paper, we have shown that information pre-
sentation in SDS can be improved by an approach
that combines a user model with structuring of
options through clustering of attributes and suc-
cessive refinement. In particular, when presented
with dialogues generated by a system that com-
bines user modelling with successive refinement
(UMSR) and one that uses refinement without ref-
erence to a user model (SR), participants reported
that the combined system provided them with a
better overview of the available options and that
they felt more certain to have been presented with
all relevant options. Although the presentation of
complex tradeoffs usually requires relatively long
system turns, participants were still able to cope
with the amount of information presented. For
some dialogues, subjects even felt they could ac-
cess relevant options more quickly despite longer
system turn length.
In future work, we would like to extend the clus-
tering algorithm to not use a fixed number of tar-
get clusters but to depend on the number of natural
clusters the data falls into. We would also like to
extend it to be more sensitive to the user model
when forming clusters (e.g., to be more sensitive
at lower price levels for a user for whom price is
very important than for a user who does not care
about price).
The explicit presentation of tradeoffs made by
the UMSR system in many cases leads to dialogue
turns that are more complex than typical dialogue
turns in the SR system. Even though participants
did not report that our system was harder to under-
stand, it would be interesting to investigate how
well users can understand and remember informa-
tion from the system when part of their concentra-
tion is absorbed by another task, for example when
using the system while driving a car.
Acknowledgments
We would like to thank the anonymous review-
ers for their comments. The research is supported
by the TALK project (European Community IST
project no. 507802), .
The first author was supported by Evangelisches
Studienwerk e.V. Villigst.
References
G. Carenini and J.D. Moore. 2001. An empirical study of
the influence of user tailoring on evaluative argument ef-
fectiveness. In Proc. of IJCAI 2001.
G. Chung. 2004. Developing a flexible spoken dialog system
using simulation. In Proc. of ACL ’04.
V. Demberg. 2005. Information presentation in spoken di-
alogue systems. Master’s thesis, School of Informatics,
University of Edinburgh.
J.D. Moore, M.E. Foster, O. Lemon, and M. White. 2004.
Generating tailored, comparative descriptions in spoken
dialogue. In Proc. of the 17th International Florida Artifi-
cial Intelligence Research Sociey Conference, AAAI Press.
J. Polifroni, G. Chung, and S. Seneff. 2003. Towards au-
tomatic generation of mixed-initiative dialogue systems
from web content. In Proc. of Eurospeech ’03, Geneva,
Switzerland, pp. 193–196.
Y. Qu and S. Beale. 1999. A constraint-based model for
cooperative response generation in information dialogues.
In AAAI/IAAI 1999 pp. 148–155.
M. Steedman 2000. Information structure and the syntax-
phonology interface. In Linguistic Inquiry, 31(4): 649–
689.
A. Stent, M.A. Walker, S. Whittaker, and P. Maloor. 2002.
User-tailored generation for spoken dialogue: an experi-
ment. In Proc. of ICSLP-02.
M.A. Walker, S. Whittaker, A. Stent, P. Maloor, J.D. Moore,
M. Johnston, and G. Vasireddy. 2004. Generation and
evaluation of user tailored responses in dialogue. In Cog-
nitive Science 28: 811-840.
M.A. Walker, R. Passonneau, and J.E. Boland. 2001. Quanti-
tative and qualitative evaluation of DARPA communicator
spoken dialogue systems. In Proc of ACL-01.
72