Tài liệu Determining the Cost of Producing Ethanol from Corn Starch and Lignocellulosic Feedstocks pot
Bạn đang xem bản rút gọn của tài liệu. Xem và tải ngay bản đầy đủ của tài liệu tại đây (619.01 KB, 44 trang )
Determining the Cost of
Producing Ethanol from Corn
Starch and Lignocellulosic
Feedstocks
A Joint Study Sponsored by:
U.S. Department of Agriculture and
U.S. Department of Energy
October 2000 • NREL/TP-580-28893
A
ndrew McAloon, Frank Taylor, and Winnie Yee
U.S. Department of Agriculture
Eastern Regional Research Center
A
gricultural Research Service
Kelly Ibsen and Robert Wooley
National Renewable Energy Laboratory
Biotechnology Center for Fuels and Chemicals
National Renewable Energy Laboratory
1617 Cole Boulevard
Golden, Colorado 80401-3393
NREL is a U.S. Department of Energy Laboratory
Operated by Midwest Research Institute •
••
• Battelle •
••
• Bechtel
Contract No. DE-AC36-99-GO10337
National Renewable Energy Laboratory
1617 Cole Boulevard
Golden, Colorado 80401-3393
NREL is a U.S. Department of Energy Laboratory
Operated by Midwest Research Institute •
••
• Battelle •
••
• Bechtel
Contract No. DE-AC36-99-GO10337
October 2000 • NREL/TP-580-28893
Determining the Cost of
Producing Ethanol from Corn
Starch and Lignocellulosic
Feedstocks
A Joint Study Sponsored by:
U.S. Department of Agriculture and
U.S. Department of Energy
A
ndrew McAloon, Frank Taylor, and Winnie Yee
U.S. Department of Agriculture
Eastern Regional Research Center
A
gricultural Research Service
Kelly Ibsen and Robert Wooley
National Renewable Energy Laboratory
Biotechnology Center for Fuels and Chemicals
Prepared under Task No. BFP1.7110
NOTICE
This report was prepared as an account of work sponsored by an agency of the United States
government. Neither the United States government nor any agency thereof, nor any of their employees,
makes any warranty, express or implied, or assumes any legal liability or responsibility for the accuracy,
completeness, or usefulness of any information, apparatus, product, or process disclosed, or represents
that its use would not infringe privately owned rights. Reference herein to any specific commercial
product, process, or service by trade name, trademark, manufacturer, or otherwise does not necessarily
constitute or imply its endorsement, recommendation, or favoring by the United States government or any
agency thereof. The views and opinions of authors expressed herein do not necessarily state or reflect
those of the United States government or any agency thereof.
Available electronically at />Available for a processing fee to U.S. Department of Energy
and its contractors, in paper, from:
U.S. Department of Energy
Office of Scientific and Technical Information
P.O. Box 62
Oak Ridge, TN 37831-0062
phone: 865.576.8401
fax: 865.576.5728
email:
Available for sale to the public, in paper, from:
U.S. Department of Commerce
National Technical Information Service
5285 Port Royal Road
Springfield, VA 22161
phone: 800.553.6847
fax: 703.605.6900
email:
online ordering: />Printed on paper containing at least 50% wastepaper, including 20% postconsumer waste
Summary
The mature corn-to-ethanol industry has many similarities to the emerging lignocellulose-
to-ethanol industry. It is certainly possible that some of the early practitioners of this new
technology will be the current corn ethanol producers. In order to begin to explore
synergies between the two industries, a joint project between two agencies responsible
for aiding these technologies in the Federal government was established. This joint
project of the U.S. Department of Agriculture’s Agricultural Research Service (USDA-
ARS) and the U.S. Department of Energy (DOE) with the National Renewable Energy
Laboratory (NREL) looked at the two processes on a similar process design and
engineering basis, and will eventually explore ways to combine them. This report
describes the comparison of the processes, each producing 25 million annual gallons of
fuel ethanol. This paper attempts to compare the two processes as mature technologies,
which requires assuming that the technology improvements needed to make the
lignocellulosic process commercializable are achieved, and enough plants have been built
to make the design well-understood. Assumptions about yield are based on the assumed
successful demonstration of the integration of technologies we feel exist for the
lignocellulose process. In order to compare the lignocellulose-to-ethanol process costs
with the commercial corn-to-ethanol costs, it was assumed that the lignocellulose plant
was an N
th
generation plant, assuming no first-of-a-kind costs. This places the
lignocellulose plant costs on a similar level with the current, established corn ethanol
industry, whose costs are well known. The resulting costs of producing 25 million annual
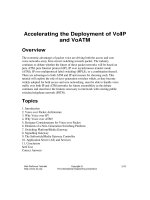
gallons of fuel ethanol from each process were determined. The figure below shows the
production cost breakdown for each process. The largest cost contributor in the corn
starch process is the feedstock; for the lignocellulosic process it is the depreciation of
capital cost, which is represented by depreciation cost on an annual basis.
Comparative Production Costs for Starch and Lignocellulose Processes (1999$)
-$0.30
-$0.10
$0.10
$0.30
$0.50
$0.70
$0.90
$1.10
$1.30
$1.50
$1.70
STARCH* CELLULOSE
Fuel Ethanol Cost ($/gal)
Feedstock Variable Operating Costs
Labor, Supplies, and Overhead Depreciation of Capital
Co-products Total
*Dry Milling Process
i
Table of Contents
I Introduction 1
II Comparing the Corn Industry and a Lignocellulose-Based Industry 3
II.1 History of the Corn Ethanol Industry 3
II.2 Status of Lignocellulose-to-Ethanol Process 4
III Process Descriptions 6
III.1 Corn Starch Feedstock-to-Ethanol Process Description 6
III.2 Lignocellulose Feedstock-to-Ethanol Process Description 8
III.3 Primary Process Differences 9
IV Normalization of Design and Economic Models 10
IV.1 History of the Models 11
IV.2 Methodology for Achieving the Same Basis 12
V Changes Required in the Process Models 15
V.1 Starch Model 15
V.2 Lignocellulose Model 15
VI Production Costs of Fuel Ethanol 17
VI.1 Production Costs for the Starch Process 18
VI.2 Production Costs for the Lignocellulose Process 20
VI.3 Comparison of Costs 23
VII Future Impact of Co-Products 25
VII.1 The Future of Starch Process Co-Products 26
VII.2 The Future of Lignocellulose Process Co-Products 26
VIII Prospects and Challenges for a Combined Process 27
IX References 29
This report is also available electronically at />ii
List of Tables
1. Corn and Stover Compositions 3
2. DDG and Lignocellulosic Residue Composition and Production 10
3. General Parameters 12
4. Production Costs for the Starch Process 18
5. Capital Costs by Process Area (1999$) 19
6. Production Costs for the Lignocellulose Process (1999$) 20
7. Capital Costs by Process Area (1999$) 22
8. Utility Costs 22
iii
List of Figures
1. Corn Starch-to-ethanol Process Flow 6
2. Lignocellulose-to-ethanol Process Flow 8
3. Comparison of Starch and Lignocellulose Process Stainless Steel Tank Cost13
4. Comparison of Starch and Lignocellulose Process Heat Exchanger Cost 14
5. Production Costs in Dollars per Gallon of Fuel Ethanol (1999$) 17
6. Effect of Changing Feedstock Cost on Fuel Ethanol Production Cost 23
7. Starch Costs by Process Area (1999$) 24
8. Lignocellulose Costs by Area (1999$) 25
iv
List of Acronyms
ARS Agricultural Research Service
CO
2
carbon dioxide
COD chemical oxygen demand
CSREES Cooperative State Research, Education, and Extension Services
DCFROR Discounted Cash Flow Rate of Return
DDG Distillers' Dried Grains
DOE U.S. Department of Energy
ERS Economic Research Services
FBC Fluidized Bed Combustor
GMO genetically modified organism
GRAS generally regarded as safe
GUI Graphical User Interface
kW kilowatt
kWh kilowatt-hour
NREL National Renewable Energy Laboratory
OEPNU Office of Energy Policy and New Uses
ORNL Oak Ridge National Laboratory
USDA U.S. Department of Agriculture
1
I Introduction
The U.S. Department of Energy (DOE) is promoting the development of ethanol from
lignocellulosic feedstocks as an alternative to conventional petroleum transportation
fuels. Programs sponsored by DOE range from research to develop better cellulose
hydrolysis enzymes and ethanol-fermenting organisms, to engineering studies of potential
processes, to co-funding initial ethanol from lignocellulosic biomass demonstration and
production facilities. This research is conducted by various national laboratories,
including the National Renewable Energy Laboratory (NREL) and Oak Ridge National
Laboratory (ORNL), as well as by universities and private industry. Engineering and
construction companies and operating companies are generally conducting the
engineering work.
The U.S. Department of Agriculture (USDA) has an active program devoted to the corn
ethanol industry. This program includes economic and policy studies by the Office of
Energy Policy and New Uses (OEPNU) and the Economic Research Services (ERS),
scientific research programs by the Agricultural Research Service (ARS) and the
Cooperative State Research, Education and Extension Services (CSREES). Areas of
scientific research address the establishment of new higher-value ethanol co-products, the
development of microbes capable of converting various biomass materials into ethanol,
improved processes for the enzymatic saccharification of corn fibers into sugars, and
various methods of improving corn ethanol process efficiencies.
The mature corn-to-ethanol industry has many similarities to the emerging lignocellulose-
to-ethanol industry. It is certainly possible that some of the early practitioners of this new
technology will be the current corn ethanol producers.
1,2,3
In order to begin to explore
synergies between the two industries, a joint project between two agencies responsible
for aiding these technologies in the Federal government was established. This joint
project of the USDA-ARS and DOE with NREL looked at the two processes on a similar
process design and engineering basis, and will eventually explore ways to combine them.
This report describes the comparison of the processes, each producing 25 million annual
gallons of fuel ethanol. This paper attempts to compare the two processes as mature
technologies, which requires assuming that the technology improvements needed to make
the lignocellulosic process commercializable are achieved, and enough plants have been
built to make the design well-understood. Assumptions about yield are based on the
assumed successful demonstration of the integration of technologies we feel exist for the
lignocellulose process. In order to compare the lignocellulose-to-ethanol process costs
with the commercial corn-to-ethanol costs, it was assumed that the lignocellulose plant
was an N
th
generation plant, assuming no first-of-a-kind costs. This places the
lignocellulose plant costs on a similar level with the current, established corn ethanol
industry, whose costs are well known.
The feedstock used for each process is different but related. There were 9.76 billion
bushels of corn, a commodity crop, produced in the 1998-1999 crop year. Of this, 526
million bushels (14.7 million tons at 15% moisture) were used in the corn ethanol
2
industry to produce fuel ethanol.
4
Corn stover, the residue left in the fields after
harvesting corn, has been identified as a near- to mid-term agriculture residue feedstock
for the lignocellulose-to-ethanol process. Corn stover has a high carbohydrate content,
can be collected in a sustainable fashion, and will provide economic benefits to the farm
community.
Corn kernels have starch, which is an alpha-linked glucose polymer that can be easily
broken down to glucose monomers and fermented to ethanol. It has fiber, which encases
the starch, and about 15% moisture. An approximate composition of corn is shown in
Table 1. In this analysis of the dry mill corn-to–ethanol process, a slightly different and
simpler composition for corn (on a dry weight basis, 70% starch, and for non-
fermentables, 18% suspended and 12% dissolved) was used. The market price of corn
varies, ranging from $1.94 to $3.24 per bushel during the last 3 years.
5
For this analysis,
$1.94 per bushel was used. Currently, the maximum amount of pure ethanol that can be
made from a bushel of corn is 2.74 gallons (98 gallons per ton at 15% moisture or 115
gallons per dry ton) before denaturation. This is less than the stoichiometric yield of
ethanol from starch because the fermentation process necessarily yields yeast cells and
byproducts in addition to carbon dioxide and ethanol. Yield is primarily dependent on
the starch content, which may vary considerably. For this analysis, a yield of 114 gallons
per dry ton (2.71 gallons per bushel) was used.
Corn stover contains considerable quantities of cellulose, a beta-linked glucose polymer,
which is more difficult to break down to glucose monomers than the alpha-linked
polymer in starch. In addition, it contains hemicellulose, which is a more complex
polymer of several sugars. The predominant sugars in hemicellulose are xylose and
arabinose. These five-carbon sugars can also be fermented to ethanol with the proper
microorganism. The maximum theoretical yield from corn stover with the composition
listed in Table 1 is 107 gallons per dry ton (or 91 gallons per ton at 15% moisture). For
this analysis, a yield of 69 gallons of pure ethanol per dry ton was used, which equates to
an average yield of 65% of the cellulose and hemicelluosic polymers. Entwined around
the two sugar polymers is lignin, a polymer that does not contain sugars. Lignin, like the
fiber in corn, has a by-product value. The fiber by-product is sold as Distillers’ Dried
Grains with solubles, or DDG. Lignin, currently recognized for its fuel value, may have
a better co-product value, as yet unrealized. Stover is typically 15% moisture, although it
can vary depending on age, growing conditions, and variety. Because the collection of
stover is a new industry, there is little data on the collection costs. The results of a small
stover collection program in 1997-1998 by Iron Horse Custom Farming of Harlan, Iowa,
reported stover collection costs between $31-$36 per dry ton.
6
Studies by contractors for
DOE have reported a range of $35-$46 per dry ton.
1,2,3
Because the stover is considered
a residue, it is expected that its price might not fluctuate as much as a commodity crop
like corn. However, demand for stover from an established lignocellulosic ethanol
industry could escalate the price. For this analysis, $35 per dry ton was used.
3
Table 1. Corn and Stover Compositions
Corn
7
% Dry Basis Corn stover
8
% Dry Basis
Starch 72.0 Cellulose 37.3
Hemicellulose/Cellulose 10.5 Galactan/Mannan 1.4
Protein 9.5 Xylan 20.6
Oil 4.5 Arabinan 2.1
Sugars 2.0 Lignin 17.5
Ash 1.5 Ash 6.1
Total 100.0 Acetate 2.0
Extractives 13.0
Total 100.0
% Moisture 15.0 % Moisture 15.0
It is known that 1 acre yields about 130 bushels (3.65 tons at 15% moisture) of corn,
5
and
about 1 ton of harvested corn yields 1 dry ton of stover. About 30% of the stover is
currently thought to be available for collection. The remaining stover needs to be left on
the field for erosion control. With an estimated 240 million dry tons of stover produced,
the 80 million dry tons available for harvesting is equivalent to 6 billion gallons of
ethanol.
6
II Comparing the Corn Ethanol Industry and a Lignocellulose-Based Industry
While the corn ethanol industry is new compared to petroleum refining or chemical
process industries, it has a history that can be used to develop process designs and cost
estimates with reasonable accuracy. In contrast, the conceptual lignocellulose process
design is based on research data. Hence, a higher degree of uncertainty is associated with
the design for the latter process.
II.1 History of the Corn Ethanol Industry
In 1999, approximately 1.48 billion gallons (112 trillion Btu) of fuel ethanol was blended
with gasoline for use in motor vehicles.
9
Most ethanol in the United States is produced
by either a wet milling or dry milling process and utilizes shelled corn as the principal
feedstock. Facilities using the wet milling process have greater production capacities, are
more capital intensive and produce a greater variety of products than dry milling
facilities. The wet milling process converts corn into corn oil, two animal feed products
(corn gluten feed and corn gluten meal), and starch-based products such as ethanol, corn
syrups, or cornstarch. Approximately 60% of the ethanol produced is from wet mills.
10
Farmer’s organizations building mills today favor the dry mill since it requires less
capital to build, a smaller staff to run, and tends to receive tax advantages due to smaller
capacity. The dry milling process traditionally generates two products only – ethanol and
DDG, an animal feed product. Both processes also generate carbon dioxide (CO
2)
which
is captured and marketed in some plants.
The ethanol industry's history goes back to the oil embargo in the 1970s and the concern
at that time about a lack of reliable energy sources. Since then, the technology used in the
ethanol dry milling process has evolved and the newer plants generally are more efficient
4
processing facilities. As a result, the costs to produce ethanol from corn starch and the
capital cost of dry mill ethanol plants have decreased. In 1978, ethanol was estimated to
cost $2.47 per gallon to produce (in year 2000 dollars).
11
By 1994 this price had
dropped to $1.43 per gallon
12
and current fuel ethanol production costs are estimated by
the authors to be about $0.88 per gallon for dry mill operations. The cost reductions may
be traced to various factors. The production of ethanol has become less energy intensive
due to new techniques in energy integration and the use of molecular sieves for ethanol
dehydration. The amount of pure ethanol produced from a bushel of corn has increased
from 2.5 gallons to more than 2.7 gallons.
The capital costs of dry mill ethanol plants have also decreased. In 1978 Katzen reported
costs for a 50 million annual gallon plant to be about $2.07 per annual gallon in current
dollars. Today new ethanol plants with the necessary utilities are estimated to cost
between $1.25 and $1.50 per annual gallon.
Ethanol production costs and profitability vary within the industry. Ethanol plants range
in size with rated yearly capacities from 1 or 2 million gallons to several hundred million
gallons. The larger facilities can achieve economies of scale, but other factors enter into
the cost of producing ethanol. Producers located near corn growers have the advantage
of lower shipping costs to their plants. Producers located near animal feed lots can ship
portions of their animal feed co-products in a wet form and eliminate the costs associated
with drying wet stillage. Producers located close to markets for CO
2
can sell the CO
2
generated in their fermentors while other producers must vent it to the atmosphere. Tax
credits are given in some, but not all states, to ethanol producers that meet varying size
requirements or other restrictions.
13
II.2 Status of Lignocellulose-to-Ethanol Process
Conversion of lignocellulosic biomass to ethanol has not yet been demonstrated at
commercial scale. Research on this emerging conversion technology began in the 1970s
in response to the same oil crisis that spawned the corn ethanol industry. The realization
that oil reserves would someday run out gave birth to the idea of a renewable energy
pool, one that could be made from either unlimited resources like the sun or wind, or
from replenished resources, like crops. Because there is no operating plant for processing
lignocellulose to ethanol, the process design and costing is based on lab and pilot scale
data, cost estimations of similar industries, and vendor knowledge of equipment design.
This obviously increases the margin for cost uncertainty compared to the established corn
ethanol industry.
NREL and other organizations, with funding from DOE, is researching this process. In
addition, many universities and private corporations are working to understand and
integrate the complex process pieces. Corn ethanol industry experts provide invaluable
help to further this technology, providing insights gained through decades of ethanol
production.
5
In order to compare the emerging lignocellulose-to-ethanol process with the commercial
corn starch-to-ethanol process, it was assumed that the lignocellulose plant was an N
th
generation plant, built after the industry had been sufficiently established to provide
verified costs. This places the lignocellulose plant on a similar level with the established
corn ethanol industry, whose costs are well known. This means that additional costs for
risk financing, longer start-ups, and other costs associated with first-of-a-kind or pioneer
plants are not included. This assumption allows for a process design with less
redundancy of systems; however, it should be noted that the estimation error is still
greater than for a process design based on established plant data and costs. From this
analysis, the capital cost per gallon of fuel ethanol is estimated at almost $5.44 for the
lignocellulose plant. Some of this cost is due to the higher complexity of the
lignocellulose conversion process. A more accurate comparison is with the early corn
ethanol industry. The cost of corn ethanol plants has dropped since the industry’s
inception, and it is realistic to assume that the lignocellulosic ethanol plant costs would
also be reduced as more plants are built.
For the lignocellulose process, elimination of some of the capital-intensive areas, through
purchase of the materials, could significantly reduce the capital cost. For example, in this
analysis enzyme is produced on-site for the lignocellulose process and purchased for the
starch process. This contributes about $0.70 per gallon in capital costs. Another area is
steam production. The lignocellulose plant produces steam from lignin-rich solid
residue, which requires a more expensive boiler than natural gas combustion for the
starch process. The solids boiler system contributes about $1.40 per gallon in capital
costs to the lignocellulose process. If the lignocellulose plant were able to locate next to
a power generator, steam and electricity could be purchased rather than produced.
For a larger capacity plant, the capital cost per gallon decreases due to the fact that capital
costs are not linear with plant capacity. A plant with two times the capacity, or 50 million
annual gallons, would have closer to $4.30 per gallon in capital costs. The cost to
transport feed from a longer distance to supply the larger plant might offset some of these
savings.
In contrast, one could model the lignocellulosic ethanol plant as a pioneer plant, the first
of its kind, in which case the costs would be significantly higher due to the higher level of
uncertainty in the design and costing. There are methodologies discussed in literature to
build this type of model which might provide a more accurate cost estimate in the design
and construction phases of the first plants.
14
The method compares a fledging technology
with an established similar one, taking into account how much of the technology is new
and how much is proven. Depending on this “new to proven” ratio, a factor is applied to
the cost estimates to account for the additional costs associated with the new technology.
Applying these factors, while increasing the cost estimate, may provide a more accurate
estimate earlier, and help avoid cost creep during the construction and startup phases.
6
III Process Descriptions
Each process has the same general flow, from feedstock handling through fermentation to
product and co-product recovery. The process details are outlined below.
III.1 Corn Starch Feedstock-to-Ethanol Process Description
Figure 1 depicts the dry mill process. The majority of the flowsheet information was
provided by Delta-T Corporation, which designs, constructs, and operates corn ethanol
plants.
15
Figure 1. Corn starch-to-ethanol dry mill process flow
Corn is received and conveyed to two storage silos, having a combined capacity of 10
days. Stored corn is conveyed to grain-cleaning equipment where trash such as tramp
metal and rocks (0.3%) is removed, and then to hammer mills (two operating mills, plus
one standby). The corn meal is metered to a continuous liquefaction tank, where it is
mixed with hot evaporator condensate and purchased alpha-amylase enzyme. The
condensate is heated with steam to maintain 88°C (190°F) in the tank. Used caustic from
the clean-in-place system and lime are also added to provide optimum pH (6) and
calcium for the alpha-amylase. Urea is added to provide nitrogen to the yeast
fermentation. After liquefaction, backset (recycled thin stillage from the centrifuge) is
added, amounting to 15% by volume of the final mash. Then the mash is heated to 110°C
(230°F), held for 20 minutes, and cooled to 60°C (140°F). Continuous saccharification
takes place in a stirred tank where purchased glucoamylase is added with sulfuric acid for
7
pH control (4.4). Residence time in the saccharification tank is 6 hours. The saccharified
mash is cooled to 32°C (89°F) and fed to four continuous cascade fermentors where yeast
is added. Total residence time in the fermentors is 46 hours. Temperature is maintained
below 34°C (93°F) by recirculation through two external heat exchangers, and pH is
maintained above 3.5. Recirculating the off-gas through a compressor mixes the airlift
fermentors. The concentration of ethanol in the whole beer leaving the fermentors is 9%
by weight (12% by volume).
In liquefaction, the alpha-amylase attacks the starch polymer randomly, producing
maltose (di-glucose) and higher oligomers. In saccharification, the gluco-amylase attacks
the non-reducing end of maltose and higher oligomers, splitting off glucose. In addition
to the alpha 1-4 linkages, there are alpha 1-6 branch points. These are attacked by
pullulanase. This enzyme is probably found as a minor constituent of commercial
enzymes, which are not pure enzyme preparations, but complex mixtures. The latest
development in dry-mill ethanol enzymes is alpha amylase containing some protease that
makes some of the corn protein available for yeast nutrition.
The whole beer is heated, degassed, and fed to the beer column. Steam and cooling water
for heating and cooling of the mash, whole beer, and whole stillage are conserved by the
use of heat recovery exchangers. Fermentor off-gas and vapors from degassing the whole
beer are sent to a water scrubber where ethanol vapor is removed and recycled. The
scrubbed CO
2
is released to the atmosphere. The whole stillage leaves the bottom of the
beer column at less than 0.1% by weight ethanol. The overhead vapors pass to the bottom
of the rectifier, where the concentration of ethanol is increased from 45% to 91% by
weight. The bottoms from the rectifier are pumped to the top of the stripper. The bottoms
from the stripper (less than 0.1% by weight ethanol) are recycled to the liquefaction tank
along with evaporator condensate. The concentrated vapor from the rectifier is
superheated and passes through one of two dehydrating molecular sieve beds; one is used
while the other is regenerated. Vapors from the regenerated bed are condensed and
recycled to the rectifier. The superheated vapor passing through the molecular sieve bed
contains more than 99% by weight ethanol. The product is condensed, cooled, stored,
denatured with gasoline (5% by volume), and shipped. Ethanol storage capacity is 12
days.
The whole stillage is partially evaporated in the first three stages of a six-effect vacuum
evaporator. The partially evaporated whole stillage is separated in a decanter centrifuge
(one operating plus one standby). The wet grains leave the centrifuge at 35% by weight
total solids. The thin stillage from the centrifuge is partially recycled as backset, and the
remainder is concentrated in the final three stages of the evaporator to syrup containing
55% by weight total solids. To conserve steam and cooling water, the condensation of
overhead vapors from the rectifier to provide reflux for distillation is accomplished in the
evaporator. The syrup and wet grains are mixed and dried in a gas-fired rotary dryer. The
DDG leaving the dryer contains 9% moisture by weight. The process is designed to be
essentially zero-discharge. Makeup water is added only for the cooling tower and the CO
2
scrubber, and no wastewater is produced.
8
III.2 Lignocellulose Feedstock-to-Ethanol Process Description
The process used in this analysis can be briefly described as using co-current dilute acid
prehydrolysis of the lignocellulosic biomass with simultaneous enzymatic
saccharification of the remaining cellulose and co-fermentation of the resulting glucose
and xylose to ethanol. In addition to these unit operations, the process involves feedstock
handling and storage, product purification, wastewater treatment, enzyme production,
lignin combustion, product storage, and other utilities. In all, the process is divided into
nine areas (see Figure 2). Details of the process can be found in the NREL design report
for the dilute acid prehydrolysis and enzymatic hydrolysis process.
16
Figure 2. Lignocellulose-to-ethanol process flow
The feedstock, in this case corn stover, is delivered to the feed handling (A100) area for
storage and size reduction. From there, the biomass is conveyed to pretreatment and
conditioning (A200). In this area, the biomass is treated with dilute sulfuric acid at a high
temperature for a very short time, liberating the hemicellulose sugars and other
compounds. Ion exchange and overliming is required to remove compounds liberated in
the pretreatment that will be toxic to the fermenting organism. Only the liquid portion of
the hydrolysis stream is conditioned.
After pretreatment, a portion of the hydrolyzate slurry is split off to enzyme production
(A400). In enzyme production, seed inoculum is grown in a series of progressively larger
aerobic batch fermentors. The inoculum is then combined with additional hydrolyzate
9
slurry and nutrients in aerobic fermentors to produce the enzyme needed for
saccharification.
Simultaneous saccharification and co-fermentation, or SSCF, (A300) of the hydrolyzate
slurry is carried out in a series of continuous anaerobic fermentation trains. The
recombinant fermenting organism Zymomonas mobilis is grown in progressively larger
batch anaerobic fermentations. This inoculum, along with cellulase enzyme from
enzyme production (A400) and other nutrients, is added to the first fermentor. After
several days of saccharification and fermentation, most of the cellulose and xylose will
have been converted to ethanol. The resulting beer with 4-5% by weight ethanol is sent
to product recovery.
Product recovery (A500) consists of a beer column to distill the ethanol from the majority
of the water and residual solids. The vapor exiting the beer column is 35% by weight
ethanol and feeds the rectification column. A mixture of nearly azeotropic (92.5%)
ethanol and water from the rectification column is purified to pure (99.5%) ethanol using
vapor-phase molecular sieves. The beer column bottoms are sent to the first effect of a
three-effect evaporator. The rectification column reflux condenser provides heat for this
first effect. After the first effect, solids are separated using a centrifuge and dried in a
rotary dryer. A portion (25%) of the centrifuge effluent is recycled to fermentation and
the rest is sent to the second and third evaporator effects. Most of the evaporator
condensate is returned to the process as fairly clean condensate (a small portion, 10%, is
split off to waste water treatment to prevent build-up of low-boiling compounds) and the
concentrated syrup contains 15%-20% by weight total solids.
Biogas (containing 50% methane, and with a heating value of approximately 12,000
British thermal units, or Btu, per pound) is produced by anaerobic digestion of organic
compounds in wastewater treatment. The treated water is considered suitable for
recycling and is returned to the process, so there is no water discharge from the process.
The solids from distillation, the concentrated syrup from the evaporator, and biogas from
anaerobic digestion are combusted in a fluidized bed combustor, or FBC, (A800) to
produce steam for process heat. Soluble components in the wet boiler feed are combusted
and some water vapor exits through the stack. The majority of the steam demand is for
the pretreatment and distillation areas. Generally, the process produces excess steam that
is converted to electricity for use in the plant; any excess electricity is sold to the local
power grid.
III.3 Primary Process Differences
There are some major differences in the processing of corn starch versus stover. Stover
requires more feed handling; it is envisioned that stover will be delivered in bales that
must be washed, shredded, and then milled to achieve a particle size that can be conveyed
to the process. Corn requires milling to a fine meal. The steps to reduce the
carbohydrate polymers in stover to simple sugar monomers take considerably longer and
are more energy intensive than for the starch in corn. The cellulose requires pretreatment
10
approaching 180°-200°C (356°-392°F) with dilute acid to make the cellulose digestible
by cellulase enzyme versus 80°-90°C (176°-194°F) for cooking the corn starch. After
pretreatment, the cellulase enzyme and fermentation organism require about 7 days for
conversion to ethanol, compared to 2 days for starch. The longer residence time
increases the chance for contamination during SSCF. The resultant beer is more dilute,
and the mixing power requirements are higher due to a higher solids content. Starch is
converted using two main enzymes, alpha-amylase and gluco-amylase. These enzymes
have improved over the years, and now convert essentially 100% of the starch to glucose,
provided that the corn is finely ground and properly cooked.
The residual solids from each process have value as a by-product. The DDG is high in
protein and is sold for animal feed. The lignocellulosic residue has no food value but has
a high energy value and can be used for fuel. Table 2 shows the composition of the DDG
and lignocellulosic residue and their relative amounts for a 25 million annual gallon fuel
ethanol plant. The lignocellulosic residue composition is determined in the process
model. It should be noted that ethanol and possibly electricity are the only products of
the lignocellulose plant considered here. Certainly, smaller-volume niche products will
emerge - products that can also be produced from the lignocellulose-derived sugars and
that will have a significantly higher profit margin. This is also true for the starch process;
higher value co-products such as zein proteins and corn fiber-based products are under
study by the USDA. When these other products and their selling prices are figured into
the analysis, the cost of fuel ethanol will decrease, just as the cost of gasoline is lowered
by the sale of other petroleum products of crude oil.
Table 2. DDG and Lignocellulosic Residue Composition and Production
DDG
17
% As-is Basis Lignocellulosic Residue % As-is Basis
Neutral Detergent Fiber 44.0 Cellulose 4.6
Protein 27.0 Hemicellulose 3.6
Fat 9.0 Lignin 12.3
Ash 5.0 Protein 1.7
Other (glycerol, other organics) 6.0 Other Organics 14.7
Moisture 9.0 Ash 4.5
Total 100.0 Moisture 58.6
Total 100.0
Tons per day at 9% moisture 243.6 Tons per day at 58% moisture 1481
Pounds per gallon fuel ethanol 6.4 Pounds per gallon fuel ethanol 39.1
IV Normalization of Design and Economic Models
A large part of this joint effort was to put the two models, developed separately, on
common design and costing bases. While not a trivial effort, it was encouraging to find
that much of the design assumptions and costing methodologies were, though not
identical, definitely comparable. In 1999, NREL completed a comprehensive review of
its design and costing with Delta-T Corporation, which designs, constructs, and operates
corn ethanol plants.
15
The majority of the costs used in the USDA process model were
also from Delta T. USDA and NREL staff evaluated the physical properties, equipment
specifications and costs, and operating costs. When necessary, modifications to one or
11
both models were discussed and agreed upon. It was agreed that some differences would
remain, particularly in modeling the utilities, to aid in combining the two models later.
Both the USDA and NREL use ASPEN Plus™,
18
a chemical engineering simulation
software package to model the mass and energy balances for both of the ethanol
processes, and Microsoft Excel™ for creating costing and economic analysis models. In
order to make the comparison, both portions of the models had to be aligned. This
alignment ensured that the models used similar assumptions and rigor in both process and
economic calculations. By-products of this alignment were simplified ASPEN Plus and
Excel versions of the NREL lignocellulose process model that were less complex and
more user friendly. This simpler model provides the same results as the more rigorous
version.
IV.1 History of the Models
IV.1.1 Starch Model
A process and economic model of a dry milling ethanol facility was developed several
years ago by the USDA-ARS to assist researchers in reducing the cost of ethanol from
corn. This model, incorporated in commercial process simulation software, ASPEN Plus,
was based on data from ethanol producers, engineering firms, equipment manufacturers,
and a USDA-sponsored study.
19
This model includes process flows, details of the capital
and operating costs of the equipment, raw materials, utilities, and the co-products
involved in ethanol production. This model has served as a base case to evaluate the cost
advantages of various process alternatives such as continuous high-gravity fermentation
with stripping.
20
IV.1.2 Lignocellulose Model
A process and economic model of the conceptual lignocellulose-to-ethanol process was
initially developed by NREL in 1995. A database of physical properties for the
components of lignocellulosic feedstocks was developed.
21
The rigorous ASPEN Plus
model was developed to help the DOE Biofuels program direct research in the
development of ethanol from lignocellulosic feedstocks in two ways. Modeling the
process and its economics provides an objective way to evaluate research ideas and
results, and it also provides DOE with process economic details about the lignocellulose
process. The model has been refined each year by NREL engineers with data obtained
through formal subcontracts with engineering construction firms and vendors, and
informal contact with the corn ethanol industry, culminating in the design report,
published in 1999.
16
The methodology for design and costing of the lignocellulose-to-
ethanol process is outlined in this report and the process design and model described was
the starting point for the creation of the simplified model used for this project.
Assumptions about yields, operating conditions and other process design parameters for
this study were taken from the Best of Industry case in the above referenced report.
12
IV.2 Methodology for Achieving the Same Basis
Because the primary goal of this work was to compare the two processes’ economics, it
was necessary to align model methodology. This included normalizing inputs to the
ASPEN Plus model and the economic spreadsheet. In ASPEN Plus, the components, unit
operations, physical properties and model rigor, and complexity were compared. The
NREL model was simplified to make its evaluation easier. In the Excel spreadsheet, the
costing methods and cost scaling methods were aligned. The Excel workbooks were
made more user-friendly with simple variables like plant life, cost year basis, and
feedstock cost inputs that can be changed by the Excel user. The power consumption
calculations in both models were moved to Excel to make them more accessible to the
user, both for review and for changing the inputs, such as when calculating power usage
for mixing.
IV.2.1 General Economic Parameters
The plant size was set at 25 million annual gallons of fuel ethanol (consisting of 95% by
volume ethanol and 5% by volume gasoline denaturant) and the online time was set at
330 days per year for each process.
19
The year 1999 was chosen as the basis for costs.
Indices from the Bureau of Labor,
22
Stanford Research Institute,
23
and the Chemical
Engineering Plant Cost Index
24
were used to ratio the labor, chemical, and equipment
costs, respectively, from their reference year to 1999. Table 3 outlines the overall
parameters that were used in each model. For the analysis done here, the annual
production cost, in dollars per gallon of fuel ethanol, is the final comparison tool. The
annual production cost includes equipment straight-line depreciation for the life of the
plant, and variable costs, labor, supplies and overhead, minus any by-product credits. The
market selling price minus the annual production cost is the before-tax profit.
Table 3. General Parameters
Starch Process Lignocellulose Process
Process Dry mill
Dilute Acid/Enzymatic
Hydrolysis
Feedstock corn corn stover
Plant Feed rate (dry ton/day) 633 1050
Plant Type stand alone
Location undetermined
Annual Fuel Ethanol Production (MM gal)
a
25
On-stream Days 330
Year for cost basis 1999
a
million gallons
IV.2.2 Capital Costs
Equipment costs were obtained from vendor quotations whenever possible, especially for
uncommon equipment such as pretreatment reactors or ion exchange equipment, or when
13
a complete vendor package could be specified, such as the molecular sieve system.
These costs reflect the base size for which the equipment was designed. If process
changes were made and the equipment size changed, the equipment was not generally re-
costed in detail. Using the following exponential scaling expression, the cost was
determined by scaling based on the new size or some other characteristic related to the
size. Both process models used this ratio method.
exp
*
*
÷
÷
ø
ö
ç
ç
è
æ
=
SizeOriginal
SizeNew
CostOriginalCostNew
* or characteristic linearly related to the size
The USDA value of 0.6 for the scaling exponent was selected for this joint effort, which
compared to NREL’s average value of 0.63. A range of 0.6 to 0.7 is commonly cited in
cost estimation literature.
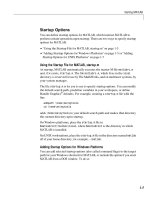
25
The size and purchased equipment costs for tanks, heat exchangers, and columns for each
process were compared to determine if similar costs were emerging from the different
costing methods, which included Richardson Estimating Standards,
26
vendors, and cost
estimating software such as Icarus Questimate™
27
and Chemcost™.
28
Selected results
are shown in Figure 3 and Figure 4. In general, there was good correlation in the costs
between the two models. The tank costs varied the most, due to the different kinds of
tanks used in both processes.
The USDA’s experience in the corn industry showed that a factor of 3.0 was reasonable
for going from purchased equipment costs to total project investment, while NREL’s
installation costing method produced a factor of 2.5, so 2.75 was used for both processes.
Figure 3. Comparison of starch and lignocellulose process stainless steel tank cost
y = 27.153x
0.2497
R
2
= 0.6326
y = 7.1543x
0.4934
R
2
= 0.9827
$1
$10
$100
$1,000
0.1 1 10 100 1000 10000
Tank Volume (1000L)
SS Tank Cost (M$)
NREL USDA NREL USDA
14
Figure 4. Comparison of starch and lignocellulose process heat exchanger cost
IV.2.3 Variable Operating Costs
Variable operating costs, such as chemical costs used in both processes, were generally
taken from the Chemical Marketing Reporter. Denaturant cost came from DOE’s Energy
Information Administration.
29
Chemicals particular to each process, such as enzymes for
the starch process or wastewater treatment chemicals, were not changed. Feedstock costs
were $1.94 per bushel for corn, and $35 per dry ton for stover. Electricity was assumed
to have the same cost and credit, $0.04 per kilowatt-hour (kWh). The starch process
purchases electricity, while the stover process produces excess, which is considered a
saleable by-product.
IV.2.4 Labor, Supplies, and Overhead
Labor, supplies, and overhead (sometimes termed fixed operating costs) were normalized
based on several references, including recent subcontract work through DOE, “Building a
Bridge to the Corn Ethanol Industry.”
1,2,3
Most notably, two separate engineering firms
suggested a ratio of one maintenance person for every two to three operators. Operating
and maintenance supplies, overhead and taxes, and insurance were calculated based on
literature references.
30,31,32
No state or federal tax credits, nor small producer credits or
incentives were assumed for either process.
y = 0.3781x
0.6368
R
2
= 0.979
y = 0.671x
0.5782
R
2
= 0.9072
0
20
40
60
80
100
120
140
160
180
0 2000 4000 6000 8000 10000 12000 14000
Heat Transfer Area (sq.ft.)
Heat Exchanger Cost (M$)
NREL USDA NREL USDA
15
V Changes Required in the Process Models
USDA-ARS or NREL staff made specific changes to the corn starch or lignocellulose
model, respectively. Joint review of the models allowed the participants to provide input
to both models, which resulted in a better understanding for all involved and models that
were easy to use and understand.
V.1 Starch Model
V.1.1 Changes Made to the Starch Model and Other Work
1) Production capacity was normalized at 25 million annual gallons of fuel ethanol. The
original USDA model addressed a facility with a production capacity of 15 million
annual gallons.
2) The costs of raw material and chemicals, where applicable, were put on the same
basis for both facilities. Yeast, urea, and enzymes are examples of purchased raw
materials unique to the starch process.
3) Plant labor charges were examined for both facilities and placed on a consistent basis.
The corn starch-to-ethanol facility has five operators and two maintenance personnel
per shift.
4) The cost for the steam generation equipment and the cooling towers were removed
from the capital cost portion of the estimate to accommodate future integration of the
utilities between the lignocellulose-to-ethanol facility and the corn starch-to-ethanol
facility. These utilities were treated as purchased items and their cost included in the
utility cost section of the operating costs. The steam cost was based on the capital
and operating costs of a gas-fired boiler, which includes natural gas cost.
5) The calculations to determine the operating and capital costs of the corn starch-to-
ethanol facility were removed from the ASPEN Plus simulation program and placed
in an Excel spreadsheet.
V.2 Lignocellulose Model
V.2.1 Lignocellulose Model Changes and Other Work
1) Production capacity was normalized at 25 million annual gallons of fuel ethanol. The
original NREL model addressed a facility with a production capacity of 56 million
annual gallons.
2) The simplified ASPEN Plus model has 40% fewer model components (unit
operations, process streams, or control blocks) than the original model. The overall
model is thermodynamically rigorous and uses built-in physical properties as well as
properties developed at NREL. The individual unit models are thermodynamically
16
consistent and can be either rigorous (for example, the simulation of the distillation)
or simple.
3) The physical properties for the lignocellulosic components were added to the model’s
input language to eliminate the need to access the NREL in-house database with the
model.
4) Two major sections were removed from the ASPEN Plus model, wastewater
treatment and steam/electricity generation, in anticipation of combining the two
models in a co-location scenario. The wastewater treatment section of the model was
reduced to an expression that calculates the capital and operating costs and power
requirements of the system based on the hydraulic flow and the chemical oxygen
demand (COD) of the incoming waste water. Similarly, the fluidized bed combuster
and turbogenerator system was replaced with several Fortran expressions to calculate
the costs and net power generation from the burner feed streams.
5) The original NREL model linked the Excel spreadsheet with a database containing
the base costs and scaling factors for equipment and chemical costs. For this project,
the spreadsheet was loaded with data, but not linked to the database.
6) The original NREL model used installation factors unique to equipment types,
obtained from literature or vendors, then applied other projects costs (contingency,
contractor expenses) to determine a total plant investment cost. The average
installation factor was 1.4, and the combined other project costs resulted in an
additional factor of 1.76. Combining these two factors resulted in one overall factor
of 2.5 that can be applied to the purchased equipment cost to obtain the total project
cost. The factor agreed upon, 2.75, was an average of this value and the USDA value
of 3.
7) Estimated labor charges for the stover plant were evaluated against the estimated
labor charges for the dry mill. Because the stover process is considered more
complex and the feed handling more labor intensive, more operators are needed, as
well as more mechanics. The lignocellulose-to-ethanol facility has more processing
steps than the corn starch-to-ethanol facility, and costs include ten operators and four
maintenance personnel per shift.
8) The total project cost, along with the plant operating expenses was used in the
original NREL model in a discounted cash flow analysis to determine the cost of
ethanol production, using a set discount rate. The simplified NREL model matched
the more rigorous original model within $0.02 per gallon production cost using the
same discounted cash flow rate of return (DCFROR) method for both. The economic
analysis was changed to annual production cost from DCFROR method to place it on
the same basis as the corn starch model. This removes the working capital, loan
assumptions, and discount rate in the original NREL methodology.
17
VI Production Costs of Fuel Ethanol
The resulting costs of producing 25 million annual gallons of fuel ethanol from each
process were determined from the normalized models. Figure 5 shows the production
cost breakdown for each process. Detailed cost information for each process can be
found in the Appendix.
Figure 5. Production costs in dollars per gallon of fuel ethanol (1999$)
-$0.30
-$0.10
$0.10
$0.30
$0.50
$0.70
$0.90
$1.10
$1.30
$1.50
$1.70
STARCH* CELLULOSE
Fuel Ethanol Cost ($/gal)
Feedstock Variable Operating Costs
Labor, Supplies, and Overhead Depreciation of Capital
Co-products Total
*Dry Milling Process