Tài liệu Báo cáo Y học: EPR characterization of the mononuclear Cu-containing Aspergillus japonicus quercetin 2,3-dioxygenase reveals dramatic changes upon anaerobic binding of substrates potx
Bạn đang xem bản rút gọn của tài liệu. Xem và tải ngay bản đầy đủ của tài liệu tại đây (341.67 KB, 9 trang )
EPR characterization of the mononuclear Cu-containing
Aspergillus
japonicus
quercetin 2,3-dioxygenase reveals dramatic changes upon
anaerobic binding of substrates
Ingeborg M. Kooter
1,
*
,
†, Roberto A. Steiner
2,
†, Bauke W. Dijkstra
2
, Paula I. van Noort
1
,
Maarten R. Egmond
1
and Martina Huber
3
1
Unilever Research Vlaardingen, the Netherlands;
2
University of Groningen, Laboratory of Biophysical Chemistry,
Groningen, the Netherlands;
3
Department of Molecular Physics, Leiden University, the Netherlands
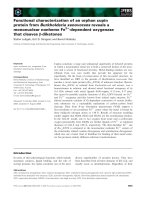
Quercetin 2,3-dioxygenase (2,3QD) is a copper-containing
dioxygenase that catalyses the oxidation of the flavonol
quercetin to 2-protocatechuoylphloroglucinol carboxylic
acid with concomitant production of carbon monoxide. In
contrast to iron dioxygenases, very little is known about
copper dioxygenases. We have characterized 2,3QD from
the fungus Aspergillus japonicus by electron paramagnetic
resonance spectroscopy (EPR). At pH 6.0, 2,3QD shows a
mixture of two EPR species. The major form has parameters
typical of type 2 Cu sites (g
//
¼ 2.330, A
//
¼ 13.7 mT), the
minor one has a more distorted geometry (g
//
¼ 2.290,
A
//
¼ 12.5 mT). Anaerobic addition of the substrate
quercetin results in a different, single species EPR spectrum
with g
//
¼ 2.336, A
//
¼ 11.4 mT, parameters, which are
in-between those of the type 2 and type 1 Cu sites in the
Peisach–Blumberg (g
//
vs. A
//
) plot. After turnover, a new
EPR signal is observed, which is ascribed to the carboxylic
acid ester product complex. This spectrum is similar to that
of the native enzyme at pH 10.0 and has g-tensor parameters
suggesting a trigonal bipyramidal site. Of a variety of
flavonoids studied, only flavonols are able to bind to the
copper centre of 2,3QD. Nine flavonols with different
hydroxylation patterns at the A- and B-ring have been
analysed. They cluster in two different regions of the Peis-
ach–Blumberg plot and show that the presence of a 5-OH
group has a large effect on the A
//
parameter. Several
differences are noted between A. japonicus 2,3QD and the
enzyme from A. niger German Collection of Micro-
organisms 821.
Keywords: electron paramagnetic resonance; dioxygenase;
quercetin; copper.
Dioxygenases are enzymes that use molecular oxygen to
oxidize their substrates by incorporating both oxygen atoms
into the reaction product. These enzymes play an important
role in the biosynthesis and catabolism of various types of
metabolites and in several detoxification mechanisms [1].
Dioxygenases are mostly metalloproteins [2]. Nonhaem iron
is the prosthetic group commonly employed, and iron-
containing dioxygenases have been widely studied [3,4]. In
contrast, less information is available on copper-containing
dioxygenases.
In 1971, it was reported that quercetin 2,3-dioxygenase
(2,3QD) from Aspergillus flavus is a 111-kDa organic
cofactor devoid copper-dependent dioxygenase containing
two moles of copper per mole of enzyme [5]. The enzyme is
heavily glycosylated (27.5%, w/w). Under aerobic condi-
tions it catalyses the conversion of the flavonoid quercetin
(3¢,4¢,5,7-tetrahydroxyflavonol) to the corresponding dep-
side (phenolic ester 2-protocatechuoylphloroglucinol carb-
oxylic acid) and carbon monoxide (Fig. 1) [6]. This reaction
is rather unusual in that it involves the cleavage of two
carbon–carbon bonds and the concomitant production of
carbon monoxide. The stoichiometry of the process is such
that 2 mol of substrate are converted per mol of enzyme,
that is, 1 mol of substrate per mol of copper, consistent with
the later finding of a homo-dimeric protein.
Recently, 2,3QD from Aspergillus niger German Collec-
tion of Microorganisms 821 has been reported as a 148-kDa
glycoprotein (sugar content 46–54%, w/w) containing
1.0–1.6 mol of Cu [7] per mol of protein. The enzyme is
composed of three different subunits with molecular masses
of 63–67, 53–57, and 31–35 kDa, respectively, organized in
a 1 : 1 : 1 quaternary structure. Aspergillus niger DSM 821
has been characterized by EPR spectroscopy. It shows
parameters of a nonblue type 2 Cu
2+
protein (g
//
¼ 2.293
and A
//
¼ 15.5 mT). A resolved multiline pattern of at least
nine resonances in the perpendicular region has been
tentatively assigned to an interaction of the copper ion with
four nitrogen ligands in a distorted square-planar geometry.
Addition of the substrate quercetin under anaerobic
Correspondence to M. Huber, Department of Molecular Physics,
Leiden University, PO Box 9504, 2300 RA Leiden, the Netherlands.
Fax: + 31 71 5275819, Tel.: + 31 71 5275560,
E-mail:
Abbreviations: 2,3QD, quercetin 2,3-dioxygenase (alternative names
for this enzyme are quercetinase and flavonol 2,4-dioxygenase);
DEAE, diethylaminoethyl; DPPH, aa¢-diphenyl-b-picrylhydrazil;
DSM, German collection of microorganisms; EPR, electron para-
magnetic resonance.
Enzymes: quercetin 2,3-dioxygenase, quercetin:oxygen 2,3-oxido-
reductase (decyclizing) (EC 1.13.11.24).
*Present address:RIVM,POBox1,3720BABilthoven,
the Netherlands.
Note: these authors contributed equally to the work presented in this
article.
(Received 3 December 2001, revised 4 April 2002,
accepted 2 May 2002)
Eur. J. Biochem. 269, 2971–2979 (2002) Ó FEBS 2002 doi:10.1046/j.1432-1033.2002.02973.x
conditions in a threefold molar excess did not yield any
spectral effects, leaving the native spectrum unaltered.
The first direct structural information on a 2,3QD
enzyme became available only recently [8]. The crystal
structure of 2,3QD from Aspergillus japonicus (hereafter,
unless explicitly stated, 2,3QD will indicate the enzyme from
this source) solved at pH 5.2 and 1.6 A
˚
resolution shows
that the enzyme is a glycoprotein homodimer (sugar content
% 25.0%, w/w) of about 100 kDa containing one atom of
copper per monomer (350 amino acids). The crystallo-
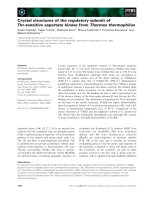
graphic analysis reveals that the copper centre of 2,3QD has
two alternative conformations (Fig. 2). The main form
(% 70% of the total) is pseudo-tetrahedral and derives from
the ligation of three histidine residues (His66, His68 and
His112) and a water molecule (Wat1 in Fig. 2). The minor
coordination form (% 30%) has a mixed trigonal bipyram-
idal/square pyramidal geometry where the copper is
coordinated by the same three histidine residues, a water
molecule (Wat2 in Fig. 2) and the Glu73 side chain. The
latter residue coordinates the metal only in its minor
conformation. In its principal conformation the carboxylate
side chain of Glu73 points away from the metal centre.
Though precise mechanistic information on 2,3QD-
mediated dioxygenation of flavonols is lacking, the early
biochemical study on A. flavus 2,3QD and primarily several
bio-mimetic studies [9–13] have suggested the general
features of a possible mechanism for the enzymatic reaction
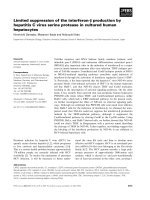
(Fig. 3). The first step is believed to be the binding of the
flavonol substrate to the copper ion (structure 2 in Fig. 3).
Subsequently, an activated complex (3)isassumedtobe
attacked either at C2 or at the Cu
+
ion by the dioxygen
molecule. The oxygenated complexes (not shown) would
then form through different routes, and the endoperoxide
(4) decomposes to release the products (5) and regenerate
the native enzyme (1). This mechanism is based on that of
intradiol dioxygenases, which utilize high-spin Fe(III) in
place of copper [3].
Here, we report EPR studies of 2,3QD that characterize
the native enzyme, the anaerobic complexes with nine
different flavonol substrates, and the depside bound enzyme
forms. Our study offers the first EPR description of
important catalytic states of the dioxygenation process of
flavonols and shows that the anaerobic binding of flavonols
produces clear changes in the electronic distribution at the
copper centre.
EXPERIMENTAL PROCEDURES
Cloning of 2,3QD
Aspergillus japonicus IFO-4408 was grown in media con-
taining 6 gÆL
)1
NaNO
3
,2gÆL
)1
KH
2
PO
4
,5gÆL
)1
fructose,
1gÆL
)1
MgSO
4
Æ7H
2
O, Egli trace elements (per L: 0.6 g
EDTAÆ2H
2
O, 0.11 g CaCl
2
Æ2H
2
O, 75 mg FeSO
4
Æ7H
2
O,
28 mg MnSO
4
ÆH
2
O, 27 mg ZnSO
4
Æ7H
2
O, 8 mg CuSO
4
Æ
5H
2
O, 9 mg CoCl
2
Æ6H
2
O, 5 mg Na
2
MoO
4
Æ2H
2
O, 8 mg
H
3
BO
3
, 5 mg KI, pH 4.0 with NaOH), 0.1–0.5% yeast
extract and quercetin (10 gÆL
)1
). 2,3QD was purified from
the culture broth (100-L fermentation, 0.4 mgÆL
)1
)andthe
N-terminal amino-acid sequence was determined and used
to synthesize two degenerate primers (5¢-CKIGCRTGIS
WRTARTG-3¢)and(5)GAYACIWSIWSIYTIATYGTI
GARGAYGCICC-3¢). A PCR reaction on A. japonicus
genomic DNA with the primers resulted in a 77-bp fragment
encoding the N-terminal end of the enzyme. This PCR
fragment was used in a colony hybridization on a
A. japonicus genomic library in pBluescript. A hybridizing
colony was identified, cultivated and plasmid DNA was
isolated. Sequence analyses showed that the sequence is
1200-bp long, encoding a protein of 379 amino acids with
one intron of 63 base-pairs; this was confirmed by PCR on
cDNA and subsequent sequence analysis of the cloned
fragment. 2,3QD is most likely synthesized as a prepro-
enzyme, containing a putative presequence of 18 amino
acids (according to the predictions by Von Heijne [14,15]),
and a pro-sequence of 10 amino acids, followed by a mature
protein of 351 amino acids.
Production of 2,3QD
For the production and secretion of 2,3QD by the mould
Aspergillus awamori, the complete 2,3QD encoding
Fig. 1. Reaction catalyzed by 2,3QD.
Fig. 3. Schematic representation of a possible mechanism of 2,3QD-
mediated dioxygenation of flavonols. Adapted from [9].
Fig. 2. Copper coordination geometries in 2,3QD. (A) Experimental
2F
o
–F
c
map contoured at the 1.0 r (blue) and 2.5 r (green, only for
Glu73 and the solvent molecule) levels. (B) Major distorted tetrahedral
coordination. (C) Minor trigonal bipyramidal coordination with a
strong square pyramidal component. In (B) and (C) the coordination
distances are reported in A
˚
. This figure was generated with the
programs
BOBSCRIPT
[26] and
RASTER
3
D
[27].
2972 I. M. Kooter et al. (Eur. J. Biochem. 269) Ó FEBS 2002
sequence (including signal-sequence) was cloned between
the endoxylanase promoter and transcription terminator in
the Aspergillus expression vector pAW14B-12, resulting
in the plasmid pUR7857. Strain Aspergillus awamori was
cotransformedwitha5.7-kbSalI fragment from pUR7857
(containing an exact fusion between 2,3QD and the
Aspergillus awamori endoxylanase promoter and transcrip-
tion terminator) and a 2.4-kb BamHI–HindIII fragment
from pAW4-1 containing the A. awamori pyrG gene as
selection marker. Transformants were screened for extra-
cellular production of 2,3QD in a plate-screening assay.
Plates containing 6 gÆL
)1
NaNO
3
,2gÆL
)1
KH
2
PO
4
,1gÆL
)1
MgSO
4
Æ7H
2
O, Egli trace elements, 0.5% yeast extract, 1%
D
-xylose, 1.5% agar and 1% quercetin were inoculated with
spores obtained from the transformants and incubated at
30 °C. Transformants that produced a halo i.e. a clear zone
of bleached quercetin were purified twice and finally spores
were isolated on potato dextrose agar (Oxoid) plates.
Cultivation of a recombinant Aspergillus awamori strain in a
fermenter resulted in 2,3QD levels of % 0.3 gÆL
)1
.
Purification of 2,3QD
The recombinant 2,3QD was purified from the culture broth
as follows. The first step involved a 60% ammonium sulfate
precipitation, after which the solution was centrifuged for
30 min at 25 000 g. The soluble fraction was then dialysed
against 50 m
M
Mes pH 6.0 and loaded on a DEAE–
Sepharose fast flow column (Pharmacia), and eluted at
300 m
M
NaCl. After concentration the enzyme was loaded
on a Superdex 200 gel filtration column and eluted with
50 m
M
Mes pH 6.0 and 100 m
M
NaCl. The enzyme activity
was measured as described previously by Oka et al. [16].
One unit was defined as the amount of enzyme that converts
1 lmol of quercetin per min at 25 °C. The standard assay
(1 mL) contained 50 m
M
Mes buffer pH 6.0, 20 lLof
3m
M
quercetin (dissolved in dimethylsulfoxide) and 10 lL
enzyme solution. The specific activity of the final purified
preparation was typically 90 UÆmg
)1
. The Cu content of the
enzyme is 0.8 molÆ(mol protein)
)1
(per monomer), as
determined by atomic absorption spectroscopy. The analy-
sis was performed by plasma emission spectrometry using a
PerkinElmerModelsPlasma1000.
EPR measurements
X-Band EPR measurements were performed with a Bruker
ECS 106 EPR spectrometer. Samples were placed into
quartz tubes and frozen in liquid nitrogen. Spectra were
acquired with EPR tubes in a liquid nitrogen-containing
finger dewar (at 77 K) using a power of 2 mW. In general,
the spectra were obtained as 3-min scans from 210 to
410 mT using a time constant of 0.3 s, a modulation
amplitude of 1.27 mT, and a field modulation frequency of
50 kHz. Measurements were generally carried out at pH 6.0
in 50 m
M
Mes buffer. This pH value was chosen because it
is close to the pH of maximum enzymatic activity (pH 6.2,
M. van der Heiden, unpublished results) and matches the
conditions generally employed in the enzymatic activity
assay [7,16]. The measurement at pH 10.0 was carried out in
an universal buffer system containing 25 m
M
citric acid,
25 m
M
potassium dihydrogen phosphate, 25 m
M
boric acid,
25 m
M
tricine adjusted to the desired pH value with NaOH.
Anaerobic measurements were performed on samples
prepared using an in-house built argon-vacuum flush
system.
The flavonoids (quercetin, kaempferol, myricetin, morin,
datiscetin, galangin, 3OH-flavone, 3,7(OH)
2
-flavone, fisetin)
were obtained from Fluka, Sigma, Aldrich or Roth and
dissolved in dimethylsulfoxide. Diethyldithiocarbamate
(DDC) was dissolved in water prior to its use.
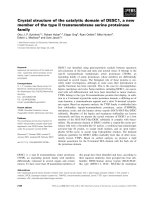
Determination of EPR parameters
For all species, EPR parameters were read directly from the
line positions as shown in Fig. 4A. For selected spectra,
simulations with the program
SIMFONIA
(Bruker Analy-
tische Messtechnik GmbH) were performed. Uncertainties
of the EPR parameters obtained by simulation were
estimated according to the sensitivity of the spectra to the
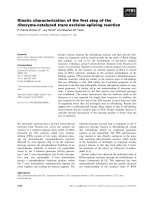
Fig. 4. EPR spectra of 2,3QD. (A) 2,3QD in 50 m
M
Mes buffer,
pH 6.0; (B) 2,3QD in universal buffer, pH 10.0 (C) 2,3QD sample of
spectrum (B), after the pH has been brought back to pH 6.0; (D)
DDC-inhibited 2,3QD in 50 m
M
Mesbuffer,pH6.0.In(A),the
positions of the lines used to read off the EPR parameters of the major
and the minor species are shown. Dotted line (B) Simulation of EPR
spectrum at pH 10.0; parameters, see text. Simulation did not take into
account a possible variation of the line widths of lines belonging to
different nuclear magnetic quantum numbers (m
I
), which explains part
of the differences between the experimental and simulated spectra.
Ó FEBS 2002 EPR study of A. japonicus 2,3QD (Eur. J. Biochem. 269) 2973
respective parameter. No calibration of absolute g values
was performed, but an estimate of the absolute error in
g values was obtained from comparing the g values of
DPPH measured on separate occasions, which were
between 2.0053 and 2.0063 [Lit: 2.0037(2)] [17]. This
suggests that the absolute g values have an error of
± 0.0013, which is negligible in the present context.
RESULTS AND DISCUSSION
Native 2,3QD at pH 6.0 and pH 10.0
The EPR spectrum of native 2,3QD at pH 6.0 is presented
in Fig. 4A. The spectrum clearly indicates that the purified
enzyme contains two different EPR species, a major and a
minor one. The EPR parameters are g
//
and A
//
values of
2.330 and 13.7 mT, and 2.290 and 12.5 mT for the major
and minor form, respectively. The locations of both forms
(yellow circles) in the Peisach–Blumberg plot [18] are shown
in Fig. 5. Whereas the major form possesses EPR param-
eters close to those of a type 2 Cu site, that is, relatively large
g
//
and A
//
values, and a g-tensor of nearly axial symmetry,
with g
//
> g
^
, the minor form has a smaller A
//
value
indicating a more distorted site [19]. Increasing the pH from
6.0 to 10.0 changes the spectrum to that of a single EPR
species (Fig. 4B), with g
//
¼ 2.289 and A
//
¼ 11.7 mT
(magenta circle in Fig. 5). This change is fully reversible
since lowering the pH again to 6.0 results in the original
spectrum (Fig. 4C). As the spectral line-shape of the
spectrum at pH 10 differs significantly from that expected
for a typical type 2 copper site a simulation was performed.
The simulation of the EPR spectrum of 2,3QD at
pH 10.0 is shown in Fig. 4. The simulation parameters
are g
zz
¼ 2.289(4), g
yy
¼ 2.178(5), g
xx
¼ 2.011(3), A
zz
¼
12.0(2) mT, and A
xx
, A
yy
¼ 6.0(3) mT, where g
zz
and
A
zz
correspond to the observed g
//
and A
//
values, respect-
ively. The parameters read off from the spectrum are thus in
good agreement with the results of the simulation.
Remarkable are the large hyperfine couplings A
xx
and
A
yy
, and the ordering of the g values, both of which differ
from those expected for type 2 copper sites. For example,
the g
zz
and g
yy
values are much closer to each other,
indicating a substantial perturbation of the axial symmetry
of the tensor, whereas axial symmetry, i.e. g
xx
% g
yy
<< g
zz
is typically found for type 2 sites. The grouping of the
g-values and the line-shape of the spectrum at pH 10.0 are
similar to those reported for Cu
2+
in model complexes [20–
22], where they are attributed to trigonal bipyramidal
species.
The simulated EPR spectrum at pH 10.0 has character-
istics that are close to the resolved features of the minor
species in the native enzyme spectra at pH 6.0. The
difference in A
//
values of 6% can be attributed to
uncertainties in determining the line-position of the minor
species at pH 6.0, caused by the superposition of spectra at
this pH value. Comparison of the high-field region, where
absorptions due to g
xx
and g
yy
occur, is hampered by the
spectral overlap with the major species in this region, but
overall, the similarity of the line-shape and of g
//
and A
//
suggests that the minor pH 6.0 species is similar, if not
identical, to the high pH form. Assuming that the remaining
EPR parameters of the minor species, in particular the g-
tensor components, are similar to those of the species
observed at pH 10, the minor species would have a lower
symmetry than the major species, and EPR parameters
suggestive of a trigonal bipyramidal geometry [20–22].
To correlate the EPR results to the two crystallograph-
ically observed forms is difficult, as the two coordinations
are too irregular to be mapped onto the geometries of model
complexes, which presently provide the only way in which
structural aspects can be derived from EPR parameters. A
possible interpretation would be to identify the major
crystallographic coordination with the (according to the
g-tensor parameters) more (axially) symmetric major EPR
species and the minor coordination to the more distorted,
possibly trigonal bipyramidal, minor EPR species.
Although in this interpretation, the relative intensities of
thetwoformsintheX-raystructureandtheEPRspectra
agree, we are aware that a number of factors may influence
these ratios: differences in pH and physical state between the
EPR and crystallographic samples, presence of additives in
the crystallization mixture, difference in temperature, crystal
packing and manner of freezing, and the use of different
preparations and batches. Nevertheless, EPR spectroscopy
and X-ray crystallography agree beyond doubt on the
existence of a mixed coordination at the cupric centre of
2,3QD at functionally relevant pH values.
Diethyldithicarbamate-inhibited 2,3QD
Diethyldithiocarbamate (DDC) is a known chelating agent
for copper and a strong inhibitor of 2,3QD. In Fig. 4D, the
EPR spectrum of the DDC-inhibited enzyme at pH 6 is
reported. This compound drastically changes the EPR
spectrum of 2,3QD, giving rise to a single EPR signal with
g
//
and A
//
values of 2.182 and 15.5 mT (cyan circle in
Fig. 5), respectively. The lowering of the g
//
value is
indicative of sulfur ligation to the copper-site. The recently
solved X-ray structure of the DDC-inhibited 2,3QD [23]
confirms this and shows that the enzyme is penta coordi-
Fig. 5. Peisach–Blumberg plot. Plot of g
//
and A
//
values from EPR of
the various flavonol complexes, as read off from the spectra, see also
Table 1. Parameters of additional complexes are reported in the text.
Areacircledindarkblue:theregionwheretype2Cusitesinproteins
are found; light blue, where type 1 sites are found, according to [18].
2974 I. M. Kooter et al. (Eur. J. Biochem. 269) Ó FEBS 2002
nated with a regular square pyramidal geometry where the
copper is ligated by His66, His68, His112 and the two sulfur
atoms of DDC.
Anaerobic complexation of 2,3QD with its natural
substrate quercetin
Anaerobic incubation of 2,3QD with quercetin (5,7,3¢,4¢-
tetrahydroxy flavonol dissolved in dimethylsulfoxide) at
pH 6.0 resulted in a totally new and single species EPR
signal (Fig. 6A) characterized by g
//
and A
//
values of 2.336
and 11.4 mT (red circle in Fig. 5). Comparison of this
spectrum with that from a sample prepared by anaerobic
addition of solid quercetin to the enzyme solution (Fig. 6B)
indicates that the changes observed in the former are
entirely due to the presence of quercetin, and are not
affected significantly by the solvent DMSO. Quantification
of the total spin concentration from the EPR signals from
the spectra of Fig. 4A (native form) and 6A (quercetin
bound form) resulted in values of 0.78 and 0.85 spins per
monomer, respectively, which agrees with the copper
content of 0.8 mol copper per mol of protein found from
atomic absorption spectroscopy measurements, indicating
that no large scale reduction of copper takes place upon
substrate ligation.
It was already reported by Oka et al. [6] that upon
anaerobic incubation with A. flavus 2,3QD, flavonols that
serve as substrates undergo a bathochromic shift in their
UV/vis spectra. With quercetin, for example, the visible
flavonolic band shifted from 367 to 380 nm [6]. As flavonols
are known to absorb at longer wavelengths upon complex
formation with metals [24], the red shift was taken as
evidence that flavonols interact with the metal centre prior
to dioxygen attack. The EPR spectrum of 2,3QD incubated
with quercetin in the absence of dioxygen is consistent with
this hypothesis. The presence of the natural substrate causes
specific changes in the electronic environment of 2,3QD that
are interpreted in terms of the formation of an enzymeÆflav-
onol complex. As a result of the small hyperfine splitting this
copper centre falls in a region of the Peisach–Blumberg plot
in between those usually occupied by type 2 and type 1 Cu
sites (Fig. 5).
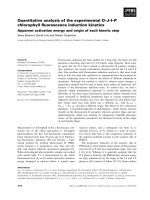
Turn-over conditions
Exposure to oxygen (air) of the 2,3QD samples incubated
with quercetin (either dissolved in dimethylsulfoxide or
added as a solid) yielded an EPR spectrum (Fig. 6C),
different from that of the native enzyme (Fig. 4A). Thus,
after the oxygenation reaction has taken place, the enzyme
returns to a state that is different from the original one. To
investigate this in more detail, the sample after turn-over
was extensively washed with 50 m
M
Mes, pH 6.0, by
repeated concentrations and dilutions. This resulted in the
original spectrum of the native enzyme (Fig. 6D), indicating
that most likely a bound reactant had been removed.
Aerobic addition to the native enzyme of 2-proto-
catechuoyl-phloroglucinol carboxylic acid in twofold excess
resulted in the EPR spectrum shown in Fig. 6E. Except for
an admixture of a small contribution of a native like EPR
spectrum, the spectrum in Fig. 6E is similar to the EPR
spectrum of the enzyme after turnover (Fig. 6C) whereas
addition of CO (under saturation conditions) did not affect
the EPR spectrum (not shown). Therefore, we conclude that
the differences in the spectrum are to be ascribed to the
depside product, which remains bound to the copper centre
after turn-over.
Interestingly, the EPR parameters obtained from simu-
lations of the spectrum after turnover (Fig. 6C) are similar
to those of the pH 10.0 native species discussed above
[g
zz
¼ 2.295(4), g
yy
¼ 2.169(5), g
xx
¼ 2.014(3), A
zz
¼
12.2(2) mT, A
yy
¼ 4.2(2) mT, and A
xx
¼ 6.7(3) mT].
Hence, we expect the complex after turnover to be similar
to the native enzyme at high pH, i.e. having a distorted
trigonal bipyramidal structure.
Fig. 6. EPR spectra of quercetin and depside bound 2,3QD. (A)
2,3QDÆquercetin (1 : 1 molar ratio, 2.5% dimethylsulfoxide v/v,
pH 6.0). (B) 2,3QDÆquercetin (1 : 1 molar ratio, quercetin added as a
solid, pH 6.0). (C) Sample (A) after addition of oxygen (air). (D)
Sample (C) after four cycles of concentration and dilution with 50 m
M
Mes buffer, pH 6.0 in an YM10 concentrator (Amicon Inc., Danvers,
MA, USA) to remove molecules of molecular mass lower than
10 kDa. (E) aerobically prepared 2,3QDÆdepside (2-protocatechuoyl-
phloroglucinol carboxylic acid, twofold excess) complex in 50 m
M
Mes
buffer, pH 6.0 (the spectrum has been corrected for the presence of
some native enzyme).
Ó FEBS 2002 EPR study of A. japonicus 2,3QD (Eur. J. Biochem. 269) 2975
Binding of different flavonols
In addition to quercetin, eight flavonols (galangin, kaemp-
ferol, myricetin, morin, datiscetin, fisetin, 7-hydroxy flavo-
nol and flavonol) (see Table 1 for their structures) have been
studied in this work. Similarly to what was observed in the
presence of its natural substrate, anaerobic incubation at
pH 6.0 of 2,3QD with each of them produced well-defined
spectra (Fig. 7) characterized by the g
//
and A
//
parameters
reported in Table 1. Figure 5 shows the location of each of
these g
//
, A
//
couples in the Peisach–Blumberg plot (red and
green circles).
The various complexes cluster in two regions of the
g
//
–A
//
plane 2,3QD complexes with quercetin, kaempferol,
myricetin and galangin (red circles) have g
//
values ranging
from 2.331 to 2.337, rather small A
//
parameters (11.0–
11.5 mT) and fall in a region intermediate to those where
type 1 and type 2 Cu sites are usually found. The remaining
complexes (green circles) display marginally lower g
//
(2.310–2.320) and higher A
//
(14.0–14.2 mT) parameters.
They are clustered in a region of the Peisach–Blumberg plot
generally occupied by type 2 sites and close to where the
major native EPR form is located. All spectra have an
overall line-shape of an approximately axially symmetric g-
tensor, similar to that of the quercetin bound complex,
suggesting the arrangement of copper ligands to be similar
for all substrate bound complexes.
Overall, it seems that variations in flavonol structure
affect A
//
more than g
//
. Whereas the range of g
//
covered in
the various complexes is rather limited (2.310–2.337), A
//
varies considerably ranging from 11.0 to 14.2 mT. The
presence of a 5-OH group appears to have particularly large
effects on the electronic structure of the copper centre,
driving A
//
to low values. Though the exact reason for this is
not clear, we speculate that it might be related to the
hydrogen bond, which is formed between the carbonyl
oxygen at the C-ring and the 5-OH proton when the latter
substituent is present. Such a bond is expected to increase
the positive polarization of the C4 atom and to influence
through mesomeric effects the electronic distribution at the
copper centre.
Interestingly, the presence of a 2¢-OH group in the
B-ring counterbalances the effect produced by the pres-
ence of 5-OH whereas other OH substitutions at the
B-ring have no effect. The only explanation for this effect
appears to be related to the abnormally low pK
a
of the
2¢-OH (% 3.5) group [25]. At pH 6.0, morin and datiscetin
bear a negative charge, which is delocalized over the
p-electron system of the substrate. With respect to the
g
//
and A
//
parameters, this seems to compensate the effect
induced by the 5-OH group, producing g
//
and
A
//
parameters similar to those of compounds substituted
at less influential positions.
Flavonol specificity
The specificity of 2,3QD for flavonol binding has been
tested by anaerobically incubating the enzyme with different
flavonoids. The addition of a flavone (apigenin), of a
flavanonol (taxifolin) and of a flavan-3-ol (epicatechin)
(Fig. 8) did not alter the EPR spectra of the enzyme
indicating the absence of binding to the copper centre. From
the chemical structures of the tested flavonoids we conclude
that the presence of a free 3-OH group and an overall planar
molecular structure are strict requirements for binding to
the 2,3QD active site. This result agrees with what is
expected from the shallow shape of the active site cleft
observed in the X-ray structure [8].
Comparison with
A. niger
DSM 821 2,3QD
A. niger DSM 821 2,3QD is the only other 2,3QD
characterized by EPR [7]. The main differences between
2,3QD and A. niger DSM 821 2,3QD are that in the latter
(a) a single species EPR spectrum of the enzyme in the
native state (Ôas isolatedÕ) is observed, with (b) EPR
parameters (g
//
¼ 2.293 and A
//
¼ 15.5 mT), that differ
significantly from 2,3QD (major species: g
//
¼ 2.330 and
A
//
¼ 13.7 mT, see also respective location on Blumberg–
Peisach plot, Fig. 5). From the EPR results, it was proposed
(c)thatinA. niger DSM 821 2,3QD, the metal interacts
with four nitrogen residues resulting in a distorted square
planar copper centre [7], whereas in 2,3QD a coordination
of copper to three histidines plus water and/or Glu73 is
found by X-ray crystallography. Differences in copper
ligation of the two enzymes are consistent with (a) and (b),
but further interpretation is difficult, as for A. niger DSM
821 2,3QD neither the amino-acid sequence nor the X-ray
structure are known. Also (d), in A. niger DSM 821 2,3QD
no changes in the EPR spectra were observed upon
anaerobic addition of a threefold molar excess of quercetin
[7]. Owing to the ease with which flavonols form complexes
with copper, (d) suggests that the copper site in A. niger
DSM 821 2,3QD is not accessible to the substrate under
anaerobic conditions. The combination of these factors
suggests that the reaction mechanism of the two enzymes
differs significantly, which is not too surprising given that
the quaternary structure of A. niger DSM 821 2,3QD seems
to be different from that of 2,3QD [7]. Of particular interest
is the fact that from (a) and (b), it could be concluded that
there is no residue like Glu73 in A. niger DSM 821 2,3QD.
In2,3,QD Glu73 is probably responsible for the complex
EPR spectrum of the native 2,3QD and it seems to be
required for function, since mutation of Glu73 with other
natural amino acid resulted only in virtually inactive
variants (I. M. Kooter et al. unpublished). We hope that
additional studies will be carried out on A. niger DSM 821
2,3QD in order to further investigate this seemingly very
different system.
CONCLUSIONS
The results of this EPR study on A. japonicus quercetin
2,3-dioxygenase are consistent with an enzymatic mechan-
ism similar to that presented in Fig. 3, and permit a more
precise definition of some of the catalytic steps. Binding of
the various flavonols to the active site metal centre is found
not to require the presence of dioxygen and occurs without
formal reduction of the cupric centre (structure 2 in Fig. 3).
This therefore indicates that the activated state 3 is, at least
in absence of dioxygen, not highly populated suggesting
that the equilibrium between 2 and 3 strongly favours
the former. Model studies with [Cu
2+
(fla)(idpa)]ClO
4
[fla ¼ flavonolate, idpa ¼ 3,3¢-imino-bis(N,N-dimethyl-
propylamine)] [13] agree with this. Whereas details on
dioxygen attack and on the steps immediately following it
2976 I. M. Kooter et al. (Eur. J. Biochem. 269) Ó FEBS 2002
Table 1. List of studied flavonols and relative g
//
and A
//
values.
Compound Chemical structure OH pattern at rings A and B g
//
and A
//
(mT)
Quercetin
OHO
OH
OH
OH
O
OH
A
C
B
5,7; 3¢,4¢ 2.336; 11.4
Galangin
OHO
OH O
OH
5,7; none 2.337; 11.0
Kaempferol
OHO
OH
OH
O
OH
5,7; 4¢ 2.336; 11.0
Myricetin
OHO
OH
OH
OH
O
OH
OH
5,7; 3¢,4¢,5¢ 2.331; 11.5
Morin
OHO
OH
OH
O
HO
OH
5,7; 2¢,4¢ 2.320; 14.1
Datiscetin
OHO
OH O
HO
OH
5,7; 2¢ 2.315; 14.0
Fisetin
O
O
OH
HO
OH
OH
7; 3¢,4¢ 2.310; 14.0
7-Hydroxy flavonol
O
O
OH
HO
7; none 2.311; 14.1
Flavonol (3-hydroxy flavone)
O
O
OH
none; none 2.310; 14.2
Ó FEBS 2002 EPR study of A. japonicus 2,3QD (Eur. J. Biochem. 269) 2977
are still largely obscure, the formation after turn-over of the
EÆdepside complex might indicate that the product carbon
monoxide leaves the metal centre prior to the depside.
Schematically, the reaction might therefore proceed as
follows:
E )
*
þflavonol
E(fla) )
*
þO
2
E(fla)ðO
2
Þ)
*
E(dep)(CO)
)
*
ÀCO
E(dep) )
*
Àdepside
E
More work has clearly to be carried out on this very
intriguing class of dioxygenases in order to fully elucidate
how the copper centre is exploited in the enzymatic reaction.
ACKNOWLEDGEMENTS
We thank M. van der Heiden (URV) and R. Gouka (URV) for
isolating the gene and producing the enzyme. Prof. G. W. Canters,
Dr E. J. J. Groenen and Prof. L. Que Jr are acknowledged for their
collaboration. We also thank Prof. K. D. Karlin for fruitful dis-
cussions. The work in Leiden was performed under the auspices of the
BIOMAC research school of Leiden and Delft Universities. R. A. S.
acknowledges support by the Netherlands Foundation for Chemical
Research (CW) with financial aid from the Netherlands Organization
for Scientific Research (NWO).
REFERENCES
1. Hayaishi, O. (1974) General Properties and Biological Functions
of Oxygenases. In Molecular Mechanisms of Oxygen Activation
(Hayaishi, O., ed.), pp. 1–28. Academic Press, New York.
2. Bairoch, A. (1993) The ENZYME database. Nucleic Acids Res.
21, 3155–3156.
3. Que, L. Jr (1999) Oxygen Activation at Nonheme Iron Centers. In
Bioinorganic Catalysis (Reedijk,J.&Bouwman,E.,eds),pp.269–
321. Marcel Dekker, Inc., New York.
4. Broderick, J.B. (1999) Catechol dioxygenases. Essays Biochem. 34,
173–189.
5. Oka, T. & Simpson, F.J. (1971) Quercetinase, a dioxygenase
containing copper. Biochem. Biophys. Res. Commun. 43, 1–5.
6. Oka, T., Simpson, F.J. & Krishnamurty, H.G. (1972) Degradation
of rutin by Aspergillus flavus. Studies on specificity, inhibition, and
possible reaction mechanism of quercetinase. Can. J. Microbiol.
18, 493–508.
7. Hund,H.K.,Breuer,J.,Lingens,F.,Huttermann,J.,Kappl,R.&
Fetzner, S. (1999) Flavonol 2,4-dioxygenase from Aspergillus niger
DSM 821, a type 2 Cu(II)-containing glycoprotein. Eur. J.
Biochem. 263, 871–878.
8. Fusetti, F., Schro
¨
ter, K.H., Steiner, R.A., van Noort, P.I., Pijning,
T., Rozeboom, H.J., Kalk, K.H., Egmond, M.R. & Dijkstra,
B.W. (2002) Crystal structure of the copper-containing quercetin
2,3-dioxygenase from Aspergillus japonicus. Structure 10, 259–268.
9. Speier, G. (1991) Quercetin 2,3-dioxygenase mimicking chemistry.
In Dioxygen Activation and Homogeneous Catalytic Oxidation
Fig. 7. EPR spectra of other anaerobic 2,3QDÆflavonol complexes.
(A) 2,3QDÆkaempferol. (B) 2,3QDÆmorin. (C) 2,3QDÆfisetin. (D)
2,3QDÆflavonol. All spectra were recorded at pH 6.0 (50 m
M
Mes
buffer) with a flavonol to enzyme ratio of 1 : 1 (2,3QD concentration
was % 0.84 m
M
). Dimethylsulfoxide concentration in the samples was
2.5% (v/v).
Fig. 8. Chemical structure of tested flavonoids. (A) the flavone apig-
enin. (B) the flavanonol taxifolin. (C) the flavan-3-ol epicatechin. The
asterisks indicate the stereocentres. In the cases of (B) and (C) racemic
mixtures were used.
2978 I. M. Kooter et al. (Eur. J. Biochem. 269) Ó FEBS 2002
(Sima
´
ndi, L.I., ed.), pp. 269–278. Elsevier Science Publishers B.V.,
Amsterdam.
10. Balogh-Hergovich, E., Kaizer, J. & Speier, G. (2000) Kinetics and
mechanism of the Cu(I) and Cu(II) flavonolate-catalyzed oxyge-
nation of flavonol. Functional quercetin 2,3-dioxygenase models.
J. Mol. Cat. 159, 215–224.
11. Kaizer, J. & Speier, G. (2001) Radical-initiated oxygenation of
flavonols by dioxygen. J. Mol. Cat. 171, 33–36.
12. Barha
´
cs, L., Kaizer, J. & Speier, G. (2001) Kinetics and
mechanism of the stoichiometric oxygenation of the ionic zinc (II)
flavonolate complex [Zn (fla) (idpa) ]ClO4 (fla¼flavonolate;
idpa¼3,3¢-iminobis (N,N-dimethylpropylamine). J. Mol. Catal.
172, 117–125.
13. Barha
´
cs, L., Kaizer, J., Pap, J. & Speier, G. (2001) Kinetics and
mechanism of the stoichiometric oxygenation of [Cu (II) (fla)
(idpa)]ClO4 [fla ¼ flavonolate, idpa ¼ 3,3¢-iminobis (N,N-
dimethylpropylamine)] and the [Cu (II) (fla) (idpa)]ClO4-catalysed
oxygenation of flavonol. Inorg. Chim. Acta 320, 83–91.
14. Von Heijne, G. (1985) Signal sequences – The limits of variation.
J. Mol. Biol. 184, 99–105.
15. Von Heijne, G. (1986) A new method for predicting signal
sequence cleavage sites. Nucleic Acids Res. 14, 4863–4690.
16. Oka, T., Simpson, F.J., Child, J.J. & Mills, C. (1971) Degradation
of rutin by Aspergillus flavus. Purification of the dioxygenase
quercetinase. Can. J. Microbiol. 17, 111–118.
17. Weil, J.A., Bolton, J.R. & Wertz, J.E. (1994) Appendix E 3.
Measurement of g-and hyperfine parameters. In Electron Para-
magnetic Resonance,p.511.JohnWiley&SonsInc,NewYork.
18. Peisach, J. & Blumberg, W.E. (1974) Structural implications
derived from the analysis of electron paramagnetic resonance
spectra of natural and artificial copper proteins. Arch. Biochem.
Biophys. 165, 691–708.
19. Vannga
˚
rd, T. (1972) Copper proteins. In Biological Applications of
Electron Spin Resonance (Swartz, H.M., Bolton, J.R. & Borg,
D.C., eds), pp. 411–447. John Wiley & Sons, Inc., New York.
20. Addison, A.W., Hendriks, H.M.J., Reedijk, J. & Thompson, L.K.
(1981) Copper complexes of the tripod tris (2-benzimidazo-
lylmethyl) amine-5-coordinate and 6-coordinate copper(II) deri-
vatives and some copper(I) derivatives. Inorg. Chem. 20, 103–110.
21. Jiang, F., Karlin, K.D. & Peisach, J. (1993) An electron-spin echo
envelope modulation (ESEEM) strudy of electron-nuclear
hyperfine and nuclear–quadrupole interactions of d
2
z
ground-state
copper(II) complexes with substituted imidazoles. Inorg. Chem.
32, 2576–2582.
22. Barbucci,R.,Bencini,A.&Gatteschi,D.(1977)Electronspin
resonance spectra and spin hamiltonian parameters for trigonal-
bipyramidal nickel(I) and copper(II) complexes. Inorg. Chem. 16,
2117–2120.
23. Steiner, R.A., Kooter, I.M. & Dijkstra, B.W. (2002) Functional
analysis of the copper dependent quercetin 2,3-dioxygenase.
1. Ligand-induced coordination changes probed by X-ray crys-
tallography: inhibition, ordering effects and mechanistic insights.
Biochemistry, in press.
24. Jurd, L. (1962) Spectral properties of flavonoid compounds. In
The Chemistry of Flavonoid Compounds (Geissman, T.A., ed.), pp.
107–155. Macmillan, New York.
25. Jovanovic, S.V., Steenken, S., Tosic, M., Marjanovic, B. & Simic,
M.G. (1994) Flavonoids as antioxidants. J. Am. Chem. Soc. 116,
4846–4851.
26. Esnouf, R.M. (1997) An exensively modified version of MolScript
that includes greatly enhanced coloring capabilities. J. Mol.
Graphics 15, 133–138.
27. Merritt, E.A. & Bacon, D.J. (1997) Raster3D: Photorealistic
Molecular Graphics. Methods Enzymol. 277, 505–524.
Ó FEBS 2002 EPR study of A. japonicus 2,3QD (Eur. J. Biochem. 269) 2979