Tài liệu Structure Development and Mechanical Performance of Polypropylene docx
Bạn đang xem bản rút gọn của tài liệu. Xem và tải ngay bản đầy đủ của tài liệu tại đây (8.12 MB, 156 trang )
Structure Development and Mechanical Performance
of Polypropylene
Structure Development and Mechanical Performance of Polypropylene by Tim B. van Erp.
Technische Universiteit Eindhoven, 2012.
A catalogue record is available from the Eindhoven University of Technology Library
ISBN: 978-90-386-3164-6
Reproduction: University Press Facilities, Eindhoven, The Netherlands.
Cover design: Paul Verspaget (Verspaget & Bruinink) and Tim van Erp
This research is part of the research programme of the Dutch Technology Foundation STW,
”Predicting Catastrophic Failure of Semi-Crystalline Polymer Products”.
Structure Development and Mechanical Performance
of Polypropylene
PROEFSCHRIFT
ter verkrijging van de graad van doctor aan de
Technische Universiteit Eindhoven, op gezag van de
rector magnificus, prof.dr.ir. C.J. van Duijn, voor een
commissie aangewezen door het College voor
Promoties in het openbaar te verdedigen
op donderdag 5 juli 2012 om 16.00 uur
door
Tim Bernardus van Erp
geboren te Helmond
Dit proefschrift is goedgekeurd door de promotoren:
prof.dr.ir. G.W.M. Peters
en
prof.dr.ir. H.E.H. Meijer
Copromotor:
dr.ir. L.E. Govaert
Contents
Summary ix
Introduction 1
Background 1
Processing-Structure-Properties Relation 3
Scope of the Thesis 5
References 6
1 Quantification of Non-Isothermal, Multi-Phase Crystallization 7
1.1 Introduction 8
1.2 Theory 9
1.3 Experimental 12
1.3.1 Materials 12
1.3.2 Fast Cooling Experiments 12
1.3.3 Differential Fast Scanning Calorimetry 13
1.3.4 Multipass Rheometer (MPR) 13
1.3.5 Dilatometry 13
1.3.6 X-Ray 14
1.4 Results and Discussion 15
1.4.1 Experimental Approach 15
1.4.2 Fast Cooling Experiments 16
1.4.3 Pressurized Cooling Experiments 21
1.4.4 Dilatometry 23
1.5 Conclusions 27
References 27
v
vi Contents
2 Rate, Temperature and Structure Dependent Yield Kinetics 31
2.1 Introduction 32
2.2 Experimental 33
2.2.1 Materials 33
2.2.2 Fast Cooling 34
2.2.3 X-Ray 34
2.2.4 Mechanical Testing 35
2.3 Results 35
2.3.1 Processing - Structure Relation 35
2.3.2 Yield Kinetics 38
2.3.3 Time-to-Failure 42
2.3.4 Structure - Properties Relation 43
2.3.5 Discussion 45
2.4 Conclusions 48
References 49
3 Structure Development during Cooling at Elevated Pressure and Shear Flow 53
3.1 Introduction 54
3.2 Experimental 55
3.2.1 Material 55
3.2.2 Dilatometry 55
3.2.3 X-Ray 57
3.2.4 Transmission Electron Microscopy (TEM) 58
3.3 Methods 58
3.3.1 Normalized Specific Volume 58
3.3.2 Weissenberg Number 59
3.3.3 Dimensionless Numbers 60
3.4 Results and Discussion 60
3.4.1 Dilatometry 60
3.4.2 Morphology 65
3.5 Conclusions 73
References 73
Contents vii
4 The Oriented Gamma Phase 77
4.1 Introduction 78
4.2 Experimental 79
4.3 Results and Discussion 79
4.4 Conclusions 83
References 83
5 Flow-Enhanced Crystallization Kinetics during Cooling at Elevated Pressure 85
5.1 Introduction 86
5.2 Experimental 87
5.2.1 Material 87
5.2.2 Dilatometry 87
5.2.3 X-Ray 88
5.3 Methods 88
5.3.1 Normalized Specific Volume 88
5.3.2 Weissenberg Number 89
5.3.3 Dimensionless Numbers 90
5.4 Modeling 90
5.4.1 Quiescent Crystallization 90
5.4.2 Flow Effects on Crystallization 92
5.5 Results and Discussion 94
5.6 Conclusions 99
References 100
5.7 APPENDIX 102
6 Prediction of Yield and Long-Term Failure of Oriented Polypropylene 103
6.1 Introduction 104
6.2 Experimental 105
6.2.1 Material 105
6.2.2 Mechanical Testing 106
6.3 Experimental Results 106
6.4 Constitutive Modeling 108
6.4.1 Viscoplastic Model 108
6.4.2 Equivalent Stress 109
6.4.3 Flow Function 110
6.4.4 Time-to-Failure 110
viii Contents
6.5 Model Application 112
6.5.1 Characterization. 112
6.5.2 Validation 113
6.6 Conclusions 114
References 116
7 Mechanical Performance of Injection Molded Polypropylene 117
7.1 Introduction 118
7.2 Experimental 119
7.2.1 Material 119
7.2.2 Injection Molding 120
7.2.3 Optical Microscopy 120
7.2.4 Fourier Transform InfraRed (FTIR) Spectrometry 120
7.2.5 X-Ray 121
7.2.6 Mechanical Testing 121
7.3 Results and Discussion 121
7.3.1 Microstructure. 121
7.3.2 Mechanical Properties 124
7.3.3 Model Application 126
7.4 Conclusions 129
References 130
Conclusions and Recommendations 133
Conclusions. 133
Recommendations. 134
References 137
Samenvatting 139
Dankwoord 141
Curriculum Vitae 143
List of Publications 145
Summary
Polymers are known for their ease of processability via automated mass production technologies.
The most important process is injection molding that, due to its freedom in material choice and
product design, allows producing a wide variety of thermoplastic products. Mechanical failure
of these products, either upon impact or after prolonged exposure to load, limits their ultimate
useful lifetime. To predict and control lifetime, understanding of the route from production to
failure, i.e. the processing-structure-property relation, is necessary. This is a complex issue;
especially in the case of semi-crystalline polymers. These are heterogeneous systems comprised
of amorphous and crystalline fractions, of which the latter can be highly anisotropic with size and
orientation that are strongly dependent on the precise processing conditions. As a consequence,
these structural features in the microstructure, and the associated mechanical properties, generally
exhibit distributions containing different orientations throughout a single processed product.
Understanding polymer solidification under realistic processing conditions is a prerequisite to
predict final polymer properties, since only a complete characterization of the morphology distri-
bution within a product can lead to a meaningful and interpretable mechanical characterization.
In this thesis we study the relation between processing conditions, morphology and mechanical
performance of a semi-crystalline polymer, isotactic polypropylene. Key issue is the accurate
control over all relevant processing parameters. Therefore, different experimental techniques are
used to obtain samples at different high cooling rates, at elevated pressures, and high shear rates.
A custom designed dilatometer (PVT-
˙
T -˙γ-apparatus) proves to represent the most important and
useful technique.
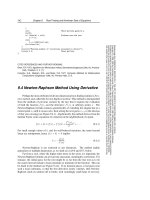
First, a predictive, quantitative model is presented for the crystallization kinetics of the multiple
crystal structures of polypropylene, under quiescent conditions. The approach is based on the
nucleation rate and the individual growth rate of spherulites of each type of polymorphism (α-, β-,
γ-and mesomorphic phase), during non-isothermal, isobaric solidification. Using Schneider’s rate
equations, the degree of crystallinity and distribution of crystal structures and lamellar thickness
is predicted. Next, the effect of flow is introduced. Flow strongly influences the kinetics of
the crystallization process, especially that of nucleation. Three regimes are observed in the
experiments; quiescent crystallization, flow enhanced point nucleation and flow-induced creation
of oriented structures. To assess the structure development under flow, a molecular-based rheology
model is used. Combining the models derived for quiescent and for flow-induced crystallization,
yields the tool that is capable of predicting the volume distributions of both isotropic and oriented
structures, under realistic processing conditions.
ix
x Summary
The kinetics of mechanical deformations strongly depend on the anisotropy in the crystalline
morphology, thus the local orientation. To study this, uniaxially oriented tapes with a well defined,
and high, degree of anisotropy are used as well as injection molded rectangular plates. Yield and
failure are described using an anisotropic viscoplastic model, applying a viscoplastic flow rule. It
uses the equivalent stress in Hill’s anisotropic yield criterion, and combines the Eyring flow theory
with a critical equivalent strain. Factorization is used and the model is capable to quantitatively
predict the rate, the angle and the draw ratio dependence of the yield stress, as well as the time-to-
failure in various off-axis tensile loading conditions. To use the model, also for other polymers,
characterization of only the isotropic state is sufficient. Therefore, the influence of the cooling
rate on the deformation kinetics is studied in-depth on isotropic systems. Different cooling rates
induce different crystal phases, both the stable α-phase and the mesomorphic phase, while also the
degree of crystallinity and lamellar thickness are influenced. The deformation kinetics prove to be
the same for the different microstructures, which means that the activation volume and energy are
independent of the thermodynamic state. Differences in thermal history are, consequently, solely
captured by two rate constants which are a function of the microstructure.
Introduction
Background
Nowadays, plastics are prominent in our society due to their very wide range of application in
various products and sectors. From a historical perspective this is quite impressive. Compared to
the more traditional bulk materials, the mass production of plastics actually just started, ca. 100
years. In contrast, wood and clay have been used since the existence of mankind, glass for 5500
years, iron for 3500 years, paper for 2000 years and cement for 200 years. Over the last decades,
the worldwide production of plastics has exploded from ∼1 Billion liters in 1950 to ∼240 Billion
liters in 2007. Already in the late 1980s the volume of plastics produced exceeded that of steel
(see Figure 1). The share of plastics has been increasing at the expense of the other bulk materials
and the drivers in this growing demand of plastics are manifold. Economic growth, the increasing
wealth in newly industrialized and developing countries play an important role. This increase is
also partly a result of new needs, which can best be fulfilled by plastics, e.g. safety devices such as
airbags or certain medical devices and implants. Another important driver is material substitution,
e.g. the replacement of glass by polymers in consumer goods such as computer screens and the
replacement of the traditional packaging materials like paper or board. In general, the cost balance
for production and processing of the competing materials is decisive.
Figure 1: Historical world production of plastics and steel [1].
The dynamic development in the demand of plastics is mostly covered by the ”commodity
thermoplastics” PVC, PP, PE and PS [2]. While in the 70s and 80s it was assumed that ”high
performance polymers” would gain an increasing share of the total polymer market, the dominant
1
2 Introduction
market position of commodity thermoplastics has increasingly consolidated itself since then,
see Figure 2. To a great extent this results from a continuous development and modification
of these materials; modern industrial policies demand to achieve this goal without developing
”new” polymers but, instead, making use of ”old” polymers that are based on relatively cheap
and readily available monomers [3]. In addition, another possible explanation is given by the so-
called ”experience or learning curve” which predicts that by doubling cumulative production a
cost reduction of 20-30% is achievable simply by becoming more experienced with the product.
reality
1998
prediction
1975for1996
reality
1975
27Miot 122Miot
HDPELDPE/LLDPEPP PSPVS
PCPBT PET PA
ABSPOMPMMA
LCP
PEEK
PPSPARPES
88%
12%
<<1%
commodityplastics;86%
engineeringplastics;14%
highperformanceplastics;<<1%
Figure 2: Share of commodity-, engineering and high performance thermoplastics in the global
consumption [2].
Among the ”commodity thermoplastics” an important class of polymers are the polyolefins;
mainly PE and PP. The basis of the dynamic development of polyolefins and their still tremendous
potential lies in [4]:
• Their versatility with respect to physical and mechanical properties and applications.
• Their nontoxicity and bioacceptability.
• The energy savings during their production and use, in comparison with other materials.
• Their low cost and the easily available raw materials.
• Their economic, versatile, and nonpolluting production.
The influence of the oil price on the price of petrochemical polymers like polyolefins needs special
attention. From the experience curve theory it is expected that production cost go down over
time due to gained experience. However, this relation can be masked when the costs are mainly
determined by feedstocks which fluctuate in price over time; for bulk polymers like PE and PP
the main feedstock is crude oil. The price of oil is to a large extent correlated (up to 82% for PP)
to the polymer prices showing the importance of the oil feedstock [5]. In view of the high and
ever growing production of plastics, the substantial concomitant environmental impacts and, more
recently, very high oil prices, the replacement of petrochemical plastics by bio-based plastics is
receiving increasing attention [6].
Processing-Structure-Properties Relation 3
The relative size of end-use applications remained fairly stable the last decade with packaging
remaining the largest segment and representing 39% of the overall demand, see Figure 3. However,
this share is lower than the year before (40.1%) due to a higher growth of technical applications in
2010 over 2009. The packaging sector is followed by building & construction (20.6%), automotive
(7.5%) and electrical & electronic equipment (5.6%). ”Others” (27.3%) include various sectors
such as sport, health and safety, leisure, agriculture, machinery engineering, household appliances
and furniture.
PE-LD
PE-LLD
PE-HD PP PS PS-E PVC ABS,
SAN
PMMA PA PET
Other
PUR
Packaging
Building&
Construction
Automotive
Electrical&
Electronicequipment
Other
Total:46.4Mtonne
39.0%
20.6%
7.5%
5.6%
27.3%
Figure 3: Europe plastics demand in 2010 by segments [7].
Society has always quested for new materials that can fulfill new needs or replace existing
materials with ones possessing superior performance and have worked diligently throughout
history to create new materials. Currently, the quest is not just seeking for strong materials, the
desired materials should possess the added value of light weight. Therefore, materials that possess
great specific modulus and strength are nowadays required. This quest comes especially from
fields like transportation, architecture, medical care and social welfare. An illustrative example
is the social and technological requirements and purposes like the reduction of fuel consumption
by automobiles for environmental protection and fuel cost reduction. In Figure 4 it is shown that
bulk polymers have a rather poor position in the specific strength-modulus window compared to
e.g. glass, metals and ceramics. However, from these bulk polymers, and in particular semi-
crystalline polymers, materials can be produced like glass reinforced polymers, high-strength
fibers and composites. As such, their increased specific strength and modulus is competitive with
materials frequently used where high specific strength or modulus is required.
Processing-Structure-Properties Relation
As pointed out, polyolefins constitute an extremely interesting family of materials including large-
volume materials such as polyethylene and polypropylene. For these semi-crystalline polymers
injection molding is one of the most widely employed mass production methods for manufacturing
products. The properties of injection molded products of semi-crystalline polymers strongly
depend on the final morphology, which itself depends on the complete (processing) history of the
4 Introduction
1
10 100
1,000 10,000
1
10
100
1,000
0.1
0.01
SPECIFICSTIFFNESS
(MNm/kg)
Goodstiffness-
to-weightratio
Poorstiffness-
to-weightratio
SPECIFICSTRENGTH
(kNm/kg)
Goodstrength-
to-weightratio
Poorstrength-
to-weightratio
Rubbers
Foams
Polymers
Nylon
Composites
Ceramics
Metals
andalloys
Glasses
UF
PMMA
Polypropylene
Polyethylene
Figure 4: Specific modulus versus specific strength for different materials.
material, as illustrated in Figure 5. This includes the polymerization, determining the molecular
characteristics, and the thermomechanical history experienced during processing. Understanding
every step from synthesis via processing to the resulting product properties could lead, eventually,
to materials with properties tailored to the application. This thesis studies part of this process,
mainly using polypropylene-based materials, and focuses on the influence of processing on
morphology and morphology on resulting properties.
chemical
composition
material
formulation
additives
processing
thermomechanical
history
crystallization
(mechanical)
properties
catalyst
reactor
chain
structure
molecularweigth
(distribution)
thisthesis
Figure 5: Flow chart illustrating the processing-structure-properties relationship in semi-crystalline
polymeric materials.
Mechanical performance of polymers is known to be influenced by its molecular properties such
as the molecular weight distribution and its underlying morphology as a result of macromolecular
orientation and thermal history, i.e. factors that are directly connected to processing conditions.
The latter is particularly true for semi-crystalline polymers in which structural features, such as
the degree of crystallinity, crystal size and orientation, may drastically vary depending on the
manner in which the polymer is shaped into the final product. A particularly illustrative example
is given in Figure 6, which shows an injection molded plate of high-density polyethylene (HDPE),
revealing the well-known oriented layers of different thickness at various locations along the
flow path [8]. The observed differences in the microstructure have a dramatic influence on the
macroscopic mechanical properties of samples cut at different loci from the object, which range
Scope of the Thesis 5
from brittle fracture to necking and homogeneous deformation (sections A, B and C resp.). From
this simple example the complexity of the processing-structure-property relation becomes clear,
and it is, therefore, evident that the ability to predict the mechanical properties of polymer products
is uniquely linked to the capability to assess the development of the various structures during
processing within a product.
70x70x1mm
injectionof
polymer
A B
C
A
B
C
Figure 6: Variation in microstructure over the thickness in a simple product, and the resulting different
mechanical responses of samples cut from different parts of a typical injection molded plaque of
high-density polyethylene.
Scope of the Thesis
Catastrophic failure of polymer artifacts, either upon impact (e.g. of protective products such as
airbags and helmets) or after prolonged exposure to load (for instance supporting structures, high-
pressure pipes), limits their ultimate useful lifetime. Hence, understanding of that process, and,
ideally, being able to accurately predict when and under which circumstances this phenomenon
occurs, is of critical importance, not only for the selection of the materials employed in such
objects, but also for their optimal design for safe use. This issue is especially complex in the
case of semi-crystalline polymers, which are heterogeneous systems comprised of an amorphous
matrix with highly anisotropic crystallites of a size and orientation that are dependent on the
molecular weight distribution and the conditions under which the material is processed. As a
consequence, these structural features, and the associated mechanical properties, generally exhibit
strong variations throughout even a single processed object.
6 Introduction
In this thesis, we aim to identify basic principles and tools for process-induced structure
development, but also provide direct assessment of its influence on the resulting short and long-
term mechanical performance of the final product. This thesis focusses on two aspects, both
related to the processing-structure-property relationship of isotactic polypropylene; isotropic and
anisotropic systems.
In Chapter 1 a method is presented to quantify the effect of thermal and pressure history on
the isotropic and quiescent crystallization kinetics of four important crystalline structures of
isotactic polypropylene, i.e. the α-, β-, γ- and mesomorphic phase. Subsequently, the mechanical
performance of PP-based systems comprised of only α- and mesomorphic phase as a result of
systematic variations in thermal history is discussed in Chapter 2.
Oriented systems are obtained either by deformation of the polymer melt or in the solid state.
Chapters 3, 4 and 5 focus on the flow-enhanced nucleation and crystallization kinetics during non-
isothermal crystallization. Based on a unique set of experiments using extended dilatometry a
rheological classification of flow-induced crystallization of iPP by incorporating in a controlled
way the effect of pressure, undercooling and the effect of flow is presented. Special attention is
given to the crystallization under moderate pressure in combination with strong shear flow creating
oriented specimens with high contents of γ-phase (Chapter 4).
In Chapter 6 the mechanical performance of uniaxially oriented polypropylene tape is discussed.
An anisotropic viscoplastic model is presented based on factorization of the rate and draw ratio
dependence and is capable of quantitatively predicting the rate, angle and draw ratio dependence
of the yield stress as well as time-to-failure in various off-axis tensile loading conditions
characterized solely from the transverse direction. In Chapter 7 it is demonstrated that quantitative
predictions of local mechanical properties in an injection molded polymer product can be made
from using the orientation only in combination with the anisotropic viscoplastic model. Finally,
the most important conclusions of this thesis are summarized and recommendations for future
research are presented.
References
[1] www.plasticseurope.org .
[2] M Gahleitner and C. Paulik. Polyolefin basics. Technical report, Borealis GmbH, RPOD Linz (Austria), 2007.
[3] V. Warzelhan and F. Brandstetter. Macromolecular Symposia 201:291–300, 2003.
[4] P. Galli and G. Vecellio. Journal of Polymer Science. Part A: Polymer Chemistry 42(3):396–415, 2004.
[5] T. Simon. Experience Curves in the World Polymer Industry: Quantifying Reductions in Production Cost. Master’s
thesis, Utrecht University, 2009.
[6] M. K. Patel and M. Crank. Journal of Biobased Materials and Bioenergy 1(3):437–453, 2007.
[7] Plastics Europe. Plastics - the Facts 2011. An analysis of European plastics production, demand and recovery for
2010. Technical report, www.plasticseurope.org, 2007.
[8] B. A. G. Schrauwen. Deformation and Failure of Semicrystalline Polymer Systems: Influence of Micro and
Molecular Structure. Ph.D. thesis, Eindhoven University of Technology, 2003.
Quantification of Non-Isothermal, Multi-Phase
xxxxxxx Crystallization: The Influence of Cooling
Rate and Pressure
Chapter 1
Abstract
The structure of semi-crystalline polymers is strongly influenced by the conditions applied
during processing and is of major importance for the final properties of the product. A
method is presented to quantify the effect of thermal and pressure history on the isotropic
and quiescent crystallization kinetics of four important structures of polypropylene, i.e.
the α-, β-, γ- and mesomorphic phase. The approach is based on nucleation and
growth of spherulites during non-isothermal solidification, described by the Schneider
rate equations combined with the Komogoroff-Avrami expression for space filling. Using
an optimization routine to accurately describe the time-resolved multi-phase structure
development, obtained from various experiments with and without in-situ or ex-situ WAXD,
growth rates for the different phases and overall nucleation density are determined as
function of temperature and pressure. Addition of β-nucleating agent is interpreted as
a secondary nucleation density which is coupled to the growth rate of the β-phase. To
confirm the effect of pressure on the growth rate of the β-phase additional measurements
are required. In spite of this, it is shown that the maximum growth rate of the α-, and γ-
phase increases with applied pressure, while it decreases for the mesomorphic phase. In this
way, the multi-phase structure development is accurately described for prescribed quiescent
processing conditions.
Reproduced from: M. van Drongelen, T.B. van Erp, G.W.M. Peters. Quantification of Non-Isothermal, Multi-Phase
Crystallization of Isotactic Polypropylene: The Influence of Cooling Rate and Pressure. submitted to Polymer.
7
1
8 Quantification of Non-Isothermal, Multi-Phase Crystallization
1.1 Introduction
In commonly used production processes like injection molding, film blowing and fiber spinning,
polymers are processed at elevated pressures and/or high deformation rates and simultaneously
cooled from the melt within tenths of seconds. The crystallization process of semi-crystalline
polymers is strongly affected by these extreme processing conditions. Although flow has a
pronounced effect on the crystallization kinetics and resulting morphology, the focus of this
study is on the quiescent non-isothermal and isobaric crystallization and structure development
of isotactic polypropylene (iPP) and β-nucleated isotactic polypropylene (β-iPP). The influence
of flow is ongoing work.
The most established physical picture of quiescent crystallization is nucleation and subsequent
growth of spherulites; crystalline lamellae grow in three dimensions starting from point-like
nuclei. The nucleation density and growth rates have been studied for a range of materials,
including iPP [1]. The reported growth rates of iPP homopolymer are comparable for different
grades, e.g. diverse molecular weights, while the nucleation density is always unique due to
residuals and catalysts remaining from the industrial synthesis [2, 3]. The nucleation density and
growth rate are usually measured by optical microscopy in conditions that typically promote the
formation of α-crystals. However, it is well known that iPP is a polymorphic material with several
crystal modifications [4]. Most common is the monoclinic α-phase, a stable crystal form created
under moderate conditions. Flow or nucleating agents result in formation of the hexagonal β-
form [5–7]. The α- and β-phase forms are a special combination; β-α recrystallization occurs
upon heating due to the thermodynamically instable nature of the β-phase [8]. Moreover, the
growth rate of the β-phase prevails the growth rate of the α-phase in the temperature window of
105-140
◦
C [9, 10]. Available β-nucleating agents contrast in efficiency and selectivity; the β-
phase formation is dependent on the nucleating agent concentration and its ability to solely induce
growth of the β-phase. Even with recently developed agents a pure β-phase structure could not
be obtained at high concentrations indicating that α-phase nucleation from the β-phase promoter
is not negligible [11]. Another crystal modification is the orthorhombic γ-crystal that is formed at
elevated pressures or in copolymers [12–16]. Furthermore, the mesomorphic phase, with features
intermediate to those of the crystalline and amorphous state, is obtained when a sample is cooled
from the melt at high cooling rates [17, 18]. Quenching the melt at high rates significantly hinders
the crystallization process; high cooling rates postpone crystallization to lower temperatures due to
insufficient time for formation and growth of crystals. Moreover, the crystalline structure changes
from α- to mesomorphic phase. This transition is studied in detail using a cooling device, which
combines severe cooling rates with in-situ X-ray collection [17, 19].
The growth of the different crystalline phases is not well established as a function of both
temperature and pressure. An increase in pressure results in an increase of the nucleation density
[20] and the equilibrium melting temperature T
0
m
[13] and thus in a higher undercooling (∆T =
T
0
m
− T ), which is the driving force for crystallization. However, the exact effect of pressure on
the growth rate of a given crystal phase is not yet known. For example, it is only speculated that
the growth rate of the α-phase shifts towards higher temperatures with pressure accompanied
with a decrease in the maximum growth rate [21]. Many attempts were made to model the
crystallization process in semi-crystalline polymers [22–26]. In the case of iPP, most models
1
Theory 9
lack an incorporation of the polymorphism behavior in a clear way or do not account for relevant
processing conditions (especially the effect of pressure is often discarded). A counter example is
a kinetic model [23, 24] that uses pressure dependent rate equations for the α- and mesomorphic
phase. Unfortunately, the nucleation density and growth rate are indistinguishable in these rate
equations and hence, the kinetic parameters lose their physical meaning.
The aim of this study is to develop a model that includes the effects of cooling rate and pressure,
comparable to those experienced in industrial processing, on the formation of different crystal
phases, i.e. the α-, β-, γ- and mesomorphic phase. Material functions for the quiescent
crystallization process are determined; both the nucleation density and individual crystal growth
rates are temperature and pressure dependent. These relations are incorporated in the Schneider
rate equations [27] and combined with the Kolmogoroff-Avrami expression for space filling
[2, 28–30]. A number of experimental setups are used in combination with in-situ and ex-situ
X-ray collection to study the (time-resolved) structure formation of PP-based materials.
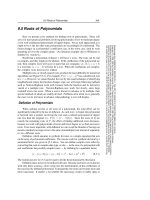
1.2 Theory
Polymer crystallization from the melt is dominated by heterogeneous nucleation. The nuclei grow
in time, depending on the temperature and pressure, forming spherulites that will impinge and
stop growing when complete space filling is reached. Therefore, a model describing polymer
crystallization should contain expressions for the nucleation density and the spherulitic growth
rates. Herein, the effects of secondary crystallization are not considered and not included in
the model. The proposed non-isothermal multi-phase crystallization model is based on the
Kolmogoroff-Avrami expression [28–30]. Space filling is given by:
ξ(t) =
χ(t)
χ
∞
= 1 − exp (−φ
0
(t)) , (1.1)
where χ(t) and χ
∞
are the crystallized volume fractions at time t and in equilibrium conditions,
respectively. φ
0
is the sum of the expected crystallized volume of the different phases if no
impingement would occur in the case of 3D spherulitic growth; φ
0
(t) =
φ
0,i
(t). Parameter
χ
∞
is interpreted as the maximum value of total crystallinity allowed by the external conditions,
such as the thermal and mechanical histories experienced by the sample [31]. Considering multiple
crystalline phases, χ
∞
is the sum of the maximum crystallinity of each crystal phase:
χ
∞
=
ψ
i
χ
i,max
, (1.2)
in which ψ
i
is the final crystal fraction acquired by X-ray analyses and χ
i,max
a maximum crystal
fraction, both per phase i. For non-isothermal conditions, the crystal volumes φ
0,i
(t) are given
by the Schneider rate equations, which provide structure information in terms of the number of
spherulites, radius, surface and volume [27] (for clarity the index i in this set of equations is left
out):
1
10 Quantification of Non-Isothermal, Multi-Phase Crystallization
˙
φ
3
= 8π
˙
N (φ
3
= 8πN ), (1.3)
˙
φ
2
= Gφ
3
(φ
2
= 8πR
tot
), (1.4)
˙
φ
1
= Gφ
2
(φ
1
= S
tot
), (1.5)
˙
φ
0
= Gφ
1
(φ
0
= V
tot
), (1.6)
with nucleation rate
˙
N and crystal growth rate G. The morphology is described per phase i ( per
unit volume) by the total volume of spherulites V
tot
, their total surface S
tot
, the sum of their radii
R
tot
and the number of nuclei N. We assume that only one nuclei reservoir is available in the melt
while each crystal phase has an individual growth rate. The nucleation density N and the growth
rate per phase G
i
are functions of the temperature and pressure and given by:
N(T, p) = N
ref
exp (−c
n
(T (t) − T
Nref
(p))) , (1.7)
G
i
(T, p) = G
max,i
(p)exp
−c
g,i
(T (t) − T
Gref,i
(p))
2
, (1.8)
where N
ref
and G
max,i
, are values at the reference temperatures T
Nref
and T
Gref,i
, respectively,
while both c
n
and c
g,i
are constants. During solidification in a multi-phase system, every crystal
form i will generate a crystal volume fraction φ
0,i
, using a share of the available number of nuclei
and its own growth rate. The ratio in which the nuclei are divided between the crystal phases is
experimentally not accessible. Therefore, the assumption is made that the allocation of nuclei to a
given crystal form scales with the ratio of the individual crystal phase growth rates at the current
temperature and pressure. For isobaric conditions, the nucleation rate for a given crystal form is
given by:
˙
N
i
= g
i
dN
dT
˙
T , (1.9)
with the growth rate fraction, g
i
, given by:
g
i
=
G
i
G
i
. (1.10)
This approach is only valid for the crystal structures that are formed during crystallization from
the melt in quiescent conditions; the α-, γ- and mesomorphic phase.
In order to capture all possible polymorphs in iPP, β-nucleating agent is added to the homopolymer
to enable β-phase formation. The presence of the nucleating agent is considered as a secondary
source of nuclei, N
β
, coupled to the growth rate of the β-phase, G
β
. A selectivity of the nucleating
agent, s, is introduced which assigns a share of N
β
to either the α- or β-phase. It is stressed that G
β
is excluded from Equation (1.10). For clarification, Figure 1.1 schematically shows the allocation
of nuclei depending on the growth rate fraction g
i
and selectivity s.
1
Theory 11
N
N
β
G
β
G
α
G
γ
G
m
(1-s)
g
α
g
γ
g
m
s
Figure 1.1: Schematic overview of the interplay between nucleation densities and growth rates for each
crystal phase.
To account for the selectivity, Equation (1.9) is extended; the nucleation rates for the α-phase and
β-phase in β-iPP become:
˙
N
α
=
g
α
dN
dT
+ (1 − s)
dN
β
dT
˙
T ,
˙
N
β
= s
dN
β
dT
˙
T . (1.11)
The influence of pressure on the crystallization process is twofold; 1) a yet to be determined
influence on the growth rate parameter G
max,i
and 2) a shift of the reference temperatures in
Equations (1.7) and (1.8). This shift is given by:
T
k,ref,i
= T
0
k,ref,i
+ ζ(p −p
0
), (1.12)
where ζ is a constant and T
0
k,ref,i
are reference temperatures at atmospheric conditions p
0
for k =
N, G. For iPP, the effect of pressure on the glass transition temperature, T
g
, is not well established,
but it is assumed that T
g
shifts with ζ similar to T
m
[32, 33]. The bell-shaped growth rate function
(Equation (1.8)) is valid in between T
g
and T
m
and herein, T
Gref,i
, is an intermediate value.
Therefore, it is valid to shift the reference temperatures of all individual crystal phase growth
rates according to Equation (1.12). Since T
g
and T
m
equally shift with pressure, the width of the
growth rate function is maintained and thus c
g,i
is independent of pressure. Similar to the pressure
dependence of the growth rate, the effect of pressure on the nucleation density is implemented by
shifting the reference temperature T
Nref
.
With the nucleation density and individual growth rates modified for non-isothermal and isobaric
conditions, space filling in a multi-phase structure is calculated as a function of time using:
˙
ξ
i
= (1 − ξ)
˙
φ
0,i
. (1.13)
For computational purposes, the set of rate equations in Equations (1.3)-(1.6) is numerically
integrated using an explicit Euler scheme to calculate φ
0,i
. A single set of parameters for the
growth rate of each phase and the nucleation density are determined with an algorithm based
on the interior-reflective Newton method [34, 35]. The input consists of the temperature and
1
12 Quantification of Non-Isothermal, Multi-Phase Crystallization
pressure history and the time resolved crystallinity fractions of the present crystal phases (both
per experimental data set), see Figure 1.2. The number of free parameters depends on the
corresponding crystal phases concerned.
G
max,i
T
G
ref,i
c
g,i
N
ref
c
n
T
N
ref
processingconditions
input
T(t),p
optimized
parameterset
structuredevelopment
input
χ
i
(t)
χ
calc,i
(t)
Figure 1.2: Schematic overview of the optimization approach to determine the parameter set to describe
the crystallization kinetics.
1.3 Experimental
1.3.1 Materials
Two isotactic polypropylene (iPP) homopolymer grades were used; iPP1 (Borealis HD234CF)
with a weight averaged M
w
= 310 kg.mol
−1
and polydispersity M
w
/M
n
= 3.4 [36] and iPP2
(Borealis HD601CF) with M
w
= 365 kg.mol
−1
and M
w
/M
n
= 5.4 [37, 38]. These two grades are
selected due to their well known difference in crystallization kinetics [3]. To study the kinetics of
the β-phase, β-iPP is produced by adding 40 ppm pure γ-quinadricone β-nucleating agent (kindly
provided by Borealis) to iPP2 using an in-house mixer.
1.3.2 Fast Cooling Experiments
A quenching device (University of Genova (Italy), see Cavallo et al. for a complete description
[17, 19]) is used to perform fast cooling experiments with and without in-situ X-ray collection.
A 250-300 µm thick specimen is placed in a vertical holder, where it is heated to a controlled
temperature by a heating gun which blows hot air tangential to the sample surface. Quenching is
performed by blowing compressed air at both sides of the sample using two small hoses. When use
is made of X-ray collection, the sample is placed perpendicular to the X-ray beam which is directed
to a selected volume at 1 mm from an embedded thermocouple. Samples are melted and kept at
220
◦
C for 3 minutes before cooling at various cooling rates of ca. 10 to 260
◦
C.s
−1
. Cooling rates
in all experiments are defined by the slope between 195 and 130
◦
C in the time-temperature history.
In literature other definitions are found for determination of the cooling rate. When the cooling
rate is determined as the temperature gradient at 70
◦
C, around the temperature of the maximum
growth rate of the α-phase at atmospheric pressure, the cooling rates correspond to ca. 1 to 130
1
Experimental 13
◦
C.s
−1
. Values are in the range of ca. 7 to 200
◦
C.s
−1
when the cooling rate is determined by the
slope between the equilibrium melting temperature at 195
◦
C and the crystallization temperature.
1.3.3 Differential Fast Scanning Calorimetry
Isothermal crystallization experiments are performed using a power compensation differential fast
scanning chip calorimeter FLASH DSC 1 from Mettler Toledo (FDSC) in combination with a
Huber intracooler TC100, for all details about this technique the reader is referred to various
papers [39–41]. Specimens of a few nanograms (dimensions are ca. 10 x 10 x 10 µm) have been
prepared from compression molded films. Dry nitrogen was used as a purge gas at a rate of 20
mL.min
−1
. Samples were heated to 220
◦
C at a rate of 100
◦
C.s
−1
, kept at this temperature for
0.1 s and cooled to the desired crystallization temperature at 2000
◦
C.s
−1
. Half crystallization
time is determined by calculating the time when 50% of the the area underneath the exothermal
crystallization peak is reached. With the FDSC technique, the size and mass of the sample used
are difficult to measure. However, both are irrelevant for the results concerned in this work and no
further attention is paid to both specifications.
1.3.4 Multipass Rheometer (MPR)
A MultiPass Rheometer (Cambridge, UK) is used to perform pressurized cooling experiments
in combination with in-situ X-ray collection (for a detailed description of the MPR the reader is
referred to various papers [42, 43]). The MPR consists of two reservoir barrels equipped with a
pressure transducer with integrated thermocouple, two servo hydraulically driven pistons and a slit
flow geometry with diamond windows allowing X-ray experiments. The sample (dimensions are
120 x 6 x 1.5 mm) is placed in the flow cell and heated to a temperature of 220
◦
C and kept for
10 minutes to erase previous thermal history. Pressure is applied by moving both pistons towards
each other and cooling occurs by pumping either a cooling medium through the flow cell (2.0
◦
C.s
−1
) or cooling the flow cell via natural convection (0.1
◦
C.s
−1
). Pressure is set to 50, 150 and
250 bar (which is the maximum pressure).
1.3.5 Dilatometry
Dilatometry experiments were performed with the Pirouette PVT apparatus (IME technologies)
[44–47]. It allows investigation of the evolution of (absolute) specific volume of polymers as a
function of pressure, temperature, cooling rate and shear rate by measuring the volume change
of the sample. The apparatus consists of a pressure cell that combines a traditional ”piston-die
type” dilatomer with a Couette rheometer. The Pirouette requires ring-shaped samples with mass
of ∼75 mg, an inner diameter of 20 mm, thickness of 0.5 mm and height of 2.5 mm. Experiments
were performed in isobaric cooling mode and pressures are set to 300, 600, 900 and 1200 bar. The
sample is heated to 220
◦
C and kept at this temperature for 10 minutes to erase previous thermal
history in the material. The piston and die are cooled by natural convection or with a constant flux
of air or water, resulting in average cooling rates of 0.1, 1.5 and 90
◦
C.s
−1
, respectively. Ex-situ
X-ray measurements are performed to determine the crystal fractions in each sample.
1
14 Quantification of Non-Isothermal, Multi-Phase Crystallization
1.3.6 X-Ray
Wide-angle X-ray diffraction (WAXD) measurements were carried out at the Dutch-Belgian
(DUBBLE) beamline BM26 of the European Synchrotron Radiation Facility in Grenoble (France)
[48]. Two set-ups were used to collect both in- and ex-situ X-ray data. First, the in-situ fast cooling
and ex-situ PVT measurements were collected using a Pilatus 300 K-W detector with 1475 x 195
pixels of 172 x 172 µm
2
placed at 182 mm and using a wavelength of 1.24
˚
A. The exposure time
for the fast cooling and PVT experiments were 47 ms and 15 s, respectively. Secondly, for the in-
situ MPR experiments a Photonica CCD detector with 2048 x 2048 pixels of 48.8 x 48.8 µm
2
was
placed at 195 mm using a wavelength of 0.9538
˚
A with exposure time of 5 s. All WAXD data were
background subtracted and integrated with the software package FIT2D. The fraction of crystal
phases is determined by a deconvolution procedure based on fitting Lorentzian functions to the
WAXD experimental data, which is considered to be the superposition of independent diffractions
associated with all types of structural order [49–51]. The deconvolution procedure discriminates
between different crystalline components; monoclinic α-phase, hexagonal β-phase, orthorhombic
γ-phase and mesomorphic phase. Five Lorentzian functions are used to describe the α-phase
(Bragg spacing d = 6.26, 5.24, 4.78, 4.17 and 4.05
˚
A), two for the β-phase (d = 5.53 and 4.22
˚
A),
one for the γ-phase (d = 4.38
˚
A) and two for the mesomorphic phase (d = 5.98 and 4.07
˚
A). Good
fits were always achieved as illustrated by the examples in Figure 1.3. The amount of the different
phases was calculated similar to Housmans et al. [52], but in this work as the ratio between the
area of the corresponding fitted peaks to the sum of these peaks. An uncertainty of ±1.5% on the
absolute value of phase content is present, well in agreement with typical errors for this type of
deconvolution.
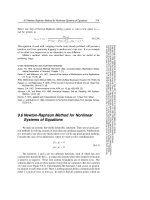
(a) (b) (c)
Figure 1.3: Examples of WAXD pattern deconvolution of samples obtained by (a) fast cooling, (b) MPR
or (c) PVT experiments. Experimental data (grey dots) and fitted curve (thick black line)
resulting from deconvolution of α-phase (black dashed-dotted line), γ-phase (thin black line),
mesomorphic phase (thin grey line) and amorphous phase (grey dashed line).
1
Results and Discussion 15
1.4 Results and Discussion
1.4.1 Experimental Approach
The crystallization processes for iPP1, iPP2 and β-iPP are studied using multiple experimental
setups allowing to probe the structure development in time for various cooling conditions at
atmospheric and elevated pressures. The experimental data are used to determine the temperature
and pressure dependent material functions; the nucleation densities of both grades, the secondary
nucleation density induced by the β-nucleating agent and the spherulitic growth rates of the
different polymorphs. In the following, the approach is elucidated in a prescribed order.
• Fast cooling experiments in combination with in-situ X-ray collection on iPP1 and iPP2 are
performed and give the time resolved structure formation of the α- and mesomorphic phase.
The experiments in which only α-phase develops are selected to optimize the nucleation
densities as function of temperature for both grades. The growth rate G
α
is taken (and
fixed) from literature [20, 53]. Initial input values for the nucleation densities are taken
from Housmans et al. [3].
• With N(T) and G
α
(T ) known, data from fast cooling and FDSC experiments are
used to determine the growth rate of the mesomorphic phase, G
m
, as function of
temperature. Isothermal FDSC experiments are used to supply crystallization half-times
of the mesomorphic phase in the temperature range 0-50
◦
C which were not accessible in
the fast cooling experiments.
• Next, fast cooling experiments are performed for β-iPP. Since N (T ), G
α
(T ) and G
m
(T )
of the matrix material iPP2 are already determined, these experiments are used to obtain the
growth rate of the β-phase, G
β
(T ), the secondary nucleation density N
β
and the selectivity,
s, of the nucleating agent. Initial values for the growth rate are taken from Varga et al. [10]
and for the nucleation density from personal communication with the supplier [54].
• The effect of pressure on the crystallization kinetics of iPP2 is obtained using MPR
experiments. As a result of the applied cooling and pressure conditions only formation
of the α- and γ-phase is observed. This data is used for optimization of G
α
, i.e. the
pressure dependence of G
max,α
. Furthermore, the growth rate of the γ-phase is determined
as function of the temperature and pressure.
• Dilatometry experiments are performed on iPP2 with a wide range of cooling rates and
pressures while structural data is collected ex-situ. This data is used to tune the pressure
dependencies of the maximum growth rates of the α-, γ- and mesomorphic phase.
Based on the results presented in this chapter, the values for χ
i,max
(see Equation (1.2)) are set
to 0.6, 0.6, 0.75 and 0.5 for the α-, γ-, β- and mesomorphic phase, respectively. The value of
the constant ζ (Equation (1.12)) is set to 27.5
◦
C.kbar
−1
based on the pressure dependence of the
melting temperature, T
m
[55].