Impulsive Noise Characterization of InVehicle Power Line
Bạn đang xem bản rút gọn của tài liệu. Xem và tải ngay bản đầy đủ của tài liệu tại đây (575.09 KB, 8 trang )
IEEE TRANSACTIONS ON ELECTROMAGNETIC COMPATIBILITY, VOL. 50, NO. 4, NOVEMBER 2008
861
Impulsive Noise Characterization of
In-Vehicle Power Line
Virginie Degardin, Martine Lienard, Pierre Degauque, Member, IEEE, Eric Simon, and Pierre Laly
Abstract—Impulsive noise can have a great influence on the performance of in-vehicle power line communication systems. Intensive noise measurements in the time domain were thus carried out
on five different vehicles. Preliminary trials were first made on a
stationary vehicle and the motor idling, but the characteristics of
the measured low-amplitude pulses greatly vary from one car to
another. We thus emphasize the characteristics of high-amplitude
pulses, greater than 70 mV, observed when the vehicles were moving in traffic, during a 20-min trip. Noise is statistically characterized in terms of duration, frequency content, peak amplitude, and
time interval between successive pulses. Stochastic models based
on mathematical distribution functions and fitting the experimental distribution of the various pulse characteristics are proposed. It
has been found that interarrival time, i.e., the time interval between
two successive pulses, is rather short and would be thus the most
critical parameter when optimizing the power line communication
physical layer.
Index Terms—Impulsive noise, in-vehicle power line communication, wire communication.
I. INTRODUCTION
VER the last few decades, electronic systems have been
used more and more in vehicles to insure the safety and
comfort of the occupants. These include both safety systems,
such as antilock brake system (ABS), electronic stability program (ESP), and electromechanical brake-by-wire (EMB), and
comfort systems, such as adaptive cruise control (ACC), as well
as numerous multimedia systems providing automotive multimedia and personal computer networking.
In most cases, automobile manufacturers have chosen to
transmit data from sensors to computers via dedicated communications networks, using standardized protocols like controller area network (CAN), local interconnect network (LIN),
media-oriented systems transport (MOST), or FLEXRAY. Currently, twisted wires or fiber optics cables are used for transmitting safety-related signals. This practice has led to increasingly
complex network architectures, with the result of increasing the
weight of the cable harness and the number of connections,
making it harder to insure the reliability of the combined systems. One possible medium-term solution is to use the dc power
O
Manuscript received January 3, 2008; revised June 30, 2008. Current version
published November 20, 2008. This work was supported in part by the French
Ministry of Research, by the Region Nord Pas de Calais, and by the FEDER
funds, conducted in collaboration with PSA Peugeot Citroen, Valeo, and Institut
National des Sciences Appliquees de Rennes (INSA-Rennes).
The authors are with the Institute of Electronics, Microelectronics and Nanotechnology (IEMN)/Telecommunications, Interference and Electromagnetic
Compatibility (TELICE), University of Lille, 59655 Villeneuve d’Ascq, France
(e-mail: ; ;
; ; ).
Digital Object Identifier 10.1109/TEMC.2008.2006851
network as the physical support for transmission [1]–[6]. This
method, often called power line communication, is currently
being developed primarily for use in indoor applications to allow, for example, an Internet connection via any home electrical
outlet.
The principal difficulties encountered when developing such
power line carrier (PLC) systems are mostly related to the channel transfer function, which is highly variable both in terms of
frequency and time [7], and to the impulsive noise generated
by the various electrical devices connected to the network. In
fact, unlike transmissions over coaxial and/or twisted lines, the
disturbing currents and voltages that propagate through a power
network are superposed directly over the useful signal. Knowledge of the noise characteristics is thus essential for optimizing
modulation schemes and channel coding (e.g., error-correcting
codes, interleaving, and equalization algorithms), and also for
predicting link performance.
In the automobile domain, electromagnetic compatibility
(EMC) standards have already been established, but they are
defined either by car manufacturers for each individual piece
of equipment or by international normalization bodies that impose a maximum level for the electromagnetic field radiated
by a vehicle at a given distance. The measurement procedures are, of course, clearly explained in these standards, but
these procedures are primarily defined in the frequency domain.
This can be problematic for studying digital telecommunication
performance.
In the time domain, only a few studies have been published.
For example, the process for characterizing transient voltages
for automotive 42-V power systems is described in [8], with an
emphasis on the effects of the relay arcing process, used mainly
to deal with EMC problems. A few measurements of channel
transfer functions and a description of several noise pulses are
provided in [9], together with a model of the interarrival time
(IAT) distribution. In an attempt to overcome this lack of data
in the literature, we present in this paper an exhaustive study of
impulsive noise, exploring a frequency bandwidth ranging from
500 kHz to 40 MHz, which corresponds to a possible bandwidth
for future automotive PLC systems [3], [5], [10], [11]. It must
be emphasized that we do not seek to identify and characterize
each disturbing source. Preliminary measurements on one car,
of the channel transfer function and the impulsive noise at one
point, are described in [12], while in [13], four measurement
points in the same car were considered.
To make a statistical approach of the impulsive noise characteristics, these previous studies have been extended by making
extensive noise measurements, taken at various connection
points in five new upmarket cars. First, Section II presents the
0018-9375/$25.00 © 2008 IEEE
862
IEEE TRANSACTIONS ON ELECTROMAGNETIC COMPATIBILITY, VOL. 50, NO. 4, NOVEMBER 2008
principles behind the measurement techniques. To make measurement in realistic conditions, the first idea was to extract, in
a car moving in traffic, all types of impulsive noise whose amplitudes exceed a given threshold, for example, much smaller
than the average amplitude of the useful PLC signal. However,
preliminary studies have shown that, in this case, thousands of
pulses are recorded in less than 1 s, and that these low-amplitude
pulses are also present when the vehicle was stationary. It thus
appeared that it would be more interesting to divide the experiments in two steps: measurements in a car in stationary conditions and by using a small triggering threshold for the acquisition
system, and in a car in driving condition using a threshold higher
than the peak amplitude of the pulses already recorded. Few
results are given in Section III for stationary conditions showing that pulses are mainly due to interference sources rather
than noise randomly generated by electronic equipment. Furthermore, the pulse characteristics are often quite different from
one car to another. Additional measurements on a larger number
of cars would thus be needed to have an idea of the spread of
the pulse characteristics. We thus focus our attention to pulses
recorded in driving conditions, under the constraint on high triggering threshold. Section IV describes the results of the analysis
of the distribution of the peak amplitude, pseudofrequency, duration, and IAT of the pulses. Probability density functions fitting
the experimental data are also proposed. We conclude this paper
by a short comparison between in-house and in-vehicle noise
characteristics, since actual PLC modems have been primarily
optimized for in-house communications.
II. IMPULSIVE NOISE MEASUREMENT SYSTEM
Before describing the measurement techniques and how the
impulsive noise was extracted from the ambient noise and characterized statistically, it is important to briefly review the main
features of PLC communication systems in order to highlight
the importance of characterizing noise in the time domain as
well as in the frequency domain.
A. Main Features of PLC Communication Systems
The cable harness tree-shaped bundle configuration is composed of numerous interconnected multiconductor transmission
lines. During data transmission, reflections occur at the different
junctions and on the unmatched terminal equipment. Orthogonal
frequency division multiplexing (OFDM) is usually chosen to
cope with the effects of such multipath propagation, though code
division multiple access (CDMA) has also been studied [14].
To give some figures for a very simple example, a usual
HomePlug 1.0 scheme for a bit rate of 14 Mb/s is based on a
maximum OFDM symbol (21 B) duration of 8.4 µs [15]. Each
maximum code word consists of 20 symbols, plus additional
bytes associated with a Reed–Solomon (RS) and convolutional
concatenated code. The duration of a PHY block of 20 symbols
is 168 µs. Depending on the characteristics of the impulsive
noise, such as pulsewidth and pulse spacing, and thus on the
number of pulses occurring during a code word, the RS code may
or may not be able to correct the errors. Interleaving the code
words is thus often used, but to optimize the interleaving depth,
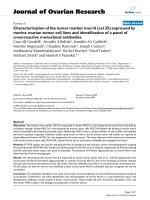
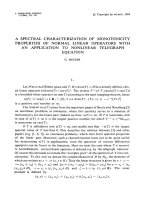
Fig. 1. Typical noise recording compared to an OFDM signal with a PSD of
–60 dBm/Hz.
the statistical properties of the impulsive noise and especially
the IAT must also be known.
Another important parameter that plays a leading role in communication performance is, of course, the power level of the
injected signal. Fig. 1 superposes the impulsive noise measured
in a vehicle (method to be explained later) with an OFDM signal
with a power spectral density (PSD) of –60 dBm/Hz. This PSD
value seems to be the value that will most likely be authorized by
international normalization bodies for indoor PLC applications.
As shown in Fig. 1, the signal and peak values of the disturbing pulses have the same order of magnitude, equal to about
500 mV. It must be emphasized that, due to EMC constraints,
one cannot arbitrarily increase the transmitting power. The EMC
specifications can be defined by the car manufacturer as well as
by international standards. For example, International Special
Committee on Radio Interference (CISPR) 25 (electromagnetic
disturbances related to the electric/electronic equipment in vehicles) [16] specifies that to obtain acceptable radio reception
in a vehicle using typical radio receivers, the disturbing voltage
at the end of the antenna cable should not exceed a limit on
the order of 6 dB·µV. The choice of the maximum PSD is out
of the scope of this paper, but this example underlines that an
in-depth knowledge of impulsive noise statistics is necessary for
studying PLC communication performance.
B. Measurement Setup
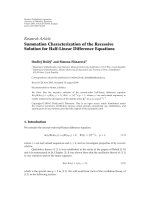
A test platform [see Fig. 2(a)] was developed to measure the
impulsive noise in both stationary vehicles and vehicles moving
in traffic. As illustrated in Fig. 2(b), the disturbing voltage between the power line and the ground (the coachwork or a ground
wire) was measured through a capacitive coupling composed
of a high-pass filter with a cutoff frequency of 500 kHz and an
impedance matching RC network. It is followed by a transformer
to isolate the output signal from the power supply and by a protecting device, limiting the peak amplitude to 3.5 V. The total
insertion loss of these devices is 7 dB. The signal is then amplified and low-pass filtered, and the cutoff frequency of the filter
being 40 MHz. The main characteristics of the coupler are total
power gain: 6.5 dB, gain flatness: 1 dB, bandwidth: 0.5–40 MHz,
DEGARDIN et al.: IMPULSIVE NOISE CHARACTERIZATION OF IN-VEHICLE POWER LINE
Fig. 2.
863
(a) Measurement setup. (b) Block diagram of the coupling device.
input voltage standing wave ratio (VSWR) maximum in the 1 dB
bandwidth: 1.5, and output VSWR maximum: 1.2.
One of the problems in measuring impulsive noise is distinguishing this kind of noise from the background noise. For
wireless communications, a procedure proposed in [17] was to
capture data in both horizontal and vertical polarization simultaneously. Unfortunately, in our application, the only possibility
is to adjust a threshold level. A spectrum analyzer was thus used
to measure this background noise. In the frequency band from
500 kHz to 2 MHz, the noise spectral density was shown to
decrease with frequency from –110 to –130 dBm/Hz, and then
to remain constant between 2 and 40 MHz. Given the 40-MHz
bandwidth of the acquisition system, a triggering threshold varying between few millivolts and 200 mV was chosen, depending
on the configuration of the measurements, as it will be explained
in Sections III and IV.
The acquisition time (i.e., the width of the observation window) after triggering was 650 µs, the signal being sampled at
a frequency of 100 MHz before it is stored. At the end of an
observation window, a clock with a time resolution of 400 ns
was activated to measure the time intervals separating two successive recordings in order to determine the IAT between two
successive pulses, even if the pulses are not in the same observation window [see Fig. 2(a)]. The minimum time between two
successive recordings, i.e., before the acquisition system can be
triggered again, is 250 ns and is thus negligible compared to the
average time between two successive pulses.
C. Detection of the Impulsive Noise and Examples of
Recorded Pulses
Data processing was necessary to extract the different pulses
occurring during an observation window, in order to analyze
their properties in both the time and frequency domains. To
avoid ambiguities due to the presence of background noise,
a technique based on probabilistic criterion and using a decision level is described in [18]. Once the decision level is fixed,
the pulse start and end points are determined where the measured signal crosses the decision level with positive and negative
slopes, respectively. However, applying such a technique to extract pulses having the shape of a damped sinusoid, as we will
see in a next paragraph, seems quite difficult. We have thus preferred to develop another approach, consisting of calculating the
cumulative variance y(k) of the sampled signal during the time
k∆t (denoted hereafter as k), ∆t being the sampling period. If
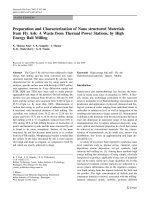
Fig. 3. (a) Example of a noise recording. (b) Cumulative variance during an
observation window.
xi is the signal amplitude sampled at the instant i, y(k) is the
result of
2
k −1
n −1
1
(xi )2 −
(1)
xi
y (k) =
n
i=0
i=0
where n is the total number of samples during an observation
window.
In the presence of background noise, the cumulative variance
is a linear function of k, and thus a break in the line indicates
the presence of a pulse. The duration of a pulse or a burst
corresponds to the time interval during which the slope of y(k)
is significantly different than the slope of background noise only.
The first two steps of this calculation are illustrated in Fig. 3.
The upper curve shows a recording for one observation window;
the abrupt change of the y(k) slope on the lower curve clearly
shows the instants when a transient phenomenon begins and
stops.
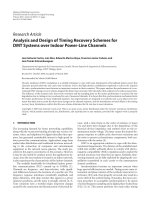
An example of the pulses during one observation window
is given in Fig. 4, highlighting the damped sinusoidal form of
the pulses, which was found in almost all of the recordings.
To classify the pulses, two categories—single pulse and burst—
were first considered. In general, a burst is defined as a sequence
of distinct pulses but experimental results show that in most
cases, a burst is formed by only two successive pulses, as shown
in Fig. 4(b). Considering all the observation windows, one can
determine the percentage of either single pulses or bursts, and
thus their probability of occurrence.
Since the approximate pulse shapes are damped sinusoids, a
pseudofrequency Fps can be defined as the frequency at which
the PSD reaches a maximum value. Consequently, the analysis
can turn to the statistical distributions of the following characteristics: peak amplitude, pseudofrequency, duration, and IAT.
D. Description of the Successive Measurements
To draw pertinent conclusions from the study of impulsive
noise, noise recordings from a certain number of vehicles are
864
Fig. 4.
IEEE TRANSACTIONS ON ELECTROMAGNETIC COMPATIBILITY, VOL. 50, NO. 4, NOVEMBER 2008
Typical noise recording. (a) Single pulse. (b) Burst.
needed, since the noise characteristics are likely to vary with
the car brand and model. We thus chose to take measurements
on a group of five upmarket cars from different manufacturers
in different countries. Two of these cars, henceforth denoted as
CarG1 and CarG2, had gas engines; the other three—CarD3,
CarD4, and CarD5—were diesels. The horsepower of the different motors ranged from 150 to 210 hp.
Furthermore, in each vehicle, the measurements were taken
at a variety of different points, including the cigarette lighter,
the 12-V outlet, and the on-board computer power supply point.
Indeed, one can expect that the noise also depends on the electronic equipment connected in the vicinity of the measurement
point and on the harness architecture. Since the length of the
cables and the possible source of disturbances in the vicinity
of these points are quite different from one another, one can
hope that the measurement locations represent a true picture of
what happens in the network. For the different cars, the typical
number of measurement points is 5 because, unfortunately, the
access points on the power network in new cars are quite limited.
Preliminary measurements have shown that thousands of
pulses were stored in less than 1 s for a triggering level on
the order of few tens of millivolts, depending on the car. Since
such a high number of events also occurred while the vehicle was stationary and the motor idling, we have divided the
study into two parts, dealing with static and dynamic conditions, respectively. In the static conditions, few results are given
in Section III. In the sequel, pulses characteristics in driving
conditions are emphasized. In this case, the triggering level is
chosen high enough to be greater than the average peak value
of the pulses recorded in static conditions. For these trials, the
measurements were taken during a 20-min trip in urban and
suburban driving conditions in dry or rainy weather, with certain systems (e.g., electric windows, fans, windshield wipers,
and headlights) activated under normal use conditions. About
2000 observation windows were recorded at each measurement
point on the dc line while the vehicles were moving, leading
Fig. 5.
Recording of impulsive noise in static conditions.
Fig. 6. Probability density of the characteristic parameters of noise in static
conditions. IAT distribution is given within a pulse sequence.
to about 104 observation windows per car. The main results are
presented in Section IV.
III. IMPULSIVE NOISE IN STATIC CONDITIONS
In the stationary vehicle with an idling motor, impulsive noise
was detected at the measurement points close to the on-board
computer power supply point. An example of a pulse sequence
(i.e., a series of single pulses), measured on CarD5, can be
seen on the recording shown in Fig. 5. The various recordings
show that the length of the pulse sequences may vary between
100 µs and 1 ms. The probability densities of the characteristic
parameters of the impulsive noise shown in Fig. 5 are given in
Fig. 6.
The curves show that each single pulse has duration between
0.5 and 2 µs, and a pseudofrequency of 15 and 22 MHz for
CarD4 and 9 MHz for CarD5. For this very specific case of
DEGARDIN et al.: IMPULSIVE NOISE CHARACTERIZATION OF IN-VEHICLE POWER LINE
impulsive noise observed under static conditions, we distinguished two distinct series of IAT; the first involved IAT within
a pulse sequence and the second involved IAT between two sequences. The statistical study of the IAT between sequences indicated that their average value is 10 ms. The various recordings
show that the length of the pulse sequences may vary between
100 µs and 1 ms. The IAT within a sequence being smaller than
100 µs, we concentrated on the distribution in that time interval,
since it has about the same duration as a code word. As can be
seen in Fig. 5, the series of pulses for CarD5 is quasi-periodic,
with the probability density function presenting a sharp maximum for an IAT of 50 µs (see Fig. 6). For CarD4, the most
probable IAT is 30 µs, but the distribution function is more
spread out, extending from 25 to 50 µs.
The IAT distribution presenting narrow peaks and the pseudofrequency being clearly identified, this suggests the presence
of an interference source rather than a random noise source.
This could be, among other possible sources, either a clock or
impulse currents generated by modules used for the local control and diagnosis of electrical devices as well as to register and
display operating elements situated some distance away.
On other recordings, data packets were clearly identified but
with a much lower peak amplitude. However, since vehicle communication systems use proprietary communication protocols
and since the access points for the measurements in the vehicles
were quite limited, it was impossible to identify these sources of
interferences. As it appeared from measurements made on the
five cars during our experiments, the characteristics of these interferences are quite different from one car to another. It would
be necessary to make additional measurements on a much larger
number of cars to have an idea of the spread of the low-amplitude
pulse characteristics.
IV. STATISTICAL PROPERTIES OF IMPULSIVE
NOISE IN DYNAMIC CONDITIONS
A. Introduction
This section presents the statistical properties of all the pertinent parameters of the single pulses and bursts recorded when
the vehicles are moving. The triggering threshold was increased
to 70 mV to avoid triggering on the numerous pulses also occurring in stationary conditions, and even to 200 mV for cars
CarD4 and CarD5. The noise statistics presented in this section
will be, of course, only valid under these triggering conditions.
The recordings show that the burst occurrence probability
is 4% and 6% for cars CarG2 and CarD4, respectively, 16%
for cars CarG1 and CarD5, and lastly, 26% for CarD3. This
probability is thus much lower than the one for single pulses.
Based on the results obtained for CarG2, Fig. 7(a) and (b) represents, respectively, the scatter plots of peak amplitude versus
pseudofrequency and the scatter plots of duration versus pseudofrequency (single pulses and bursts are differentiated). In these
figures, the pseudofrequencies of the pulses, whether single
pulses or bursts, are spread out over the entire PLC bandwidth,
from several hundred kilohertz to 40 MHz.
Fig. 7 also highlights the similarity of the characteristics of
single pulses and bursts with respect to their pseudofrequency or
865
Fig. 7. Scatter plot. (a) Peak amplitude versus pseudofrequency plane.
(b) Duration versus pseudofrequency plane.
duration. Since the same result was obtained for the other cars,
in the following discussion, no additional distinction will be
made between single pulses and bursts. We analyzed the pulse
characteristics for each car statistically in order to identify the
possible dispersion between the cars. Depending on the intervals
of the variable, we wanted to analyze if either the cumulative
distribution function (cdf) or the complementary cdf (ccdf).
Future PLC systems will employ some adaptive coding/modulation technique, and statistics based on a per-car basis
is interesting. However, for the time being, such PLC modems
are not yet commercially available, and, in addition, low cost
is an important constraint when developing new automotive devices. We have thus preferred to perform a global analysis, integrating all the data from all five vehicles in order to determine
the average statistical distributions. We then tried to find simple
distribution functions based on well-known mathematical expressions, which would fit the experimental distribution. These
functions will allow us to build a noise model for subsequent
use in software for communication link simulators.
B. Peak Amplitude Distribution
The curves in Fig. 8 show the ccdf of the peak values, deduced
from the pulses recorded in each car. The ccdf representation
was chosen, instead of the cdf, because it clearly identifies the
maximum values of the peak amplitude, which correspond to the
most disturbing pulses. The average distribution curve, denoted
Experiment, was calculated for all the measurements on the five
vehicles. Two curves corresponding to measurements in two
cars (G1 and D4) are also plotted. They have been chosen since
they are at the larger distance from the average curve, and this
gives an idea of the spread of the experimental values.
The pulse amplitudes are mostly between 0.5 and 1 V, with
the probability of obtaining an amplitude greater than 1 V being
between 1% and 8%. If the low probabilities (typically less than
10−2 ) are excluded, the results indicate a low dispersion from
one car to another.
To find the mathematical expression of the distribution functions that would be most appropriate, six well-known
866
IEEE TRANSACTIONS ON ELECTROMAGNETIC COMPATIBILITY, VOL. 50, NO. 4, NOVEMBER 2008
Fig. 8. Complementary cumulative distribution of the amplitudes deduced
from values measured in two cars (curve CarG1 and CarD4), from all the
values measured in-vehicle (curve Experiment). The curve Model is based on
three gamma distribution functions.
Fig. 9. Cumulative distribution of the pseudofrequencies calculated from the
measurements and the statistical model.
functions—Gauss, gamma, Weibull, beta, Rayleigh,
exponential—have been tried. However, a single function
could obviously not cover the entire interval of the possible
amplitude values A, and it was necessary to consider successive
subintervals. This was done empirically by observing the
experimental curve of the probability density function and by
trying to find intervals in which the variation of the function
is smooth and does not present more than one maximum or
minimum. For the amplitude A, three intervals were considered:
A < 0.31 V, 0.31 V < A < 0.67 V, and A > 0.67 V. Then, to
find the most appropriate function, iterative trials are made. The
function that minimizes the Kolmogorov–Smirnov statistics
is chosen. For the distribution of the amplitudes, the gamma
probability density function, expressed mathematically in (2),
is the one that provides the best fit with the measurement results
y(x/a, b) =
1
e−x/b xa−1
ba Γ(a)
(2)
where Γ() is the gamma function. The values of the parameters
a and b are indicated in Fig. 8 together with the probability P (A)
that A belongs to one of the three intervals. Given the dispersion
of the results from one car to another, it did not seem necessary
to try a greater number of subintervals, nor to try various distribution function combinations. It must also be emphasized
that, regardless of the variables studied, the gamma distribution
functions provided the best fit between the experimental and the
modeled results.
C. Pseudofrequency Distribution
The cumulative distribution of the pseudofrequency Fps calculated from all experimental values (curve Experiment) is plotted in Fig. 9, together with the curve obtained from a modeling
based on gamma functions. The pseudofrequencies are widely
spread, especially for CarD3 and CarG2, and are within the PLC
frequency band.
Fig. 10. Cumulative distribution of the pulse duration. In-vehicle experimental
results and simulation.
D. Distribution of the Pulse Duration
The cumulative distribution of the pulse duration (curve Experiment) calculated from all experimental values is plotted in
Fig. 10. The extreme cases, corresponding to cars CarG1 and
CarD4, do not show a large dispersion between cars. We see that
50% of the pulses have a duration of less than 5 µs, and 99%
of the pulses last less than 20 µs. The parameters of the gamma
functions used for the model are also given. In most cases, a
correlation between the pulse length and its pseudofrequency
was observed, since the average number of sinusoids per pulse
is often between 4 and 5.
E. Distribution of the IAT
IAT is an important pulse characteristic for PLC communication. Indeed, to avoid two pulses disturbing the same code word,
DEGARDIN et al.: IMPULSIVE NOISE CHARACTERIZATION OF IN-VEHICLE POWER LINE
867
TABLE I
SUMMARY OF THE IN-VEHICLE AND IN-HOUSE CHARACTERISTIC PARAMETERS
Fig. 11.
Cumulative distribution of IATs.
data interleaving can be an interesting solution. In this case, the
interleaving depth must be chosen in such a way that there is
little probability that two pulses will occur during the time of
an interleaved matrix. Fig. 11 presents the cdf of the IAT for all
vehicles (Experiment), for two extreme cases (cars G1 and D4).
The various intervals (expressed in log of their values) in which
the parameters of the gamma function were optimized are also
indicated.
As Fig. 11 shows, the spread of the IAT values is very wide,
ranging from a few microseconds to more than 1 min. These
are not long IAT, which are disadvantageous for communication performance, but rather are IAT with an order of magnitude
measured in microseconds. In fact, the average duration of an
OFDM symbol for this kind of communication is on the order of 10 µs in the HP1.0 standard with its maximum rate of
14 Mb/s [15]. It appears that four out of five vehicles behave
quite similarly in terms of IAT distribution, with a 20%–40%
probability of obtaining IATs under 100 µs, for example.
F. Summary of the Characteristic Values
The first line in Table I summarizes the principal pulse characteristics measured in the five vehicles. The first column of
the table gives the burst occurrence probability. In the next two
columns, the 50th percentile of the amplitude and the duration
are given, with the 90th percentile in parentheses. For the IAT,
it was more interesting to calculate the 10th percentile rather
than the 90th percentile since the successive pulses with very
low IAT values risk disturbing the link. The IAT has a strong
impact on the performances of the link. For example, in HomePlug 1.0 [15], the duration of an OFDM symbol is 8.4 µs, and
RS and convolutional concatenated encoding is used on PHY
blocks based on 20 or 40 symbols. Therefore if, for example,
two pulses separated by a time interval of 21 µs disturb a PHY
block of 20 symbols, the error-correcting code does not provide
any improvement in the error rate, because it could not correct
more than two disturbed symbols. An example of application
of the impact of the noise on the system performances, and
especially on the maximum data rate and the bit rate, is given
in [11].
To our knowledge, there is not yet PLC modems that have
been specifically developed for in-vehicle communication, and
the first idea is to implement in-the-car, on-the-shelf modems
optimized for in-house PLC. However, as shown in Table I,
it appears that the pulses measured on the vehicles electrical
networks have very different characteristics than those measured
on the in-house network [19].
The pulse duration and pulse amplitude are much smaller invehicle than in-house but the most critical point when optimizing
the PLC physical layer will be related to the IAT, since the tenth
percentile is 21 µs in-vehicle compared to 7.1 ms in-house.
Since the successive OFDM symbols could be disturbed more
frequently, the channel coding for in-vehicle PLCs must be
different than the one used in-house.
V. CONCLUSION
The objective of this study was to collect the data necessary
for building a vehicle noise model to be implemented in a PLC
simulation tool to allow the channel coding to be optimized. An
exhaustive study of the statistical properties of impulsive noise
on a vehicle power network was thus conducted. Noise was
recorded in five vehicles, either in a stationary vehicle whose
motor was idling or in a moving vehicle. For a stationary vehicle,
sequences of pulses, 100 µs to 1 ms long, were observed. They
are likely due to interference from dedicated communications
networks already implemented in the vehicle and from pulses
generated by control-command devices as well. The average
amplitude of these pulses may greatly vary from one car to another, and additional measurement campaigns on a much larger
number of cars are needed before drawing conclusions on the
statistics of this low-amplitude noise. For a moving vehicle, the
triggering level was chosen equal to 70 or 200 mV, to be higher
than the peak value of the pulses observed in stationary conditions. The average distribution functions were plotted, and distribution functions corresponding to the experimental results were
proposed. Since available PLC modems have been developed
mainly for in-house applications, the statistical properties of impulsive noise in the dc network inside a vehicle were compared
to those obtained on the main power network inside buildings.
ACKNOWLEDGMENT
The research reported in this paper was done in part within the
framework of the Safe Transportation—Science and Technology
Research Center (Pˆole ST2: Sciences et Technologies pour la
S´ecurit´e dans les Transports) and in part within the Campus
International de Recherche sur la S´ecurit´e et l’Intermodalit´e
des Transports de surface (CISIT) project.
868
IEEE TRANSACTIONS ON ELECTROMAGNETIC COMPATIBILITY, VOL. 50, NO. 4, NOVEMBER 2008
REFERENCES
[1] Y. Maryanka, “Wiring reduction by battery power line communication,”
in Proc. Inst. Electr. Eng. Semin. Passenger Car Electr. Archit., Jun. 2000,
pp. 8/1–8/4.
[2] A. Rubin, “Implementing automotive protocols for communications over
noisy battery power lines,” in Proc. 22nd Conv. Electr. Electron. Eng.
Israel, Dec. 2002, p. 306.
[3] W. Schulz and T. Hesse, “Channel characteristics of wiring in motor
vehicles for power line communications,” in Proc. IEEE ISPLC, Athens,
Greece, Mar. 2002, pp. 176–180.
[4] T. Huck, J. Schirmer, T. Hogenmuller, and K. Dostert, “Tutorial about
the implementation of a vehicular high speed communication system,” in
Proc. IEEE ISPLC 2005, Vancouver, BC, Canada, Apr., pp. 162–166.
[5] P. A. J. van Rensburg, H. C. Ferreira, and A. J. Snyders, “An experimental setup for in-circuit optimization of broadband automotive power-line
communications,” in Proc. IEEE ISPLC 2005, Vancouver, BC, Canada,
Apr., pp. 322–325.
[6] W. Gouret, F. Nouvel, and G. El-Zein, “Powerline communication on
automotive network,” in Proc. IEEE VTC 2007 Spring, Apr., pp. 2545–
2549.
[7] M. Lienard, M. O. Carrion, V. Degardin, and P. Degauque, “Modeling and
analysis of in-vehicle power line communication channels,” IEEE Trans.
Veh. Technol., vol. 57, no. 2, pp. 670–679, Mar. 2008.
[8] T. P. Diez, S. A. Alles, and R. K. Frazier, “Transient voltage characterization for automotive 42 volt power systems,” in Proc. IEEE Int. Symp.
Electromagn. Compat., Aug. 2000, vol. 2, pp. 921–926.
[9] A. Schieffer, “Statistical channel and noise modeling of vehicular DClines for data communication,” in Proc. IEEE Veh. Technol. Conf., Tokyo,
Japan, May 2000, vol. 1, pp. 158–162.
[10] M. O. Carrion, M. Lienard, and P. Degauque, “Communication over vehicular DC lines: Propagation channel characteristics,” in Proc. IEEE ISPLC
2006, Orlando, FL, Mar., pp. 2–5.
[11] V. Degardin, M. Lienard, P. Degauque, and P. Laly, “Performances of the
HomePlug PHY layer in the context of in-vehicle powerline communications,” in Proc. IEEE ISPLC 2007, Pisa, Italy, Mar., pp. 93–97.
[12] M. O. Carrion, V. Degardin, M. Lienard, and P. Degauque, “Characterization and modeling of in-vehicle power line propagation channel,” presented at the 5th Int. Conf. ITS Telecommun., Brest, France, Jun. 2005.
[13] V. Degardin, M. O. Carrion, M. Lienard, and P. Degauque, “In-vehicle
power line communication: Impulsive noise characteristics,” presented at
the XXVIIIth General Assem. URSI, New Delhi, India, Oct. 2005.
[14] W. Schulz and S. Schwarze, “Comparison of CDMA and OFDM for
data communications on the medium voltage power grid,” in Proc. IEEE
ISPLC, Limerick, Ireland, Apr. 2000, pp. 31–38.
[15] HomePlug white papers on Homeplug Web site. (2008). [Online]. Available: www.homeplug.org/products/whitepapers
[16] Limits and Methods of Measurement of Radio Disturbance Characteristics
for the Protection of Receivers Used on Board Vehicles, CISPR-25, 2002.
[17] P. Torio and M. G. Sanchez, “Novel procedure to determine statistical functions of impulsive noise,” IEEE Trans. Electromagn. Compat., vol. 47,
no. 3, pp. 559–568, Aug. 2005.
[18] M. G. Sanchez, L. de Haro, M. C. Ramon, A. Mansilla, C. M. Ortega,
and D. Oliver, “Impulsive noise measurements and characterization in a
UHF digital TV channel,” IEEE Trans. Veh. Technol., vol. 41, no. 2,
pp. 124–136, May 1999.
[19] V. Degardin, M. Lienard, A. Zeddam, F. Gauthier, and P. Degauque, “Classification and characterization on impulsive noise on indoor power line
used for data communications,” IEEE Trans. Consum. Electron., vol. 48,
no. 4, pp. 913–918, Nov. 2002.
Virginie Degardin received the Engineer degree
from the Ecole Universitaire d’Ingenieurs de Lille,
Lille, France in 2000, and the Ph.D. degree from the
University of Lille, Lille, in 2002.
She is currently an Associate Professor at the
Telecommunications, Interference and Electromagnetic Compatibility (TELICE) Group, Institute of
Electronics, Microelectronics and Nanotechnology
(IEMN), University of Lille, where she is engaged
in research on both the theoretical and experimental
prediction of propagation characteristics and the optimization and performances of modulation and channel coding for power line
communications.
Martine Lienard received the M.S. and Ph.D. degrees from the University of Lille, Lille, France, in
1988 and 1993, respectively.
In 1990, she joined the Telecommunications, Interference and Electromagnetic Compatibility (TELICE) Laboratory, University of Lille (which
became a group of the Institute of Electronics, Microelectronics and Nanotechnology (IEMN) in 2004),
where she is currently a Professor. Her current research interests include the theoretical and experimental prediction of propagation characteristics in
confined areas, as in tunnels, and the optimization and performances of modulation and diversity schemes, such as multiple-input–multiple-output (MIMO),
orthogonal frequency division multiplexing (OFDM), and spread spectrum techniques, for wireless local area network and power line communications.
Pierre Degauque (M’76) received the M.S. and
Ph.D. degrees from the University of Lille, Lille,
France, in 1966 and 1970, respectively, and the Engineer degree from the Institut Superieur d Electronique
du Nord, Lille, in 1967.
He is currently a Professor at the University of
Lille, where he is the Head of the Telecommunications, Interference and Electromagnetic Compatibility (TELICE) Group, the Institute of Electronics, Microelectronics and Nanotechnology (IEMN). Since
1967, he has been engaged in research in the field
of electromagnetic wave propagation and radiation from various antenna configurations. He was involved in research on radiation of antennas situated in
absorbing media for geophysical applications. His current research interests
include radio propagation in confined areas, mines, and tunnels. He is also engaged in research on electromagnetic compatibility, including wave penetration
into structures and coupling to transmission lines.
Prof. Degauque was the Vice Chairman of the International Union of Radio
Science (URSI) Commission E, Electromagnetic Noise and Interference from
1999 to 2002 and the Chairman from 2002 to 2005.
Eric Simon received the Master’s degree in electronics engineering from the Superior School of Electronics (ESCPE), Lyon, France, in 1999, and the
Ph.D. degree in signal processing and communications from the National Polytechnic Institute of
Grenoble (INPG), Grenoble, France, in 2004.
During 2005, he was a Teaching Assistant at the
INPG and the following year he joined one of France
Telecom R&D Laboratories as a Postdoctoral Fellow.
He is currently an Associate Professor at the Institute
of Electronics, Microelectronics and Nanotechnology (IEMN), University of Lille, Lille, France. His current research interests
include the area of wireless and digital communications.
Pierre Laly received the Licence’s degree in telecommunication network from the Institut Universitaire de
Technologies (IUT) de Lille, Lille, France, in 2002.
From 1991 to 1999, he was with Micropuce, Inc. He joined the Institute of Electronics, Microelectronics and Nanotechnology
(IEMN)/Telecommunications, Interference and Electromagnetic Compatibility (TELICE), University of
Lille, Lille, in 2000, where he is currently an
Engineer. His research interests include measurement techniques for wire or wireless communication
systems.