Develop a model for fabric defect prognostic and classification
Bạn đang xem bản rút gọn của tài liệu. Xem và tải ngay bản đầy đủ của tài liệu tại đây (357.72 KB, 4 trang )
ISSN 1859-1531 - TẠP CHÍ KHOA HỌC VÀ CƠNG NGHỆ - ĐẠI HỌC ĐÀ NẴNG, VOL. 19, NO. 5.2, 2021
25
DEVELOP A MODEL FOR FABRIC DEFECT PROGNOSTIC AND
CLASSIFICATION
XÂY DỰNG MƠ HÌNH PHÂN LOẠI VÀ DỰ BÁO LỖI SẢN XUẤT VẢI
Huynh Nhat To*
The University of Danang - University of Science and Technology
*
Corresponding author:
(Received September 2, 2020; Accepted November 14, 2020)
Abstract - Classifying and prognosticating defects can assist
manufacturers to reduce cost and increase the benefit and quality.
Many studies have been done in high-tech industries but only few
studies have focused on others such as textile, ceramic, and so on.
Moreover, most these manufacturers are operating manually and
with backward technologies. With changing quickly in
manufacturing technologies, these companies need to find their
way to catch up and compete with others. Furthermore, defects in
textile industry have some difference with ones in high-tech
industry. This study aims to proposed a framework for defect
prognostic and classification for textile manufacturing. The
framework has been validated based on experiements.
Tóm tắt - Việc phân loại và dự báo lỗi sản phẩm giúp cho các
nhà sản xuất giảm thiểu chi phí, đồng thời nâng cao chất lượng
và lợi nhuận. Nhiều nghiên cứu đã được thực hiện đối với các
ngành sản xuất công nghệ cao. Tuy nhiên, chỉ có vài nghiên cứu
được thực hiện đối với sản xuất vải, gạch men,… Hầu hết các
nhà máy sản xuất này đang vận hành hệ thống phân loại thủ
công và cơng nghệ lạc hậu. Với sự thay đổi nhanh chóng của
nền sản xuất, các nhà máy cần phải đẩy mạnh qua trình quản lý
vận hành của mình. Nghiên cứu này đã xây dựng một mơ hình
có thể phân loại và dự báo lỗi sản phẩm trong việc sản xuất vải.
Dựa trên các kết quả đánh giá đã cho thấy được tính hiệu quả
của mơ hình.
Key words - Classification; Defect prognostic; Neural network;
Textile manufacturing
Từ khóa - Phân loại sản phẩm; dự báo lỗi; mạng nơ-ron; sản xuất
vải
1. Introduction
To increase the benefit and product quality companies
need to reduce product defects. Prognosticating defects can
help to reduce the cost and enhance the productivity. Many
studies have been developed defect prognostic model in
high-tech industries. Only few studies focused on others
industries such as textile, ceramic, and so on.
In high-tech industries, defected products need to
rework or repair. However, in textile industry, defected
products can be classified into many groups which are
repaired group and acceptable group. There are many
factors affect the quality of textile product in
manufacturing process such as moisture, floating fiber,
color grade, material quality, human factor, material
handling, dye type, yarn size, fiber density, machinery, and
so on. So this study aims to develop a framework for defect
prognostic and classification for textile manufacturing. In
addition, experiments was designed to validate the
proposed framework.
applications in the field of production. The study
specifically emphasizes the type of functions that will be
performed on data, including characterization and
description, association, classification, prediction,
clustering and evolution analysis. Ciflikli et al. [4] has
considered improving the production process through data
mining. The research has built models to predict defects,
consider defects compared to non-disability scenarios to
identify important causes of disabilities. Harding et al. [5]
applied data mining in production, especially in operation,
error detection and product quality improvement. Kusiak
[6] used structures such as decision tables, decision maps
and maps for decision making in areas and service
production. The research also applies data mining in the
field of pharmaceuticals, health and production. However,
most of these studies failed to diagnose the root cause of
the defects, so the company had to spend a lot of money on
reworking and repairing. These analyzes do not
systematically and proactively identify the exact models of
factors such as process changes, costs of disability and
signs of potential defects. Jackson [7] and Turban et al. [8]
have combined statistical and analytical techniques to
understand how to use data in the most effective way.
Wang [9] has applied data mining to the zero-defect
production system (ZDM) to ensure no errors in the
products produced. In order to achieve ZDM, a close
combination of not only product quality but also device
status and performance degradation is required. Dean [10]
introduced large data models and how they can be applied
in decision making. Some researches studied the impact of
raw materials on each product and any working conditionrelated factors including the time, shift and level of
experience assigned by the workers to determine where the
2. Literature review
Minimizing defects in production is an important factor
because defects will affect productivity, product quality
and cause potential reliability problems [1]. Reducing
manufacturing defects helps to improve product quality
and reduce the costs of operation. Chi et al. [2] developed
the Adaptive Intelligent Production System (AIMS) for the
production process and implemented AIMS appropriately,
modifying the process model when the predicted errors
were significant. The results show that AIMS has both
explanatory and predictive power. Choudhary et al. [3] has
researched and explored knowledge and data mining
26
problems begin. Previously, there were many analyzes
using data analysis techniques to predict disabilities. Tan
et al. [11] and Yuen et al. [12] used decision trees, logistic
regression and neural network models to determine the root
cause of defects, increase the rate of perceived defects and
support decision-making in disability classification.
There are many studies that have been done in the field
of high technology. Hsu and Chien [13] used data mining
and knowledge discovery techniques such as Kruskal-Wallis
test, k-mean clustering and variance decomposition criteria
to determine possible causes to improve the yield of
fabricated wafers. Hsieh et al. [14] and Hessinger et al. [15]
apply data mining methods to determine and quantify root
causes of yield loss from defects in the semiconductor
industry. The main objective of this method is to examine,
classify different defects and distribution types of defects. In
recent years, data mining and analysis are also being used to
anticipate abnormalities that may occur in wind turbines.
Many high-tech companies have also adopted an integrated
approach to business analysis to improve productivity
management and ensure that products are being produced at
the right time [16]. Perzyk et al. [17] summarized various
data mining techniques to handle defects diagnosis for
production process parameters. However, only a few studies
have been done in the textile sector.
The textile manufacturing process is a complex process
going through many stages, from small to large [18].
Therefore, process testing is a preventive test that is not
usually conducted. Instead, people often only check products
after finishing, it means, check for defects in the final fabric
product. Historically, there have been many surveys on
Automatic Visual Inspection (AVI). Typically four surveys
on AVI. Chin and Harlow [19] conducted a physical
examination, seeking to identify both functional and aesthetic
defects, applying visual inspection automation to improve
product quality. Jain [20] have studied automated testing
systems and systems. The study by Thomas et al. [21] also
examined their technical properties, size tolerances and effects
on disability testing. Patil et al. [22] studied optimized
parameters of machines in the manufacturing process.
Conci and Proenỗa [23] have used the estimate of
Fractal dimension (FD) on inspection images to detect
fabric defects. They performed differential box counting
methods with a few modifications to minimize
computational complexity. The decision to declare an error
is based on the variant of FD. This method is simple in
calculation but the accuracy of the detected defects is very
poor. Kumar [24] has studied the problem of fabric defects
using the feed-forward neural network (FFN). Recently,
Hung and Chen [25] have used the back propagation neural
network, with the fuzzification technique (fuzzy logic), to
achieve the classification of eight different kinds of fabric
defects along with the defect-free fabric.
However, most of these studies do not focus on
prognosticating fabric defects but only present the overall
inspection problem. In recent years, VAI techniques in
fabric error analysis have made important progress, many
new algorithms on fabric testing are also proposed. Sheen
et al. [26] presented an ultrasonic imaging system for web
Huynh Nhat To
textile inspection. Cole and Deak [27] illustrated the use of
reflected infrared frequencies during fabric testing using
knowledge-based systems to track Fabric defects which
were proposed by Srinivasan et al. [28]. Many studies have
identified five major categories of features for texture
analysis: statistical, geometrical, structural, model-based
and signal processing features [29], [30], [31]. However,
due to the elasticity of yarn, fabric movement, pile, noise,
and so on existing methods cannot efficiently solve the
problem. Therefore, this study aims to propose a
framework for defect prognostic and classification which
predicts defects according to each group.
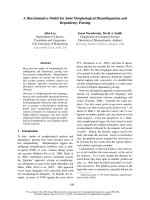
3. Research framework
As mentioned in section 1, defected products in textile
industry have its own characteristics and can be repaired or
used. A research framework of defect prognostic and
classification model is proposed as in Figure 1.
Data
Collection
Data
Processing
Defect
Rework
Non Defect
Acceptable
High Frequency
f
70
Group 1
Others
Group 2
Group 3
Group 4
Defect prognostic and classification model
Figure 1. Framework of defect prognostic and classification
ISSN 1859-1531 - TẠP CHÍ KHOA HỌC VÀ CƠNG NGHỆ - ĐẠI HỌC ĐÀ NẴNG, VOL. 19, NO. 5.2, 2021
3.1. Data collection and processing
To begin the process of defects classification, all related
data is collected such as moisture, floating fiber, color grade,
material quality, human factor, material handling, dye type,
yarn size, fiber density, machinery, and so on. The collected
data then be processed to clean and repair missing data.
3.2. Defects determination
In this step, control chart is used to determine defect
products and non-defect products. The defect products
include ones which are upper and lower the control limits
(upper control limit and lower control limit). For products
without defect, they are group into group 4. The defect
products will go to next step for other classification.
3.3. Defect classification
In textile manufacturing, some type of defects can be
acceptable for using. So the defect products will be
classified into acceptable defect products and repaired
products. The defect product without repairing can be sold
with lower price or used in different purposes. These
products named as group 3 in this study.
3.4. Repaired defect product classification
The defect products which must be repaired will be
classified based on its occurring frequency. The products
appear more than 70 percent will be group in group 1 and
the other for group 2.
Each product group may be affected by different factors and
should be treated by different methods. A defect prognostic
model is develop to solve this problem in section 3.5.
3.5. Defect prognostic and classification model
Neural network is used to develop the defect prognostic
model. The proposed model can prognosticate the type of
defect (group 1, 2, 3, or 4) based on the input data. The
collected data is separated into 70 percent for training the
model and the rest for testing the model. The proposed
framework and model was validated based on a case of
textile manufacturing as shown in section 4.
27
4. Experiement and discussion
4.1. An experiment of textile manufacturing
To validate the proposed framework, an experiment of
textile manufacturing was designed. The manufacturing
process is described as following.
The first step is to produce fibres from natural material.
Next step is yarn preparation that includes blending,
scutching, carding, combining and drawing. The output of this
phase will be primary yarn which will be spinned in yarn
manufacturing phase. After finishing these 3 phases,
companies already produced yarn and ready to go in to main
processes of manufacturing. In this process, yarn will be
winded, wrapped, sized and then be weaved and knitted. Last
step is finishing process including desizing, scouring, stonewashing, bleaching, dyeing and printing, and polishing. In this
process, after bleaching, the products are dyed and printed
according to the customers’ requirements. These printed, dyed
textile products will be polished to make them become cleaner
and more valuable to be sold to customers.
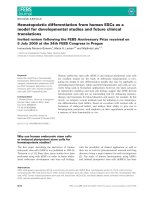
There are many factors that can affect the quality of
textile products. In this case, some main factors were
generated. As shown in Table 1, the factors are separated
according to the machines for easily control. Ten records
or products are shown in this example. Each one has its
factors since the factors may be changed during the time
and the type of products. For winding machine, 3 main
factors used include speed, clearer setting, and tension.
The speed of the winding machine in 10 measurements is
in the range from 1120 rpm to 1550 rpm. An important
machine in manufacturing process is weaving machine
which has seven main factors used to identify and predict
the defects. The factors include speed, solid content,
viscosity, squeeze roller pressure, size pick up, total
stretch, and saw box temperature. The other import
factors include fabric fiber density, fiber size, fiber
maturity, and humidity.
Table 1. An example of generated data
No.
1
2
3
4
5
6
Factors
1
1120
3.0
26
350
10
8
17
12
0.8
87
Speed
Winding
Clearer setting
machine
Tension
Weaving speed (rpm)
Solid content%
Viscosity
Weaving
Squeeze roller pressure
machine
Size pick up%
Total stretch
Saw box Temperature
Fabric fiber density (number of
140
yarns per 10 cm2 of fabric)
Fiber size (mm)D
0.158
Fiber maturity
0.60
Humidity (%)
8.2
2
1450
4.1
27
330
9
10
16
10
0.9
88
3
1130
3.2
26
340
9
9
18
14
0.9
85
4
1350
4.5
27
320
9
8
19
17
0.7
84
Record No.
5
6
1450
1450
4.7
5.1
27
27
360
365
8
8
8
8
18
17
12
10
0.8
0.8
85
87
7
1150
5.8
29
377
9
9
18
11
0.9
86
8
1550
5.0
27
345
8
9
16
12
0.8
81
9
1350
4.8
27
320
8
10
15
11
0.8
88
10
1250
4.8
27
350
9
8
17
11
0.9
85
180
145
190
200
195
130
199
205
210
0.158
0.75
7
0.190
0.65
7.5
0.20
0.8
87.9
0.199
0.79
8.5
0.190
0.80
8.6
0.199
0.74
8.8
0.2
0.81
9.0
0.180
0.79
8.8
0.180
0.80
8.6
4.2. Results and discussion
The total generated data are 2000 records. Following
the proposed framework in section 3, the control chart was
used to identify the products in group 4 (non-defect
products). The remaining products or records then were
classified into group 3. The rest ones were classified into
group 1 and group 2. The group 1 has frequency greater
than 70 percent. Based on the data in the example, the
28
Huynh Nhat To
output of each records or products is shown in Table 2. The
record (or product) number 1 was classified into group 1
(G1), product number 2 is classified into group 4 (G4), and
so on. All records or products of 4 groups were used for
training and testing the prognostic model.
The neural network model consists 5 hidden layers
according to some trails. Based on the proposed framework,
1400 the records were used for training the prognostic model,
and 600 records for testing. The results are shown as in Table 3.
As shown in Table 3, the misclassification rate of the
model is 0.2814 for training and 0.2920 for testing. Similarly,
the average square error is very low which is 0.2010 for
training and 0.2116 for testing. In general, the proposed defect
prognostic model is good to predict the types of defects.
Table 2. Group of each records or products
Record No.
Group
1
G1
2
G4
3
G2
4
G4
5
G4
Record No.
Group
6
G4
7
G3
8
G4
9
G4
10
G4
Table 3. Experiment results
No.
1
2
Measurement
Misclassification rate
Average square error
Training
0.2814
0.2010
Testing
0.2920
0.2116
5. Conclusion
This study proposed a defect prognostic and
classification framework for textile manufacturing which
classifies products into four groups. Each group has own its
characteristics and can be solved easily compared with other
prognostic models. This model can help manufacturers
reduce cost of defect products and increase the benefit and
quality of product. The proposed framework was validated
based on an experiment of textile manufacturing. The results
have shown the reliability and efficiency of the framework.
This proposed framework also can be used in other
industries such as ceramic, steel, and so on. Further research
will combine another classification techniques to improve
the efficiency of prognostic and classification model.
Acknowledgements: This research is funded by Funds
for Science and Technology Development of the University
of Danang under project number B2019-DN02-64.
REFERENCES
[1] Huynh, N.T. (2020). “Online defect prognostic model for textile
manufacturing”, Resource, conservation and recycling, 104910.
[2] Chi, H.-M., Moskowitz, H., Ersoy, O.K., Altinkemer, K., Gavin,
P.F., Huff, B.E. and Olsen, B.A. (2009). “Machine learning and
genetic algorithms in pharmaceutical development and
manufacturing processes”. Decision Support Systems, 69-80.
[3] Choudhary, A.K., Harding, J.A. and Tiwari, M.K. (2009). “Data
mining in manufacturing: a review base d on the kind of
knowledge”. Journal of Intelligent Manufacturing, 501-521.
[4] Ciflikli,C.and Kahya Özyirmidokuz, E.(2010). “Implementing a
data mining solution for enhancing carpet manufacturing
productivity”. Knowledge-Based Systems, 783-788.
[5] Harding, J., Kusiak, A. and Shahbaz, M. (2006). “Data mining in
manufacturing: A review”. Journal of Manufacturing Science and
Engineering, 969-976.
[6] Kusiak, A. (2006). “Data mining: manufacturing and service applications”.
International Journal of Production Research, 4175-4191.
[7] Jackson,J. (2002). “Data mining: a conceptual overview”.
Communications of the Association for Information Systems, 267-296.
[8] Turban, E., Sharda, R. and Delen, D. (2011). Decision Support and Business
Intelligence Systems, Pearson Education, Upper Saddle River, NJ.
[9] Wang, K. (2013). “Towards zero-defect manufacturing (ZDM) − a
data mining approach”. Advances in Manufacturing, 62-74.
[10] Dean, J. (2014). “Case study of a high-tech product manufacturer”.
Big Data, Data Mining, and Machine Learning: Value Creation for
Business Leaders and Practitioners, John Wiley & Sons Inc.,
Hoboken, 229-232.
[11] Tan, S.C., Watada, J., Ibrahim, Z. and Khalid, M. (2014).
“Evolutionary fuzzy ARTMAP neural networks for classification of
semiconductor defects”. IEEE Transactions on Neural Networks
and Learning Systems, doi:10.1109/TNNLS.2014.2329097.
[12] Yuen, C., Wong, W., Qian, S., Chan, L. and Fung, E. (2009). “A hybrid
model using genetic algorithm and neural network for classifying
garment defects”. Expert Systems with Applications, 2037-2047.
[13] Hsu, S.-C. and Chien, C.-F. (2007). “Hybrid data mining approach
for pattern extraction from Wafer Bin Map to improve yield in
semiconductor manufacturing”. International Journal of Production
Economics, 88-103.
[14] Hsieh, K.-L., Tong, L.-I. and Wang, M.-C. (2007). “The application
of control chart for defects and defect clustering in IC manufacturing
based on fuzzy theory”. Expert Systems with Applications, 765-776.
[15] Hessinger, U., Chan, W. and Schafman, B. (2014). “Data mining for
significance in yield-defect correlation analysis”. IEEE Trans Semicond
Manuf IEEE Transactions on Semiconductor Manufacturing, 347-356.
[16] Davenport, T.H. (2006). “Competing on analytics”. Harvard
Business Review, 150-151.
[17] Perzyk, M., Kochanski, A., Kozlowski, J., Soroczynski, A. and
Biernacki, R. (2014). “Comparison of datamining tools for
significance analysis of process parameters inapplications to process
fault diagnosis”. Information Sciences, 380-392.
[18] Huynh, N.-T., Chien, C.-F. (2018). “A Hybrid Multi-subpopulation
Genetic Algorithm for Textile Batch Dyeing Scheduling and an
Empirical Study”. Computers & Industrial Engineering, 125, 615-627.
[19] Chin, R. T., & Harlow, C. A.(1982). “Automated visual inspection:
A survey”. IEEE Trans. Patt. Anal. Machine Intell, 557-573.
[20] Newman, T. S., & Jain, A. K. (1995). “A survey of automated visual
inspection”. Comput. Vis. Image Under, 231-262.
[21] Thomas, A. D. H., Rodd, M. G. J, Holt, D. & Neill, C.J. (1995). “Realtime Industrial Inspection: A Review”. RealTime Imaging, 139-158.
[22] Patile, P., Turukmane, R., and Raichurkar, P. P., (2017).
“Comparative Analysis of Sizing Machine Parameters on Weaving
Performance”. International Journal on Textile Engineering and
Processes, 3, 31-35.
[23] Conci, A. & Proenỗa, C. B. (1998). “A fractal image analysis system
for fabric inspection based on box-counting method”. Computer
Networks and ISDN Systems, 1887-1895.
[24] Kumar, A. (2003). “Neural network based detection of local textile
defects”. Pattern Recognition, 1645-1659.
[25] Hung, C.-C. & Chen, I.-C. (2001). “Neural-Fuzzy classification for
fabric defects”. Text.Res. J., vol. 71(3), 220-224.
[26] Sheen, S.H., Chien, S.H., Lawrence, W.P., & Raptis, A.C. (1997).
“Ultrasonic imaging system for inprocess fabric defect detection”.
US Patent No. 5, 665- 907.
[27] Cole, F. A. & Deak, R. L.(1981). “Defect detection system”. US
Patent No.4, 249,081.
[28] Srinivasan, K. P., Dastor, H., Radhakrishnaihan, P., & Jayaraman, S.
(1992). “FDAS: A knowledge-based frame detection work for analysis
of defects in woven textile structures”, J. Text. Inst, 431-447.
[29] Tsai, I.-S., Lin, C.-H., & Lin, J.-J. (1998). “Application of fuzzy set
theory to diagnosis system for tracing breakdown causes in
weaving”. Int. J. Fuzzy Systems, 200-207.
[30] Perner, P. (1994). “A knowledge-based image-inspection system for
automatic defect recognition, classification, and process diagnosis”.
Machine Vision & Appl, 135-147.
[31] Tuceryan, M., & Jain, A. K. (1993). “Texture Analysis”. Handbook of
Pattern Recognition and Computer Vision, C. H. Chan, L. F. Pau, and
P. S. P. Wang (Eds.), Ch.2, 235-276, Singapore: World Scientific.