The analysis of AHAs in cosmetic
Bạn đang xem bản rút gọn của tài liệu. Xem và tải ngay bản đầy đủ của tài liệu tại đây (225.87 KB, 6 trang )
Journal of Food and Drug Analysis, Vol. 10, No. 2, 2002, Pages 95-100
95
Determination of
αα
-Hydroxyacids in Cosmetics
WEI-SHENG HUANG, CHENG-CHIN LIN, MING-CHUAN HUANG AND KUO-CHING WEN*
National Laboratories of Foods and Drugs, Department of Health,
Executive Yuan, 161-2, Kuen Yang Street, Nankang, Taipei, Taiwan, R.O.C.
(Received: April 23, 2001; Accepted: November 1, 2001)
ABSTRACT
A high performance liquid chromatographic method was developed for the simultaneous determination of four
α
-hydroxyacids
(AHAs, Glycolic acid, dl-Malic acid, Lactic acid and Citric acid) in cosmetics.
Samples were analyzed using a reverse-phase C
18
column (Capcell PAK C18 UG120 S-5 µm) with 2% phosphoric acid (pH 2.0) as
mobile phase at 210 nm. Calibration curves of four
α
-hydroxyacids were constructed in the range of 50-500 µg/mL and their correlation
coefficients were in the range of 0.9992-0.9995. The relative standard deviations of four
α
-hydroxyacids for intraday and interday analy-
ses were 0.05~1.49% and 0.72~3.24%, respectively. The average recoveries of four
α
-hydroxyacids ranged from 96.3% to 99.2%.
Key words: high performance liquid chromatography,
α
-hydroxyacids, AHAs
INTRODUCTION
Environmental pollution, ultraviolet radiation and long-
term disadvantagious factors generate skin wrinkles and
early aging. As a result, a new, global trend has occurred in
the development of anti-aging ingredients for skin care
(1)
.
Organic acid with hydroxyl group (-OH) in its
α
carbon is
called AHAs, with a general name “fruit acid”. Fruit acid
improves the metabolism of epithelium cells, skin luster,
melioration of surface wrinkles, moisturization and intenera-
tion of keratin. The most frequently used in cosmetics are
Glycolic acid, dl-Malic acid, Lactic acid and Citric acid,
among which, Glycolic acid and Lactic acid are proven to
have the best effects on reduction of wrinkles and stimulating
skin cell renewal. This has been provn by scientific evidence
(2-3)
.
The quality of AHAs products in the US and Japan is
not officially regulated. The distribution of these products is
independently managed by cosmetic dealers. To protect con-
sumers, the ROC Department of Health (Executive Yuan)
announced that cosmetics which contain fruit acid and relat-
ed compounds (Glycolic acid and Lactic acid) should not
have a pH value lower than 3.5 and should label uses and
warnings (Nov. 4, 1998)
(4)
.
The long-term safety of AHAs products hasn’t been
completely established
(5,6)
, and market-available AHAs cos-
metics rarely label concentration levels. It has been reported
that the change of concentration of AHAs and pH value of
final formulation are likely to affect the skin and cause such
side effects as: rash, irritation, burning, bleeding and a
change in sun sensitivity
(7)
. Therefore, it is a primary job to
assure the safety of consumers by monitoring the pH value
and AHAs concentration in cosmetics. The most widely used
quantification method for organic acids is chromatography,
which is also widely applied in analyses of food, medicine
and plants such as physiological fluids, silage, tobacco,
fruits, drinks and injections
(8-24)
. Only quantification analy-
sis of Glycolic acid can be found in current cosmetic-related
literature
(12)
. This study employed a simple and accurate
reversed-phase HPLC method to rapidly identify and quanti-
fy the four AHAs ingredients in cosmetics.
MATERIALS AND METHODS
I. Materials
Glycolic acid (99.5%), dl-Malic acid (99.2%) and Citric
acid (99.5%) were purchased from Chem Service (U.S.A.).
Lactic acid (90.0%) was purchased from Fluka (Japan).
Maleic acid was purchased from Aldrich (U.S.A.) and served
as the internal standard. Phosphoric acid (85%) was pur-
chased from Merck (Germany). Ammonia water (25%) was
purchased from R.D.H. (Germany). Formic acid was pur-
chased from Merck (Germany).
II. Instruments
HPLC, Waters Model 510 Pump, Waters In-Line
Degasser, Waters 600 Controller with which Waters 717 plus
Autosampler connected and Waters 996 Photodiode Array
Detector was used in this study. Water purification equipment
here is Milli-Q Waters Purification System (Milli-pore
Corp.).
III. Methods
(I) Analysis Condition
The chromatography column was Capcell PAK C18
UG120 S-5 µm (4.6
×
250 mm); mobile phase was 2% phos-
* Author for correspondence. Tel: 02-26531208; Fax: 02-26531213;
E-mail:
phoric acid (the pH was adjusted ammonia water to 2.0). The
flow rate was 0.5 mL/min. The detective wavelength was 210
nm. Injection value for each time was 25 µL.
(II) Preparation of Standard Solutions
1. Maleic acid 100 µg/mL was prepared as the internal stan-
dard stock solution.
2. 2,000 µg/mL of Glycolic acid, dl-Malic acid, Lactic acid
and Citric acid was prepared as the standard stock solution.
3. Standard solutions were prepared from stock solutions.
Concentration of the standard solution was 200 µg/mL, and
concentration of the internal standard was 2 µg/mL.
(III) Standard Curve
25, 50, 100, 200, 400 and 500 µg/mL standard solutions
were analyzed respectively with 2 µg/mL internal standard.
Linear regression equations and correlation coefficients were
obtained from plots of concentration versus peak area ratio of
standard to internal standard.
(IV) Validation
1. Precision
Within the standard calibration range, the standard stock
solution and the internal standard stock solution were quanti-
fied precisely and diluted with water to 120, 240 and 360
µg/mL for each of the Glycolic acid, dl-Malic acid, Lactic
acid and Citric acid with 2 µg/mL Maleic acid internal stan-
dard in each standard fluid. They were injected into HPLC
for analysis three times on the same day and the successive
five days. The standard deviation (S.D.) and relative standard
deviation (R.S.D.) were then calculated.
2. Accuracy
Ingredients with known concentrations were added in
the placebo sample solutions and injected into HPLC for
analysis after filtration. The recovery rate and accuracy were
calculated. 0.5g AHAs free cream substrate was weighed and
put in 10 mL flasks respectively. Glycolic acid, dl-Malic
acid, Lactic acid and Citric acid standard stock solutions and
internal standard stock solution were added to the flask to
125, 250 and 500 µg/mL for standard solutions and 2 µg/mL
for internal standard solution, centrifuged for 10 minutes at
6000 rpm. The supernate was filtered through 0.45 µm filter
and the filtrate was collected and analyzed in HPLC for three
replicates. The recovery rate was calculated from average
peak area ratio of sample to internal standard by the obtained
linear equation.
3. Limit of Detection
Journal of Food and Drug Analysis, Vol. 10, No. 2, 2002
96
Four standard solutions were respectively diluted by
water into solutions in a concentration gradient and analyzed
by HPLC. The limit of detection was obtained from the con-
centration when the signal peak area was three times the
noise peak area.
(V) Identification and Quantification
Six commercially available samples were weighed pre-
cisely, mixed with an appropriate amount of the internal stan-
dard stock solution, dissolved with water, and sonificated for
30 minutes. Sonicated samples were diluted with water to the
final concentration of the internal standard 2 µg/mL and cen-
trifuged for 10 minutes at 6000 rpm. The supernate was fil-
tered with 0.45 µm filter and the filtrate was taken for HPLC
analysis. By comparing the ratio of the peak area of the sam-
ple to the internal standard and calibration curve, we obtained
the concentration of each sample.
RESULTS AND DISSCUSSION
I. Analysis Method
mAU
35
30
25
20
15
10
5
0
0 2.5 5 7.5 10 12.5 15 17.5 min
glycolic acid
malic acid
Is (maleic acid)
citric acid
lactic acid
a
b
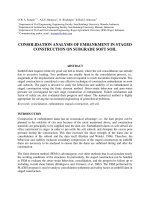
Figure 1. HPLC Chromatograms of a cream blank extract (a) and cali-
brators (b).
Conditions:column, Capcell PAK C18 UG120; mobile phase, 2% phos-
phoric acid (pH 2.0); flow-rate, 0.5 mL/min.
Journal of Food and Drug Analysis, Vol. 10, No. 2, 2002
97
The chromatography analysis was carried out through a
reverse phase C
18
column, Capcell PAK C18 UG120 S-5
µm, with 2% phosphoric acid (pH 2.0) as the mobile phase,
Maleic acid as the internal standard and detected under 210
nm. The chromatograms are shown in Figure 1. The retention
time of Glycolic acid, dl-Malic acid, Lactic acid and Citric
acid was 6.4, 7.7, 9.1 and 13.4 minutes respectively. The
retention time for the internal standard, Maleic acid, was 12.6
minutes. Through the analysis of LC-MS, the peak shown at
15.5 minutes was proved to be an impurity of dl-Malic acid,
whose detailed composition and structure needs further veri-
fication.
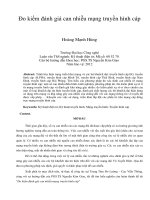
Four AHAs, Glycolic acid, dl-Malic acid, Lactic acid
and Citric acid, which were analyzed in this study, have a
chemical structure shown in Figure 2. Four AHAs are all
acidic compounds with short retention time when using
polar solvent as mobile phase and therefore, could not be sep-
arated completely. We tested the concentration and pH
impact of liquid solution on capacity factor of four AHAs for
the reference of selection of mobile phase. There was tailing
in the citric acid peak when Formic acid was used. It could
not be meliorated by changing the concentration and pH
value of formic acid. The concentration and pH value of
diluted phosphoric acid were shown to have influence on
AHAs retention time and thus, we started to discuss the
capacity factors. The pKa value of Glycolic acid, dl-Malic
acid, Lactic acid and Citric acid was 3.82, 3.40, 3.86 and 3.13
respectively, and all were larger than 3. If we controlled the
pH value under pKa, the compound molecules remained
uncharged. Therefore, we studied the influence of mobile
phase pH value on their capacity factors when 2% phosphor-
ic acid with pH value 2.0, 2.25 and 2.5 was employed. As
shown in Figure 3, the pH value of diluted phosphoric acid
affected the retention time of target compounds. The 2%
phosphoric acid (pH 2.0) gave the best separation effect.
Maleic acid and Citric acid were sensitive to pH variation in
the mobile phase. In an investigation of different concentra-
tions of diluted phosphoric acid solution (i.e., 1.0%, 1.5%
and 3.0%) when mobile phase was pH 2.5, the phosphoric
acid concentration had little effect on the retention time and
capacity factor.
When the Cosmosil 5C18-MS column was employed in
this research, it showed low separation efficiency of Maleic
acid and drag in the peak tail. This effect was improved when
Capcell PAK C18 UG120 S-5 µm (4.6
×
250 mm) was
employed. The silica surface was coated silicon polymer in
this column, which gave the advantage for eliminating the
possible cause of peak tailing, silanols. It can be operated in
wild pH range, pH 2-10 and has excellent separation effect on
polar compounds.
The linear regression equation, correlation coefficient
(r) and the limit of detection in the analysis protocol for
Glycolic acid, dl-Malic acid, Lactic acid and Citric acid stan-
dard are listed in Table 1. Within the range of concentration
of 50~500 µg/mL, all the calibration curves of Glycolic acid,
dl-Malic acid, Lactic acid and Citric acid were in good linear
correlation with correlation coefficient of 0.9992-0.9995.
II. Validation
The testing results of the interday and intraday run of
four AHAs are listed in Table 2. The relative standard devia-
tion of the interday and intraday run was between
0.05~1.49% and 0.72~3.24% which showed that the analysis
HOCH
2
COOH Glycolic acid(pKa=3.82)
Lactic acid(pKa=3.86)
Citric acid(pKa=3.13)
Malic acid(pKa=3.40)
Maleic acid(pKa=1.83)
COOH
COOH
CH
3
OH
CCH=CHCOOH
OH
CH
2
COOH
HOCCOOH
CH
2
COOH
HOCHCOOH
CH
2
COOH
Figure 2. Structure of four α-hydroxyacid and internal standard.
Figure 3. The effect of phosphoric acid pH values (2.0%) on capacity
factor.
The pH values of phosphoric acid
Capacity factor
2 2.25 2.5
1.8
1.6
1.4
1.2
1
0.8
0.6
0.4
0.2
0
Glycolic acid
Malic acid
Lactic acid
Maleic acid
Citric acid
Table 1. Calibration curve and detection limits of AHAs
AHAs Concentration (µg/mL) Regression equation r
2
Limit of detection
Glycolic acid 25, 50, 100, 200, 400, 500 Y=0.002149X+0.014272 0.9994 5 µg/mL
dl-Malic acid 25, 50, 100, 200, 400, 500 Y=0.002864X+0.029034 0.9994 5 µg/mL
Lactic acid 25, 50, 100, 200, 400, 500 Y=0.001597X+0.009457 0.9992 5 µg/mL
Citric acid 25, 50, 100, 200, 400, 500 Y=0.003842X+0.021829 0.9995 1 µg/mL
Journal of Food and Drug Analysis, Vol. 10, No. 2, 2002
98
result was good when this HPLC methodology was applied
on the assay of Glycolic acid, dl-Malic acid, Lactic acid and
Citric acid. Recoveries of AHAs in synthetic samples are
shown in Table 3. The recovery rates of these four AHAs in
cosmetics were 94.4-100.2%. The recovery rate of Glycolic
acid was 99.2 ± 0.94%, 96.3 ± 1.8% for dl-Malic acid,
99.0 ± 1.0% for Lactic acid and 97.6 ± 1.51% for Citric acid.
The R.S.D. of recovery rate in these four compounds was
0.95~1.84%.
III. The Contents of AHAs in Commercial Products
Contents of Glycolic acid, dl-Malic acid, Lactic acid
and Citric acid in samples were analyzed by HPLC after fil-
tration. The methodology was applied to analyze target com-
pounds in six different commercial products. The contents of
the commercial samples all agreed with 90-110% of the
labeled content. The results are shown in Table 4.
Chromatograms of sample ‘cream1’ and ‘essential solution’
are shown in Figure 4 and Figure 5.
This study established a feasible HPLC reverse phase
analysis method. As a whole, this analysis contributes a
good, simple, precise and fast way to identify and quantify
four AHAs ingredients in cosmetics.
ACKNOWLEDGEMENTS
We thank Taiwan Shiseido Corporation for offering
their blank cream and Taiwan Avon Corporation for their
fruit acid cosmetics. We thank Mr. L. W. Yang for his trans-
Table 2. The relative standard deviations of intraday and interday run of AHAs
AHAs Concentration Mean ± S.D.(R.S.D.%)
(µg/mL) Intraday
a
Interday
b
120 118.12 ± 0.39 (0.34) 117.02 ± 1.66 (1.42)
Glycolic acid 240 239.81 ± 0.28 (0.12) 239.71 ± 1.72 (0.72)
360 362.37 ± 0.16 (0.05) 352.20 ± 11.06 (3.14)
120 112.45 ± 0.09 (0.09) 116.17 ± 3.76 (3.24)
dl-Malic acid 240 238.00 ± 0.22 (0.09) 236.24 ± 2.18 (0.92)
360 336.15 ± 0.40 (0.12) 343.71 ± 8.19 (2.39)
120 117.18 ± 1.74 (1.49) 118.00 ± 1.29 (1.10)
Lactic acid 240 235.61 ± 1.38 (0.59) 239.03 ± 3.14 (1.31)
360 354.29 ± 3.33 (0.94) 356.50 ± 3.56 (1.00)
120 120.05 ± 0.66 (0.55) 121.00 ± 2.41 (2.00)
Citric acid 240 235.52 ± 2.95 (1.25) 236.50 ± 2.30 (0.98)
360 356.92 ± 1.25 (0.35) 351.16 ± 6.67 (1.90)
a
n=3, Repeat injection three times on the same day.
b
n=15, Repeat injection three times each day and a successive five-day.
Table 3. Recoveries of AHAs in synthetic samples
AHAs Theoretical conc. (µg/mL) Estimated conc. (µg/mL) Recovery (%) mean(%) ± S.D.
a
R.S.D. (%)
125 122.7 98.2
Glycolic acid 250 250.0 100.0 99.2 ± 0.0094 0.95
500 497.1 99.4
125 118.0 94.4
dl-Malic acid 250 241.9 96.8 96.3 ± 0.018 1.84
500 489.4 97.9
125 123.2 98.6
Lactic acid 250 250.5 100.2 99.0 ± 0.010 1.06
500 491.3 98.3
125 122.5 98.0
Citric acid 250 247.1 98.9 97.6 ± 0.0151 1.54
500 479.6 95.9
a
n=3.
Table 4. The contents of AHAs in commercial products
products
Labeled amount Found(% of labeled amount)
Glycolic acid Lactic acid Glycolic acid Lactic acid
Cream 1 2.0% 6.0% 1.9% (95.0%) 5.5% (91.7%)
Cream 2 1.0% 3.0% 0.9% (90.0%) 2.8% (93.3%)
Cream 3 4.0% 3.0% 3.7% (92.5%) 2.8% (93.3%)
Essential solution 8.0% – 7.7% (96.3%) –
Lotion 1.0% 3.0% 0.9% (90.0%) 2.8% (93.3%)
Moisture lotion (unknow) –– 0.4% 1.0%
Journal of Food and Drug Analysis, Vol. 10, No. 2, 2002
99
lation.
REFERENCES
1. Nacht, S. 1995. 50 Years of advances in skin care. Cosm.
& Toil. 110: 69-82.
2. Idson, B. 1985. “Natural” moisturizers for cosmetics.
Drug & Cosmetic Industry May: 24-26.
3. Smith, W. P. 1996. Comparative effectiveness of
α
-
hydroxy acids on skin properties. International Journal of
Cosmetic Science 18: 75-83.
4. Department of Health, Executive Yuan. 1998. The regu-
lations of the pH value, purpose and warning of the
α
-
hydroxyacids and the related compound.(Glycolic acid,
Lactic acid)Announcement NO. 87058604. Taipei.
5. Kurtzweil, P. 1998. Alpha hydroxy acids for skin care
smooth sailing or rough seas. FDA Comsumer Magazine
Mar-April: 1-6.
6. Walter, P. S. 1994. Hydroxy acids and skin aging. Cosm.
& Toil. 109: 41-48.
7. Garrett, A. W. 1997. AHAs and more. Drug & Cosmetic
Industry Jan: 8-10.
8. Buchanan, D. N., Bonasso, F. and Thoene, J. G. 1983.
Volatile carboxylic acid profiling in physiological fluids.
J. Chromatogr. 278: 133-138.
9. Fussell, R. J. and McCalley, D. V. 1987. Determination of
volatile fatty acids(C2-C5) and lactic acid in silage by gas
chromatography. Analyst 112: 1213-1216.
10. Reyes, F. G. R., Wrolstad, R. E. and Cornwell, C. J. 1982.
Comparison of enzymic, gas-liquid chromatographic,
and high performance liquid chromatographic methods
for determining sugars and organic acid in strawberries at
three stages of maturity. J. Assoc. Off. Anal. Chem. 65:
126-131.
11. Clark, T. J. and Bunch, J. E. 1997. Derivatization solid-
phase microextraction gas chromatographic-mass spec-
trometric determination of organic acids in tobacco. J.
Chromatogr. Science 35: 209-212.
12. Scalia, S., Callegari, R. and Villani, S. 1998.
Determination of glycolic acid in cosmetic products by
solid-phase extraction and reversed-phase ion-pair high-
performance liquid chromatography. J. Chromatogr. A.
795: 219-225.
13. Skelly, N. E. 1982. Separation of inorganic and organic
anions on reversed-phase liquid chromatography column.
Anal. Chem. 54: 712-715.
14. Peldszus, S., Huck, P. M. and Andrews, S. A. 1996.
mAU
70
80
60
50
40
30
20
10
0
0 2.5 5 7.5 10 12.5 15 17.5 min
Is (maleic acid)
Is (maleic acid)
citric acid
lactic acid
lactic acid
a
b
c
glycolic acid
malic acid
glycolic acid
Figure 4. HPLC Chromatograms of blank(a), four α-hydroxyacids ref-
erence and internal standard(b), commercial product-creaml (c).
0
a
b
c
2.5 5 7.5 10 12.5 15 17.5 min
0
10
20
30
40
50
60
70
80
mAU
glycolic acid
glycolic acid
malic acid
lactic acid
ls (maleic acid)
ls (maleic acid)
citric acid
Figure 5. HPLC Chromatograms of blank(a), four α-hydroxyacids ref-
erence and internal standard(b), commercial product-essential solu-
tion(c).
Journal of Food and Drug Analysis, Vol. 10, No. 2, 2002
100
Determination of short-chain aliphatic, oxo- and
hydroxy-acids in drinking water at low microgram per
liter concentrations. J. Chromatogr. A. 723: 27-34.
15. Wilson, T. D. 1985. HPLC determination of lactic acid in
milrinone injection and oral solution using ion-exchange
sample preparation methods. J. Liq. Chromatogr. 8:
1629-1650.
16. Pecina, R., Bonn, G., Burtscher, E. and Bobleter, O.
1984. High-performance liquid chromatographic elution
behaviour of alcohols, aldehydes, ketones, organic acids
and carbohydrates on a strong cation-exchange stationary
phase. J. Chromatogr. 287: 245-258.
17. Cherchi, A., Spanedda, L., Tuberoso, C. and Cabras, P.
1994. Solid-phase extraction and high-performance liq-
uid chromatographic determination of organic acid in
honey. J. Chromatogr. A. 669: 59-64.
18. Bevilacqua, A. E. and Califano, A. N. 1989. Determin-
ation of organic acid in dairy products by high perfor-
mance liquid chromatography. J. Food Sci. 54: 1076-
1079.
19. Zyren, J. and Elkins, E. R. 1985. Interlaboratory variabil-
ity of methods used for detection of economic adulter-
ation in apple. J. Assoc. Off. Anal. Chem. 68: 672-676.
20. Chen, P., Nie, L. and Yao, S. 1995. Determination of lac-
tic acid and pyruvic acid in serum and cerebrospinal fluid
by ion-exclusion chromatography with a bulk acoustic
wave detector. J. Chromatogr. B. 673: 153-158.
21. Fritz, J. 1991. Principles and applications of ion-exclu-
sion chromatography. J. Chromatogr. 546: 111-118.
22. Fischer, K., Bipp, H., Bieniek, D. and Kettrup, A. 1995.
Determination of monomeric sugar carboxylic acids by
ion-exclusion chromatography. J. Chromatogr. A. 706:
361-373.
23. Okada, T. 1988. Redox suppressor for ion-exclusion
chromatography of carboxylic acids with conductometric
detection. Anal. Chem. 60: 1666-1669.
24. Widiastuti, R., Haddad, P. R. and Jackson, P. E. 1992.
Approaches to gradient elution in ion-exclusion chro-
matography of carboxylic acids. J. Chromatogr. 602: 43-
50.
α
*
April 23, 2001 November 1, 2001
α-hydroxyacids AHAs Glycolic acid dl-Malic
acid
Lactic acid Citric acid C
18
Capcell PAK C18 UG120 S-5 µm 4.6
250 mm 2% pH 2.0 Maleic acid 210 nm
AHAs
50-500 µg/mL (r) 0.9992~0.9995
AHAs
0.05~1.49% 0.72~3.24% AHAs
96.3% 99.2%
α-hydroxyacids AHAs