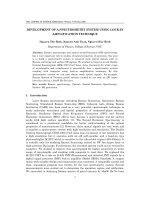
Báo cáo " Development of a spectrometry system Using lock-in amplification technique " doc
Bạn đang xem bản rút gọn của tài liệu. Xem và tải ngay bản đầy đủ của tài liệu tại đây (217.29 KB, 6 trang )
VNU. JOURNAL OF SCIENCE, Mathematics - Physics, T.xXI, n
0
2, 2005
1
Development of a spectrometry system Using lock-in
amplification technique
Nguyen The Binh, Nguyen Anh Tuan, Nguyen Huy Binh
Department of Physics, College of Science, VNU
Abstract. Raman spectroscopy and optical second-harmonic (SH) spectroscopy
has a very important role in studies of optical properties of materials. Our goal
is to build a spectrometry system to measure weak optical signals such as
Raman scattering and surface SH signals. We studied to improve an old Double
Grating Spectrograph GDM-1000 (Carl Zeiss, Jena, Germany) for wider range
of wavelengths and transformed it successfully into a spectrometry system
coupling with computer using Lock-in amplification technique. By this
spectrometry system we can now obtain weak optical signals, for example,
Raman Spectra of Vietnam petrol extracts excited by not only an 2W Argon
laser but also by a 30mW He-Ne laser.
Key words: Raman spectroscopy, Optical- Second Harmonic Spectroscopy,
Surface SH generation.
1. Introduction
Laser Raman spectroscopy including Raman Scattering, Resonance Raman
Scattering, Stimulated Raman Scattering (SRS), Coherent Anti- Stokes Raman
Scattering (CARS) has been used as a very powerful spectroscopic technique to
study molecular structures and optical properties of condensed-phase matters.
Recently, Nonlinear Optical Sum Frequency Generation (SFG) and Second
Harmonic Generation (SHG) effects have become a spectroscopic tool for surface
probe with high surface specificity [1]. The Second Harmonic Spectroscopy is
considered as a prominent candidate for better understanding of the optical
properties of nanostructures [2]. However, these optical signals are very weak and
it requires a spectrometry system with high resolution and sensitivity. The Double
Grating Spectrograph GDM-1000 (Carl Zeiss Jena Germany) of our laboratory has
a high resolution but it operates with an old self-recorder and a head-on type
photomultiplier M12FC which is sensitive to the ultraviolet region (400-550nm). It
is suitable only for studying Raman Scattering excited by 5W Ion-Argon laser or
high-pressure Hg lamps. Furthermore, the recorded spectra could not be treated by
computer. We studied to improve this spectrograph for higher sensitivity in wider
range of wavelengths and coupling with computer to treat data. We replaced the
M12FC PMT by a side-on R-928 PMT (Hamamatsu) and detected PMT signals by a
digital signal processor (DSP) lock-in amplifier (Model SR830, Stanford). A stepper
motor with suitable design and construction was connected. A compatible control and
data- acquisition program was written for the new spectrometry system. Several
measurements were carried out to determine the operation regime and calibration.
We succeeded in obtaining Raman spectra of petrol extracts by 30mW He-Ne laser
Nguyen The Binh, Nguyen Anh Tuan, Nguyen Huy Binh
2
excitation. Our new spectrometry system shows many advantages for studying
Raman and Fluorescence spectra as well as weak optical signal spectra in general.
2. Construction of the improved Spectrometry system
Our experimental setup of the improved spectrometry is shown in Fig.1. The
monochromator GDM-1000 consisting of two 650lines/mm gratings can operate in
spectrum region of 7500 -16675 cm-1 (for the first order of the grating) and in the
region of 16675- 28700 cm-1 (for the second order of grating). The optical schematic
of the GDM-1000 is given in Fig.2. We removed the self-recorder and studied to
couple the spectrograph with computer.
A stepper motor of 1.8o /step
was installed in a suitable
position to rotate the grating for
wavelength scanning. One step of
the motor corresponds to
0.0832cm-1.
In the circuit controlling
stepper motor through parallel
port of computer, a sequence of
digital signals is sent to LPT port:
0001;0011;0010;0110;0100;1100;1
000;1001 corresponding to
positions steps 1→ 2→ 3 →4 →5
→6 →7 →8 (Fig.3) [3].
The head-on type photo multiplier M12FC of the GDM-1000 spectrograph is
sensitive in region of 400-550nm wavelengths (Fig.4a). For the longer wavelength
Fig. 2: Schematic of GDM-1000
1-input slit;
2,5 -mirrors; 4-chopper;
3,6- Gratings;
7- output slit
1
3
5
2
6
7
4
Fig.1: Experimental setup of the spectrometry system
SR830
lock-in
amplifier
GDM -1000
GPIB
interface
LPT
Port
Spectral
Signal
Step
Motor
CPU
Signal In
Chopper
Signal
Fig.3: Diagram of stepper motor controller
Development of a spectrometry system using lock-in…
3
response up to 900nm, we replaced the M12FC PMT by a side-on R-928 PMT
(Hamamatsu). The spectral response characteristics of R-928 PMT is given in
Fig.4b. This side-on R-928 PMT employs a reflection-mode photo cathode and a
circular-cage structure electron multiplier which has good sensitivity and high
amplification at a relatively low supply voltage. A DP-type socket (C6270-
Hamamatsu) with built-in voltage divider and power supply was used to operate
the R-928 PMT. The C6270 socket has input voltage of 15V±1Vdc and give output
voltage of 0-1250 Vdc .
Spectral signals from PMT were detected by a DSP lock-in amplifier (Model
SR830, Stanford). The block diagram of the SR830 lock-in amplifier was presented
in Fig 5. The SR830 has five boards: Key board, display board, Analog Input board,
DSP Logic board and CPU and Power supply board. The DSP logic board takes a
digital input from the A/D converter on the Analog Input board and perform all of
the computations related to the measurements before it is displayed on the screen.
This includes generating the digital reference sine wave, demodulating the signal,
low-pass filtering the results, and offset and expanding the outputs. The internal
oscillator sine output and AUX D/A outputs are generated on this board. The
reference phases lock loop control the clock of this board whenever the reference
mode is external. These functions are implemented within a system comprised of
five function blocks: the digital signal processor (DSP), the DAC outputs, the timing
signal generator, the reference clock generator and the I/O interface. Through the
use of highly efficient algorithms, the system is capable of real-time lock-in
operation to 100kHz with 24dB/oct filtering on both X and Y as well as providing a
synthesized analog sine output. The SR830 utilizes a Motorola 24-bit DSP56001
digital signal processor (U501). The DSP is configured without external memory.
The lock-in algorithms run entirely within the internal program and data memory
of the DSP itself. The host processor bus is connected to the main CPU board via
the I/O interface on the DSP logic board. The 80C186 processor on the CPU board
acts as the “host” processor to the DSP.DSP firmware and commands are
downloaded from the CPU board to invoke different operating modes. The analog
input board provides the very important link between the input spectral signal and
the SDP processor. From the front panel BNC the spectral signal passes through a
low distortion front-end amplifier, gain stages, notch filters, anti-aliasing filter and
Relative sensitivity
Fig.4 : Spectral sensitivity of the M12FC (a) and the R-928 PMT (b)
(a)
(b)
Wavelength (nm)
Nguyen The Binh, Nguyen Anh Tuan, Nguyen Huy Binh
4
finally an A/D converter. Once converted to digital form, the input signal is ready to
be processed by the Digital Signal Processor.
The SR830 DSP Lock-in Amplifier can be remotely programmed via either the
RS232 or GPIB (IEEE-488) interfaces. Any computer supporting one of these
interfaces may be used to program the SR830. Both interfaces are receiving at all
times, however, the SR830 will send responses to only one interface. We could
specify the output interface with the [Setup] key or use the OUTX command at the
beginning of every program to direct the responses to the correct interface.
Fig 5: The block diagram of the SR830 lock-in amplifier
In this research, a GPIB card is used to communicate between computer and
SR830. Before attempting to communicate with the SR830 over the GPIB interface,
the SR830's device address must be set. The address is set with the [Setup] key and
may be set between 1 and 30. Communications with the SR830 uses ASCII
characters. Commands may be in either upper or lower case and may contain any
number of embedded space characters. A command to the SR830 consists of a four
characters command mnemonic, arguments if necessary, and a command
terminator. The SR830 has a 256 character input buffer and processes commands in
the order received. Similarly, the SR830 has a 256-character output buffer to store
outputs until the host computer is ready to receive. Detailed command list can be
seen in reference [4]. A computer program (named Spectra-Department of Quantum
Optics-VNU) was written coding in Visual Basic to control the spectrum
measurement procedure and data- acquisition. The interface of this program is
presented bellow.
Low Noise
Differential
Amp
Voltage
A
B
Current I
Reference
In
Si
Phase
Shifter
Low
Pass
Filter
Gain
DC Gain
Offset
Ex
p
and
Y Ou
t
R
∅
X Out
Sine Ou
t
TTL Out
Discriminato
r
DC Gain
Offset
Expand
Phase
Sensitive
Detector
Phase
Sensitive
Detector
Low
Pass
Filter
90
0
Phase
Shifter
Internal
Oscillator
Phase
Locked
Loop
100/120 HZ
Notch
Filter
50/60 HZ
Notch
Filter
PLL
Discriminato
r
R and
∅
Calc
Development of a spectrometry system using lock-in…
5
Fig.6: The interface of the spectrum measurement procedure
3. Spectrum measurements
Fig 7: Raman spectra of petrol extract samples
a-Sample 5B110 excited by Argon laser; b- Sample 5B110 excited by He-Ne laser
c-Sample 5B115 excited by Argon laser; d- Sample 5B115 excited by He-Ne laser
We carried out several spectrum measurements to determine the operation
regime and calibration of the improved spectrometry system, for examples,
fluorescence spectra of Mn-doped ZnS, Stokes and Anti-Stokes Raman scattering
spectra of some typical Hydrocarbons excited by Argon laser and He-Ne laser. Our
Nguyen The Binh, Nguyen Anh Tuan, Nguyen Huy Binh
6
new spectrometry system shows high sensitivity and resolution and many
advantages for studying Raman and Fluorescence spectra. We succeeded in
obtaining Raman spectra of petrol extracts by 30mW He-Ne laser excitation. The
high sensitivity of this spectrometry system in the Red and IR -spectrum region
gives the capacity to study the Raman spectra of weak intensity excited by a
medium power He-Ne laser instead of CW-high power water - cooled Ion-Argon
laser. Furthermore, there was not Fluorescence spectrum profile in Raman spectra
excited by He-Ne laser of 632,8nm wavelength. In many cases of Raman spectrum
studies, the excitation by near UV- Argon laser results in fluorescence which
overlaps Raman spectrum. This was proved very clearly in the Raman spectra of
the petrol extract sample 5B110 and 5B11 (petrol extracts from Bach Ho, Vietnam).
The Raman spectra excited by He-Ne laser showed more Raman peaks, that means
more information, in comparison with Argon laser excitation (Fig.7)
4. Conclusion
We improved an old Double Grating Spectrograph GDM-1000 (Carl Zeiss,
Jena, Germany) for high sensitivity in wider range of wavelengths and transformed
it successfully into a high resolution spectrometry system coupling with computer
using Lock-in amplification technique. This is an economic solution and very
suitable for teaching and research in Universities. By this spectrometry system we
can now obtain weak optical signals, for example, Raman Spectra of Vietnam petrol
extracts excited by a 30mW He-Ne laser instead of Ion Argon laser. The Raman
excitation by He-Ne laser showed many advantages in comparison with Argon laser
excitation.
Acknowledgements: This work is supported by the Natural Science Research Program
of VNU (QG-04) and the National Basic Science Research Program of Vietnam.
References
1. Nguyen The Binh, Surface probe by second harmonic generation,
Advances in Photonics and Applications, (2004), pp.75-81. Proceeding of
the International Workshop on Photonics and Applications, Hanoi (IWPA-
2004).
2. Takeshi Kitahara, Goro Mizutani, Optical second-harmonic spectroscopy
of Au nanowires, Journal of Applied physics, Vol. 95. No9(2004).
3. Bhaskar Gupta, Understanding various types of Stepper Motors And
Controlling it through Parallel Port, Homepage:
(2004).
4. Stanford Research Systems, Model SR830 DSP Lock-in Amplifier, (1993),
5.1 - 5.34
5. Halina Baranska, Laser Raman spectrometry, John Wiley& sons Warsaw
1987.