Báo cáo "Investigation of the embedded fiber bragg grating temperature sensor " pdf
Bạn đang xem bản rút gọn của tài liệu. Xem và tải ngay bản đầy đủ của tài liệu tại đây (131.61 KB, 6 trang )
VNU Journal of Science, Mathematics - Physics 23 (2007) 237-242
237
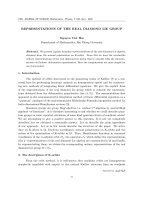
Investigation of the embedded
fiber bragg grating temperature sensor
Tran Thi Tam
1,*
, Dang Quoc Trung
2
, Tran Anh Vu
2
, Le Huu Minh
2
, Do Ngoc Chung
2
1
Department of Engineering Physics and Nano-Technology , College of Technology, VNU
144 Xuan Thuy, Cau Giay, Hanoi, Vietnam
2
Institute of Materials Science, Vietnam Academy of Science and Technology
Hoang Quoc Viet, Cau Giay, Hanoi, Vietnam
Received 5 November 2007; received in revised form 27 December 2007
Abstract. An embedded fiber Bragg grating (FBG) sensor, which fabricated in IMS, for
temperature sensing was proposed. The temperature responses of the in-fiber Bragg gratings
(FBGs) have been investigated. It was found that these responses ranged from 10.6 pm/°C to 12.0
pm/°C. The temperature sensitivity of the FBGs was 0.2°C. The strain responses remained
temperature independent over a temperature range of 20 – 180
◦
C. The results obtained are in
agreement, within the experimental error, with predictions based on material parameters. Although
the temperature response is nonlinear over the temperature range 20 °C to 180 °C, in practical
systems the temperature response of the sensor may be assumed to be linear within the
temperature range 20 °C to 80 °C.
Keywords: Fiber Bragg Grating (FBG), sensor, strain, temperature sensor
1. Introduction
The Fiber Bragg Grating (FBG) first presented by Hill et al. [1] in 1978 is a structure on an
optical fiber in which the refractive index of a fiber core is periodically modulated with a pitch Λ
(Figure 1).
The index modulation is induced by exposing the fiber to an interference pattern formed
between interfering ultraviolet (UV) beams of light by double-beam or phase mask technique. The
center wavelength of the reflection λ
B
is named “Bragg wavelength”. The Bragg wavelength is
B
2n
λ = Λ
(1)
where n is the effective refractive index of the fiber core. The FBG forms a distributed reflector, acting
as a narrow band channel dropping spectral filter in transmission, and as a narrow band reflection
filter. The typical bandwidth of the reflected light is about 0.1 nm to 0.3 nm. The reflected Bragg
wavelength is dependent upon the pitch of the grating, and is sensitive to strain and temperature
according to the relationships:
(
)
(
)
B BT BS B B
T 1
α
∆λ =∆λ +∆λ =λ α+ξ ∆ +λ −ρ ∆ε
(2)
______
*
Corresponding author. E-mail: ;
Tran Thi Tam et al. / VNU Journal of Science, Mathematics - Physics 23 (2007) 237-242
238
where ∆λ
BS
and ∆λ
BT
are the strain and
temperature induced Bragg wavelength
shifts, λ
B
is the Bragg wavelength, ρ
α
is
the photoelastic coefficient of the fiber,
α is the coefficient of thermal expansion
and ξ is the thermo-optic coefficient. A
change in the effective refractive index
and/or the grating period will cause a
shift of the Bragg wavelength. Sensing
principle is based on that shift of the
Bragg wavelength in response to
applied strain, temperature or pressure
changes.
FBG sensor is one of the most
attractive optical fiber sensors because
of simplicity in structure and suitability
for multiplexed and
distributed/multipoint sensing
applications, and to the fact that sensing information is encoded in an absolute parameter, namely the
resonant wavelength. The measurand is transduced to the wavelength of light reflected by the FBG, an
absolute parameter, eliminating errors associated with drift of the zero point of the measurement,
common in strain gauge systems in which the gauge and lead wires see varying and differential
thermal environments. FBG sensors exhibit many other distinguishing features such as, small size,
light mass and high resolution, suitability for remote measurement. It can be used with great
advantages over electronic sensors for in situ sensing to monitor or measurement in harsh
environments or hazardous environment, due to its immunity against electromagnetic fields, humidity,
nuclear radiation and the most chemical materials [2]. The most common advantageous application of
the FBG is a smart monitoring for civil engineering, buildings and bridges; oil, gas, or electrical power
generation industries [3,4]. The application to geophysical exploration/monitoring is one of the
promising applications to take advantages of fiber sensors. FBGs are sensitive only to the environment
experienced along the gauge length of the sensor, typically of the order of 5 – 10 mm. The small
dimensions of the fiber allow the monitoring of structures with very close clearances.
This paper describes performance of a prototype of the FBG temperature sensors at
temperatures up to 220°C. The system consists of fibers with FBGs and the surface parts include an
optical source, detectors, optical couplers and an optical spectrum analyzer for monitoring.
2. Experiments
The FBGs were fabricated in the Institute of Materials Science (IMS in Hanoi) with reflectivity
of approximately 30%, and had a Bragg wavelengths laying from 1530 nm to 1570 nm. Experimental
device consists of an Erbium-doped Super Fluorescent Source (SFS), FBG sensors, a temperature
controlled pad or liquid bath and temperature monitor. The FBG reflected signals is fed to an Optical
Spectrum Analyzer (OSA) AGILENT 86142B to locate the Bragg wavelength and monitor
wavelength shifts. A schematic of the system is shown in figure 2.
Fiber Bragg Grating
Optical Fiber
Transmitted
λ
λ
Incident
Reflecte
d
λ
B
Pitch Λ
Fig. 1. Structure of the Fiber Bragg Grating.
Tran Thi Tam et al. / VNU Journal of Science, Mathematics - Physics 23 (2007) 237-242
239
The SFS consists of an Erbium-doped fiber
pumped by a 980 nm Laser Diode through
wavelength division multiplier (WDM). The
output from a SFS is coupled to a FBG sensor by
fc/apc connector. The light reflected from the
sensors is directed to OSA through 1550 nm
output port of the WDM . The resolution of the
optical spectrum analyzer was 0.06 nm, and the
peak wavelength was displayed to the order of
0.001 nm. The FBG temperature was monitored by a Platinum 1000 Ω resistive thermo-sensor (Pt
RTD-EPHY-MESS GmbH) with a limit deviation of 0,15°C for 0°C ÷ 100°C range and 0.25°C for a
range above 100°C. A glass thermometer with graduation of 0.5°C also was used for comparison for
temperature below 120°C. The tip of the thermo sensor was assembled close to the grating, so that the
reading temperature in the thermo sensor indicated the actual temperature of the FBG. Both sensors
then were attached to small metal strip formed a probe and placed in investigated environment. The
experiments were carried out in different environments (air, solid as well as in liquid environments).
The temperature set by controlled heating source, had been tuned in small increments and fixed
in about 15 min to allow achieving thermal equilibrium for measuring the sensor’s characteristic. In
the experiment with liquid environment, the probe containing the FBG was immersed into a water bath
heated by an electrical heater, the FBG temperature changed from -6°C to 100°C. For the air
environment we put the probe inside small closed oven, its temperature were changed from 20°C to
220°C. As to solid environment case we used copper pad with temperature controlled by Peltier cooler
in a range -1 ÷ 60°C and by heating gun with maximum temperature up to 400°C.
3. Results and discussion
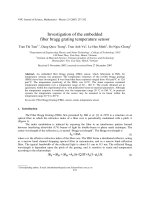
Figure 3 shows the thermal shift of the Bragg wavelength for the FBG sensor with center
wavelength of 1548.61nm at 25°C, fitted by linear equation. With the increase of the FBG
temperature, the Bragg wavelength shifts to the longer direction. The temperature sensitivity is 11.8
pm/°C. For all tested FBG’s sensors the observed sensitivity ranged from 10.6 pm/°C to 12.0 pm/°C.
The detection sensitivity of the temperature measurement using OSA demodulation is around 0.2 °C
based on wavelength resolution ± 1pm of the device.
The temperature sensitivity of a FBG sensor could be enhanced by combining with the
wavelength shift under strain due to thermal expansion and with the one due to temperature induced
refractive index change. The FBG was embedded in the copper base of thickness 0.5 mm. The
embedded length was 55mm. The copper strip then had been changed to an Aluminum alloy strip of
the same 0.5 mm thickness. The result plotted in figure 4 shows the wavelength shift for a bar FBG
sensor (FBG1) and those which are embedded in Cu (FBG2) and Al base (FBG3) over a temperature
range of 30°C to 150°C with center wavelength of 1530.4 nm at 25°C. The wavelength shift observed
for bar FBG is dominated by the thermo-optic coefficient of the fiber with a contribution the thermal
contraction of the fiber itself, while for embedded FBGs the thermal expansion of the substrate is
dominated over the thermal contraction of the fiber, and the wavelength shift is governed by the strain
induced by the substrate thermal expansion and thermo-optic coefficient. The temperature sensitivity
of embedded cases increased to 14.6 pm/°C for FBG with Cu base and 28.2 pm/°C for an Aluminum
alloy base.
Fig. 2. A schematic of the experiment.
Er-doped SFS
WDM
P
ump
OSA
FBG
sensor
Tran Thi Tam et al. / VNU Journal of Science, Mathematics - Physics 23 (2007) 237-242
240
The theoretical
wavelength shifts due to
thermal expansion’s strain,
calculated from the thermal
expansion coefficients
quoted in reference [5] and
from the measured
wavelength shift due to
strain response of the FBG
are plotted for comparison
in Fig.5. The data shows a
reasonable agreement
between the theoretical and
experimental response for
Cu base. For an Aluminium
alloy base it deviates more.
This discrepancy between
the measured FBG data and
the theoretical prediction
may be a result of the
dependence of thermal
expansion coefficient of the
alloy on temperature. The
temperature sensitivity of
the Bragg wavelength arises
from the change in period
associated with the thermal
expansion of the fiber,
coupled with a change in the
refractive index arising from
the thermo-optic effect. The
strain sensitivity of the
Bragg wavelength arises
from the change in period of
the fiber, coupled with a
change in the refractive
index arising from the
strain-optic effects. So, the
Bragg wavelength shifts
exhibited by FBG2 and
FBG3 are determined by the
strain imposed by the
thermal contraction of the sample to which each is attached, and by the refractive index change of the
core, determined by the thermo-optic coefficient, while FBG1 wavelength shift is governed by thermal
strain of the fiber and refractive index change of the core only. Some authors mentioned about a
λ
B
= 1548.61 @ 25˚C
1548.00
1548.50
1549.00
1549.50
1550.00
1550.50
1551.00
0 40 80 120 160 200
Temperature (˚C)
Bragg Wavelength λ
B
(nm)
Fig. 3. The wavelength shift of the FBG sensor temperature. The
experimental data set was fitted by first order equations.
1530.0
1530.5
1531.0
1531.5
1532.0
1532.5
1533.0
1533.5
1534.0
20 40 60 80 100 120 140 160
Temperature (˚C)
Wavelength (nm)
FBG1 FBG2 FBG3
Fig. 4. The wavelength shift for a bar FBG sensor (FBG1) and those which
are embedded in Cu (FBG2) and Al base (FBG3). The experimental data
sets
were fitted by first order equations.
Tran Thi Tam et al. / VNU Journal of Science, Mathematics - Physics 23 (2007) 237-242
241
thermal dependence of the strain sensitivity of an FBG, which would be a result of the temperature
dependence of the stress-optic coefficient of silica glass. They found that the strain response changed
on average by 0.21 ± 0.03 fm µε−1
◦
C−1 over a range of temperatures between 100–400
◦
C [6].
However, this nearly negligible temperature dependence has not been observed in our experiments.
The responses of the FBG to strain measured at a range of temperatures between 20°C and 180°C can
be considered as temperature independent within the accuracy limits of the experiment and equals
5.247 nm/mm or 1.1 pm/µε.
It was observed that the temperature dependence of the thermo-optic coefficient is linear over
the temperature range 20°C to 220°C at a wavelength of 633 nm in unbuffered single-mode fiber [7].
However, the magnitude of the average thermo-optic coefficient is known to decrease at longer
wavelengths, therefore it is possible that the temperature dependence of the thermo-optic coefficient
will also be different at longer
wavelengths. Thus it is
meaningful to find out any
nonlinear effect for FBG sensors
at 1550 nm. A nonlinear
temperature response was
suggested in a study of the
temperature dependence of
gratings in highly doped Ge fibers
[8]. The authors observed a linear
temperature response over the
temperature range 296–576°K,
the nonlinear temperature
response was indicated only by a
single measurement at 77°K. The
authors of Refs. 9-11 also
reported measurements of
hydrogenated single-mode
telecommunication fiber (SMF28)
fiber that suggested a nonlinear wavelength response; however, only three measurement points were
presented over the temperature range 77–573°K. Therefore the origins of the nonlinearity were not
clearly established. It may be the same nonlinearity at cryogenic temperatures [10].
The nonlinear temperature dependence of the Bragg wavelength is most likely due to the
temperature dependence of the thermo-optic coefficient, provided that any other nonlinearity in the
reported experimental systems is accounted for. Our data also showed small nonlinearity of the
thermal response of the Bragg wavelength over 20°C to 180°C temperature range. The second order
polynomial least-squares (SOLSQ) fit of the data gave good regression coefficient R
2
– discrepancy in
the order of 10
-4
(R
2
= 1 indicates a perfect fit). A temperature range for typical FBG sensing and
communications applications is about 20°C to 80°C. Our result has showed that within this
temperature range the linear fit of the data is acceptable for practical use. For the bar FBG sensor the R
square value decreases less than 5.10
-3
: R
2
= 0.9997 of linear fit compared to R
2
= 0.9999 of SOLSQ
for whole 20°C to 180°C temperature range. For embedded in Cu base FBG the R
2
of linear fit is
0.9983 in 20°C to 80°C range compared to R
2
= 0.9994 of SOLSQ and R
2
= 0.9963 of linear fit for
whole 20°C to 180°C. Such value may be explained by insignificant dependence of the fiber thermo-
optic coefficient from temperature. For embedded sensors the temperature dependence of the thermo
0.0
0.5
1.0
1.5
2.0
2.5
3.0
3.5
4.0
20 40 60 80 100 120 140
Temperature (˚C)
wavelength shift (nm)
FBG2 Cu_base_Predict FBG3 Al_base_Predict
Fig. 5. The measured shift and prediction data for embedded in Cu and
Al base FBG sensors.
Tran Thi Tam et al. / VNU Journal of Science, Mathematics - Physics 23 (2007) 237-242
242
expansion coefficient of the base may add the extra nonlinearity in the shift. The theoretical prediction
of the nonlinearity in the thermal response of the Bragg wavelength was described in [11,12]. The
sensor’s stability depends highly on the thermal stability of the experiment environment. Averaging
over 50 events in experiment with Peltier cooler in good isolated space yielded the stability of 1 pm,
which is approximately equivalent to the temperature sensitivity. In other cases the stability was of
about 10 pm. This change may be addressed the thermal convention inside experiment volume.
Based on received FBG characteristics in this paper two designs of the sensor were presented:
1. a miniature tube with the sensor ends inside and 2. a Copper or Aluminum tube with the embedded
sensor. These sensors can be multiplexing in line with other following FBG strain or temperature
sensors.
4. Conclusion
The temperature responses of the in-fiber Bragg gratings (FBGs) have been investigated. It was
found that these responses ranged from 10.6 pm/°C to 12.0 pm/°C. The temperature sensitivity of the
FBGs was 0.2°C. The strain responses remained temperature independent over a temperature range of
20°C – 180°C. The results obtained are in agreement, within the experimental error, with predictions
based on material parameters. Although the temperature response is nonlinear over the temperature
range 20°C to 180°C, in practical systems the temperature response of the sensor may be assumed to
be linear within the temperature range 20°C to 80°C.
Acknowledgements. This paper was supported by QC 0623 program of College of Technology, VNU
Hanoi. The authors acknowledge provision of funding by the QC 0623 program.
References
[1] K.O. Hill, Y. Fujii, D.C. Johnson, B.S. Kawasaki, Appl. Phys. Lett. Vol. 32 (1978) 647.
[2] M. LeBlanc, S.Y. Huang, M. Ohn, R.M. Measures, A. Guemes, A. Othonos, Opt. Lett. 21 (1996) 1405
[3] S.T. Vohra, M.D. Todd, G.A. Johnson, C.C. Chang, B.A. Danver, 13th Internat. Conf. Optical Fiber
Sensors (1999) 32.
[4] T. Mizunami, H. Tathata and H. Kawashima, Meas.Sci.Technol. 12 (2001) 914.
[5] Free database of engineering properties of materials ()
[6] Martin J. O’Dwyer, Chen-Chun Ye, Stephen W. James, Ralph P. Tatam, Meas. Sci. Technol. 15 (2004) 1607.
[7] T.S. Priest, K.T. Jones, G.B. Scelsi, G.A. Woolsey, “Thermal coefficients of refractive index and expansion
in optical fibre sensing,” in Optical Fiber Sensors, OSA Technical Digest Series _Optical Society of
America, Washington, D.C. Vol. 16 (1997)
[8] A. Hidayat, Q. Wang, P. Niay, M. Douay, B. Poumellec, F. Kherbouche, I. Riant, Appl. Opt. 40 (2001) 2632.
[9] S. Gupta, T. Mizunami, T. Yamao, T. Shimomura, Appl. Opt. 35 (1996) 5202.
[10] S.W. James, R.P. Tatam, A. Twin, M. Morgan, P. Noonan, Meas. Sci. Technol. 13 (2002) 1535.
[11] M.B. Reid, M. Ozcan, Opt. Eng. 37 (1998) 237.
[12] G.M.H. Flockhart, W.N. MacPherson, J.S. Barton, J.D.C. Jones, L. Zhang, I. Bennion, Technical Digest:
15th International Conference on Optical Fiber Sensors, 75 Portland, OR, 6–10 May (2002) 75.