Accounting for decision making - MBA assignment
Bạn đang xem bản rút gọn của tài liệu. Xem và tải ngay bản đầy đủ của tài liệu tại đây (523.07 KB, 23 trang )
i
MASTER OF BUSINESS ADMINISTRATION
INTERNATIONAL PROGRAM
ASSIGNMENT
ACCOUNTING FOR DECISION MAKING
Submitted to: Dr. Pham Thi Ngoc Bich
Submitted by:
ID No.:
Class: MBAOUM…
Ho Chi Minh City, October 2013
ii
Table of Contents
Task 1: CVP analysis 1
Task 2: Contrasting ABC and traditional costing 5
Task 3: Flexible budget and flexible budget performance report 12
Task 4: Cash Budget and Control 16
References 21
1
Task 1: CVP analysis:
Summarize information:
Sales price per pair of sandals (units)
$40
Variable costs per pair of sandals (units)
$25
Fixed costs per year
Building rental
$15,000
Equipment depreciation
$7,000
Selling
$20,000
Administrative
$18,000
Total fixed costs
$60,000
1) Break-even in units and sales dollars:
- Break-even in units =
=
$ ,
$ $
= 4,000 pairs
- Break-even sales dollars = =
Whereas:
CM ratio =
Contribution margin per unit (UCM) = Price – Variable cost per unit
= $40 - $25 = $15
2
CM ratio =
$
$
= 0.375 or 37.5%
Break-even sales dollars =
$ ,
.
= $160,000
2) Angie has decided that she must earn at least $15,000 in the first year to justify her
time and effort:
=> The number of units to earn target income =
=
=
$ , $ ,
$
= 5,000 pairs
3) Angie now has two salespersons working in store – one full time and one part time. It
will cost her an additional $8,000 per year to convert the part-time position to a full-
time position. Angie believes that the change would bring in an additional $25,000 in
sales each year.
- Additional sales = $25,000
- Additional fixed costs = $8,000
- Additional CM = Additional sales x CM Ratio = $25,000 x 0.375 = $9,375
- Additional Net Income = Additional CM – Additional fixed costs
= $9,375 - $8,000 = $1,375 (positive)
Therefore, she would convert the part-time position to a full-time position.
4) Refer to the original data and ignore the proposition in question c. During the first year,
the store sold only 5,000 pairs of sandals.
3
a) Prepare the income statement in a contribution format for the Sandal Shop’s first
year:
Sales (= 5,000 x $40)
$ 200,000
Less: Variable costs (= 5,000 x $25)
$ 125,000
Contribution margin
$ 75,000
Less: Fixed costs
$ 60,000
Operating income
$ 15,000
b) Angie is confident that with a more intense sales effort and with a more creative
advertising she can increase sales by 20% next year:
Degree of operating leverage (DOL) =
=
$ ,
$ ,
= 5 times
Percentage change in operating income = DOL x Percent change in sales
= 5 x 20% = 100%
5) “CVP” analysis is a useful planning tool because it is so accurate”. In my opinion,
CVP is useful but it does not base on its accurate because it depends on forecasts,
assumption and estimates.
For example, it is assumed that fixed costs are constant, and that both the variable cost
and the revenue curves are linear over the relevant volume of output. In reality, fixed
costs may not remain constant over the entire output range considered in the analysis, that
being particularly true if the volume range considered is quite wide. Fixed costs may
indeed be constant over a band of output, but then will increase sharply and remain
4
constant for another stage. To retain the usefulness of CVP analysis, it is necessary to
limit the volume range to be examined so that the behavior of both fixed and variable
costs may be more accurately determined. The basic assumption that CVP is a linear
relationship is realistic only over narrow ranges of output which is called the relevant
range.
However, the real usefulness of CVP is that it enriches the understanding of the
relationship between costs, volume and prices as factors affecting profit, enabling
management to make assumptions which will help the decision-making process in the
short-run planning period. Usefulness of CVP analysis is not based on its “accuracy”.
The calculation is valid as long as those assumptions hold true. CVP analysis can be
useful to help answer queries such as:
- How many units need to be sold or services performed to break even?
- What is the impact of a change in the mix between fixed and variable costs?
- How many units need to be sold or services performed to achieve a particular level of
profit?
- Which products or services are contributing best to the profit performance?
Etc.,
Therefore, CVP analysis is an important tool in planning and decision making but it is not so
accurate.
5
Task 2: Contrasting ABC and traditional costing:
Summarize information with calculation in which is appropriated:
Unit cost and revenue
Standard
Briefcases
Specialty
Briefcases
Selling price per unit
$
36
$
40
Unit product cost
35
25
Gross margin per unit
$
1
$
15
Manufacturing cost
Units produce each month
10,000
2,500
Direct materials:
Leather
$
15.00
$
7.50
Fabric
5.00
5.00
Synthetic
-__
5.00
Total Direct materials
$
20.00
$
17.50
Direct labor (0.5 DLH and 0.25DLH @ $12
per DLH)
6.00
3.00
Manufacturing overhead
(0.5DLH and 0.25 DLH @ $18 per DLH)
9.00
4.50
Total cost per unit
$
35.00
$
25.00
Manufacturing overhead
$
101,250
Direct labor hours
DLHs
5,625
Predetermined overhead rate
$
18
6
Standard
Briefcases
Specialty
Briefcases
a. Produced in batches of
units
200
units
25
No of Setups
50
100
Times for setups
hrs
1
hrs
2
b. Times for inspection/month
hrs
300
hrs
500
c. Machine times
hrs
0.5
hrs
2
d.
Activity cost pools
Activity measures
Estimated
overhead costs
Purchasing
No of orders
12,000
Material handling
No of receipts
15,000
Production orders and setup
Setup hours
20,250
Inspection
Inspection hours
16,000
Frame assembly
Assembly hours
8,000
Machine related
Machine hours
30,000
$101,250
Expected Activity
Activity Measure
Standard Briefcases
Special
Briefcases
Total
No of orders:
82
118
200
Leather
34
6
40
Fabric
48
12
60
Synthetic
-
100
100
No of receipts
116
184
300
Leather
52
8
60
Fabric
64
16
80
Synthetic
-
160
160
Setup hours (=Time for setups x
no. of setups) *
50
200
250
Inspection hours (=Time for
inspection/month) **
300
500
800
Assembly hours
800
800
1,600
Machine hours (=Machine time x
units produced per month) ***
5,000
5,000
10,000
7
(*) Setup hours = Time for setups x number of setups
Therefore, we have:
- Setup hours for Briefcase = 1 x 50 = 50 hours
- Setup hours for specialty Briefcase = 2 x 100 = 200 hours
(**) Inspection hours are equal to Time for inspection per month given in part b.
(***) Machine hours = Machine time x units produced per month
Machine hours for Briefcase = 0.5 x 10,000 = 5,000 hours
Machine hours for Briefcase = 2 x 2,500 = 5,000 hours.
1) Using ABC, determine the amount of manufacturing overhead cost that could be
allocated to each standard briefcase and each specialty briefcase:
St. B: Standard Briefcases
Sp. B: Specialty Briefcases
AR: Activity Rate
- Activity Rate =
For example, Activity rate for purchasing =
,
= 60
Similar calculation method for each of Activity costs pools to find out AR
- Consumption Ratio for purchasing =
= = 0.41 or 41%
Similar calculation for the rest to find out Consumption ratio for each activity cost pools.
8
- Overhead allocated for each kind of Briefcases = Cost Driver for each kind of
Briefcases x AR (which is based on each activity pools).
- Overhead per unit =
Total overhead costs
Number of units
Cost Driver
Consumption
Ratio
Overhead
Allocated
Activity
cost pools
Overhead
Cost
Activity
measures
St. B
Sp. B
Total
AR
St. B
Sp. B
St. B
Sp. B
Purchasing
12,000
No of
orders
82
118
200
60
0.41
0.59
4,920
7,080
Material
handling
15,000
No of
receipts
116
184
300
50
0.39
0.61
5,800
9,200
Production
orders and
setup
20,250
Setup
hours
50
200
250
81
0.20
0.80
4,050
16,200
Inspection
16,000
Inspection
hours
300
500
800
20
0.38
0.63
6,000
10,000
Frame
assembly
8,000
Assembly
hours
800
800
1,600
5
0.50
0.50
4,000
4,000
Machine
related
30,000
Machine
hours
5,000
5,000
10,000
3
0.50
0.50
15,000
15,000
Total
overhead
costs
$101,250
$39,770
$61,480
Number of
units
10,000
2,500
Overhead
per unit
$3.98
$24.59
9
2) Determine the unit product cost of each product line from the perspective of the ABC
system:
Standard
Briefcases
Specialty
Briefcases
Units produce each month
10,000
2,500
Direct materials:
- Leather
15.00
7.50
- Fabric
5.00
5.00
- Synthetic
____
5.00
Total Direct materials
$ 20.00
$ 17.50
Direct labor (0.5 DLH and
0.25DLH @ $12 per DLH)
6.00
3.00
Manufacturing overhead*
3.98
24.59
Total cost per unit
$ 29.98
$ 45.09
(*) Manufacturing overhead is taken from calculation in part 1.
3) Within the limitations of the data that have been provided. Evaluate the president’s
concern about the profitability of the two product lines. Write a brief memo to the
president giving your opinion about the president’s decision on shifting the company’s
resources entirely to production of specialty briefcases and providing the arguments for
your opinion.
From using ABC system to determine the unit product cost of each product line, we have
the information that costs for producing Special Briefcase is so high compare to the
previous breakdown. To manufacture each Special Briefcases, it costs for $45.09 instead
10
of $25.00, while the standard briefcase cost $29.98, instead of $35. We estimate gross
margin for specialty briefcases and for standard briefcases as the following:
Unit cost and revenue
Standard
Briefcases
Specialty
Briefcases
Selling price per unit
$
36
$
40
Unit product cost
29.98
45.09
Gross margin per unit
$
6.02
$
(5.09)
Therefore, the view of president was wrong when he said that the company can get $15
per unit on special briefcases.
We can write a brief memo to the president as the following:
Respected sir,
As you can see estimating from ABC method to allocate the overhead cost to each
product line, I recognize that producing specialty briefcase is very costly. Manufacturing
overhead cost of producing special briefcases is $45.09 which is higher than $20 compare
to $25 as given breakdown, while producing standard briefcases bring us back $6.02
gross margin per unit instead of $1. Therefore, the ideal of focusing on expanding
producing specialty and decision on shifting the company’s resources entirely to
production of specialty briefcases is inefficiency and unprofitable. So, do we consider on
whether the company should continue or stop expanding producing specialty briefcase?
I am looking forward to have further discussion with you on this matter for our best
solution.
With Best Regards,
11
4) Sally Henrie stated that “the completion hasn’t been able to touch our price” on
special business. I think there may have some arguments on this statement.
If company would consider producing product line of specialty briefcases, the selling
price must cover at least the unit product cost which is cost $45.09. Therefore, the price
of specialty briefcases must be from $45.09 (at break-even point) or above $45.09 (if add
together with expected profits). In reality, the price depending on many indicators that
make the company can set up their price to suit with price setting objectives. Since the
competitor charged over $50 a unit for its special items, means they may be able to touch
the company’s price and become very competitive price as well, if company set up price
to consider profits matter.
The answer to question about the price needs to assess their ultimate profitability. At
present, company overlooks the higher reaches of their pricing potential. Basing release
prices on realistic market research and cost analysis can give managers the confidence to
carry out their price. In this case, we do not have enough information to make conclusion
on whether competitor can touch the company’s price or not since we do not have the
actual price compare to the market price. However, the statement of Sally should be
review based on their actual cost of producing and contribution margin of specialty
product line.
12
Task 3: Flexible budget and flexible budget performance report:
Summarize information:
Sales
$ 3,000,000
Cost of goods sold:
- Direct materials
1,200,000
- Direct labor
260,000
- Machinery repair (Variable cost)
57,000
- Depreciation - Machinery
250,000
- Utilities (25% is variable cost)
200,000
- Plant manager salaries
140,000
$ 2,107,000
Gross profit
$ 893,000
Selling expenses:
- Packaging
80,000
- Shipping
116,000
- Sales salary (fixed annual amount)
160,000
$ 356,000
General and administrative expenses:
- Advertising
81,000
- Salaries
241,000
- Entertainment expenses
90,000
$ 412,000
Net income
$ 125,000
We calculate cost per unit for each of cost category base on 20,000 units as the following:
Volume
20,000
Selling price = Sale/ volume = $3,000,000/ 20,000 =
$ 150
DM per unit = Total DM/ volume = $1,200,000/ 20,000 =
$ 60
DL per unit = Total DL/ volume = $260,000/ 20,000 =
$ 13
Machinery repair per unit = Machinery repair/volume = $57,000/ 20,000 =
$ 2.85
Depreciation (fixed costs) =
$ 250,000
Utilities Variables = 25% x $200,000 =
$ 50,000
Utilities Fixed = $200,000 – $50,000 =
$ 150,000
Utilities variable per unit = $50,000/20,000 =
$ 2.50
Packaging per unit = $80,000/ 20,000 =
$ 4.00
Shipping per unit = $116,000/ 20,000 =
$ 5.80
Sales salary fixed (fixed costs annual) =
$ 160,000
13
a) Prepare flexible budgets for the company at sales volume of 18,000 and 24,000 units:
Volume
18,000
20,000
24,000
Sales
$2,700,000
$ 3,000,000
$ 3,600,000
Cost of goods
sold
$1,950,300
$2,107,000
$ 2,420,400
Direct materials
1,080,000
1,200,000
1,440,000
Direct labor
234,000
260,000
312,000
Machinery repair
(Variable cost)
51,300
57,000
68,400
Depreciation -
Machinery
250,000
250,000
250,000
Utilities (25% is
variable cost)
195,000
200,000
210,000
Plant manager
salaries
140,000
140,000
140,000
Gross profit
$749,700
$893,000
$ 1,179,600
Selling expenses
$336,400
$356,000
$ 395,200
Packaging
72,000
80,000
96,000
Shipping
104,400
116,000
139,200
Sales salary (fixed
annual amount)
160,000
160,000
160,000
General and
administrative
expense
$412,000
$ 412,000
$ 412,000
Advertising
81,000
81,000
81,000
Salaries
241,000
241,000
241,000
Entertainment
expenses
90,000
90,000
90,000
Net income
$ 1,300
$ 125,000
$ 372,400
14
b) b1- Prepare a flexible budget performance report for 2012 [@ Selling Price is $150]:
Budget @ 20,000
units
Budget @ 24,320
units
Actual
Variances
Volume
20,000
$150
24,320
$150
24,320
$ 150
Sales
$3,000,000
$3,648,000
$3,648,000
Cost of goods
sold
$2,107,000
$2,445,472
$2,443,000
Direct materials
1,200,000
1,459,200
1,400,000
(59,200)
F
Direct labor
260,000
316,160
360,000
43,840
U
Machinery repair
(Variable cost)
57,000
69,312
60,000
(9,312)
F
Depreciation -
Machinery
250,000
250,000
250,000
-
Utilities (25% is
variable cost)
200,000
210,800
218,000
7,200
U
Plant manager
salaries
140,000
140,000
155,000
15,000
U
Gross profit
$ 893,000
$1,202,528
$1,205,000
Selling expenses
$ 356,000
$ 398,336
$ 376,000
Packaging
80,000
97,280
90,000
(7,280)
F
Shipping
116,000
141,056
124,000
(17,056)
F
Sales salary
(fixed annual
amount)
160,000
160,000
162,000
2,000
U
General and
administrative
expense
$ 412,000
$ 412,000
$436,000
Advertising
81,000
81,000
104,000
23,000
U
Salaries
241,000
241,000
232,000
(9,000)
F
Entertainment
expenses
90,000
90,000
100,000
10,000
U
Net income
$ 125,000
$392,192
$393,000
$880
F
15
b2- Analyze and interpret the direct materials variance and direct labor variance:
As can be seen from Flexible budget performance report in Part b1, the company has used
less direct materials in actual production process compare to budget about $59,200 while
they did spent more on direct labor which is higher than budget around $43,840. However,
the differences between saving and overused is $15,360 (=$59,200 - $43,840). The company
still has saved of $15,360 in limited comparison of two factors direct materials and direct
labor. This means that company has adjusted the direct input factor from the direct materials,
in which they totally can manage well their production costs from direct input factor and it is
in their hand capacity.
Furthermore, direct labor cost account for a proportion of 57.31% (=$1,400,000/$2,443,000)
while direct hour labor occupy about 14.74% (=360,000//$2,443,000) in total costs of goods
sold. Therefore, percentage of variance in direct materials has more effect to total cost of
goods sold compare to percentage change in direct labor cost. So, the production manager
has most responsibility on how well of using direct materials and direct labor.
16
Task 4: Cash Budget and Control:
Summarize information:
Actual and projected sales:
Units
Dollars
January (actual)
18,000
$396,000
February (actual)
22,500
$495,000
March (budgeted)
19,000
$418,000
April (budgeted)
18,750
$412,500
May (budgeted)
21,000
$462,000
- 40%
of credit sales is collected in the month of sale
- 35%
is collected after the sale
- 23%
is collected in the second month after the sale
- 2%
is uncollectable
a) Prepare a schedule of cash collection:
January
February
March
April
May
Total Cash
396,000
495,000
418,000
412,500
462,000
- Cash sales
-
-
-
-
-
- Credit sales
396,000
495,000
418,000
412,500
462,000
Cash collection from:
- January's Sales
158,400
138,600
91,080
- February's Sales
198,000
173,250
113,850
- March's Sales
167,200
146,300
96,140
- April's Sales
165,000
144,375
- May's Sales
184,800
Total cash collection
$158,400
$336,600
$431,530
$ 425,150
$ 425,315
17
Description:
Cash collection in January = 40% x $396,000 = $158,000.
Cash collection in February = 35% x $396,000 + 40% x $495,000
= $138,600 + $198,000 = $336,000.
Cash collection in March = 23% x $396,000 + 35% x $495,000 + 40% x $418,000
= $91,080 + $173,250 + $167,200 = $431,530
Cash collection in April = 23% x $495,000 + 35% x $418,000 + 40% x $412,500
= $113,850 + $146,300 + $165,000 = $425,150
Cash collection in May = 23% x $418,000 + 35% x $412,500 + $ 40% x $462,000
= $96,140 + $144,375 + $184,800 = $425,315
b) Prepare a merchandise purchases budget for February, March and April. Report
calculations on units and then show the dollar amount of purchases of each month.
- Ending monthly inventory = 20% next month's unit sales + 100 units safety stock.
For example:
February’s desired ending inventory = 20% x 19,000 + 100 = 3,900 units.
February’s beginning inventory = January’s ending inventory.
Similar calculation for March and April’s ending inventory and the beginning
inventory of this month is equal to ending inventory of previous month.
- 31 January and 28 February: actual inventory are consistent.
18
Merchandise purchases budget for February, March and April:
January
February
March
April
Products needs
18,000
22,500
19,000
18,750
Desired ending inventory
4,600
3,900
3,850
4,300
Safety stock
100
100
100
100
Total needs
22,600
26,400
22,850
23,050
Less beginning inventory
4,600
3,900
3,850
Products need to purchase
21,800
18,950
19,200
Cost per unit
$ 12
$ 12
$ 12
Total purchase costs
$ 261,600
$ 227,400
$ 230,400
c) Prepare a schedule of cash payments on product purchases for March and April.
- 30% of purchase made in the month is paid in that month;
- 70% other is paid in paid in the next month.
Therefore, Cash payment for:
- February = 30% x $261,600 = $78,000
- March = 70% x $261,600 + 30% x $227,400
= $183,120 + $68,220 = $251,340
- April = 70% x $227,400 + 30% x $230,400
= $159,180 + $69,120 = $228,300
19
Schedule of cash payment on products purchases for March and April:
February
March
April
May
Total purchase costs
$ 261,600
$ 227,400
$ 230,400
Cash payment for:
- February
78,480
183,120
- March
68,220
159,180
- April
69,120
161,280
Total cash payment
$ 78,480
$ 251,340
$ 228,300
d) Prepare cash budget for March and April, including any loan activity and interest
expense. Compute the loan balance at the end of each month.
Based on the following given information to prepare the cash budget for March and
April:
- Minimum cash balance for the month-end is $50,000, is maintained by borrowing
cash from the bank.
- If the balance is exceeded $50,000, repay the loan as much as it can without going
below the balance the minimum, interest rate annually is 12%.
- At Feb 28
th
, the balance loan is $12,000, cash balance is $50,000.
20
Cash budget for March and April:
March
April
1. Beginning cash balance
$ 50,000
$ 58,070
2. Cash receipt from:
- Sales
431,530
425,150
- Disposal value of old equipment
3. Cash available: = (1) + (2)
$ 481,530
$ 483,220
4. Cash payment for:
$ 411,340
$ 388,300
- Products purchase
251,340
228,300
- Selling and Admin. Expenses (=$1.920.000/12 months)
160,000
160,000
5. Different between cash available and cash payment = (3) - (4)
$ 70,190
$ 94,920
6. Financing
Repayment of debt ($12,000)
12,000
-
(12% interest rate annual/12 months x $12,000)
120
-
7. Ending cash balance
$ 58,070
$ 94,920
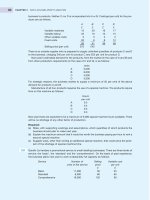
e) Refer to the results in part d, since we get the balance exceeds $50,000 ($58,070) the
company may not need to borrow money from the bank if not necessary. It met two
requirements of the firm.
- Firstly, the firm’s minimum cash balance for the month-end is $50,000 and
maintained in the following month.
- Secondly, the company has repaid the loan and interest which carries 12%/ month but
still firm got the end balance was $58,070.
Therefore, if it would not necessary then the firm no need to borrow additional funds at
the end of March.
21
References
1. Mckinsey&Company (2013). Insights & Publications. Retrieved from
/>2. Mowen/ Hansen/ Heitger (2009). Cornerstones of Managerial Accounting (3
rd
Edition). International Student edition, South – Western, CENGAGE Learning. China
Translation & Printing Services Limited.
3. Pham Thi Ngoc Bich (2013). Accounting for Decision Making [PowerPoint Slides
Syllabus].
4. Tax accountants (2013). Cost-volume-profit Analysis: Some Limitations. Retrieved
from />analysis-some-limitations.php.