Statistical Process Control Vol5 ppt
Bạn đang xem bản rút gọn của tài liệu. Xem và tải ngay bản đầy đủ của tài liệu tại đây (2.73 MB, 460 trang )
Statistical Process Control
For Susan, Jane and Robert
Statistical Process Control
Fifth Edition
John S. Oakland
PhD, CChem, MRSC, FIQA, FSS, MASQ, FInstD, MInstM, FRSA
Executive Chairman of Oakland Consulting plc
Professor of Business Excellence and Quality Management,
University of Leeds Business School
OXFORD AMSTERDAM BOSTON LONDON NEW YORK PARIS
SAN DIEGO SAN FRANCISCO SINGAPORE SYDNEY TOKYO
Butterworth-Heinemann
An imprint of Elsevier Science
Linacre House, Jordan Hill, Oxford OX2 8DP
200 Wheeler Road, Burlington MA 01803
First published 1986
Reprinted 1986, 1987, 1989
Second edition 1990
Reprinted 1992, 1994, 1995
Third edition 1996
Fourth edition (paperback) 1999
Fifth edition 2003
© 1986, 1996, 1999, 2003 John S. Oakland. All rights reserved
© 1990 John S. Oakland and Roy R. Followell. All rights reserved
The right of John S. Oakland to be identified as the author of this work has been
asserted in accordance with the Copyright, Designs and Patents Act 1988.
No part of this publication may be reproduced in any material form (including
photocopying or storing in any medium by electronic means and whether
or not transiently or incidentally to some other use of this publication) without
the written permission of the copyright holder except in accordance with the
provisions of the Copyright, Designs and Patents Act 1988 or under the terms of
a licence issued by the Copyright Licensing Agency Ltd, 90 Tottenham Court Road,
London, England W1T 4LP. Applications for the copyright holder’s written
permission to reproduce any part of this publication should be addressed
to the publisher
British Library Cataloguing in Publication Data
A catalogue record for this book is available from the British Library
Library of Congress Cataloguing in Publication Data
A catalogue record for this book is available from the Library of Congress
ISBN 0 7506 5766 9
Composition by Genesis Typesetting Limited, Rochester, Kent
Printed and bound in Great Britain by MPG Books Limited, Bodmin, Cornwall
Contents
Preface xi
Part 1 Process Understanding
1 Quality, processes and control 3
Objectives 3
1.1 The basic concepts 3
1.2 Design, conformance and costs 8
1.3 TQM, processes and the SPC system 14
1.4 Some basic tools 17
Chapter highlights 18
References 20
Discussion questions 21
2 Understanding the process 23
Objectives 23
2.1 Improving customer satisfaction through
process management 23
2.2 Information about the process 26
2.3 Process mapping and flowcharting 29
2.4 Process analysis 35
2.5 Statistical process control and process understanding 37
Chapter highlights 40
References 41
Discussion questions 41
3 Process data collection and presentation 42
Objectives 42
3.1 The systematic approach 42
3.2 Data collection 44
3.3 Bar charts and histograms 46
vi Contents
3.4 Graphs, run charts and other pictures 54
3.5 Conclusions 57
Chapter highlights 57
References 58
Discussion questions 58
Part 2 Process Variability
4 Variation and its management 63
Objectives 63
4.1 The way managers look at data 63
4.2 Interpretation of data 64
4.3 Causes of variation 68
4.4 Accuracy and precision 72
4.5 Variation and management 77
Chapter highlights 80
References 81
Discussion questions 81
5 Variables and process variation 82
Objectives 82
5.1 Measures of accuracy or centring 82
5.2 Measures of precision or spread 85
5.3 The normal distribution 88
5.4 Sampling and averages 89
Chapter highlights 95
References 96
Discussion questions 96
Worked examples using the normal distribution 98
Part 3 Process Control
6 Process control using variables 105
Objectives 105
6.1 Means, ranges and charts 105
6.2 Are we in control? 118
6.3 Do we continue to be in control? 120
6.4 Choice of sample size and frequency, and control limits 123
6.5 Short-, medium- and long-term variation – a change in the
standard practice 126
6.6 Summary of SPC for variables using X and R charts 130
Chapter highlights 131
Contents vii
References 132
Discussion questions 133
Worked examples 141
7 Other types of control charts for variables 153
Objectives 153
7.1 Life beyond the mean and range chart 153
7.2 Charts for individuals or run charts 155
7.3 Median, mid-range and multi-vari charts 161
7.4 Moving mean, moving range, and exponentially weighted
moving average (EWMA) charts 165
7.5 Control charts for standard deviation () 176
7.6 Techniques for short run SPC 182
7.7 Summarizing control charts for variables 184
Chapter highlights 184
References 186
Discussion questions 186
Worked example 193
8 Process control by attributes 195
Objectives 195
8.1 Underlying concepts 195
8.2 np-charts for number of defectives or non-conforming units 198
8.3 p-charts for proportion defective or non-conforming units 206
8.4 c-charts for number of defects/non-conformities 210
8.5 u-charts for number of defects/non-conformities per unit 214
8.6 Attribute data in non-manufacturing 215
Chapter highlights 219
References 220
Discussion questions 221
Worked examples 224
9 Cumulative sum (cusum) charts 227
Objectives 227
9.1 Introduction to cusum charts 227
9.2 Interpretation of simple cusum charts 231
9.3 Product screening and pre-selection 236
9.4 Cusum decision procedures 237
Chapter highlights 242
References 243
Discussion questions 244
Worked examples 251
viii Contents
Part 4 Process Capability
10 Process capability for variables and its measurement 259
Objectives 259
10.1 Will it meet the requirements? 259
10.2 Process capability indices 261
10.3 Interpreting capability indices 266
10.4 The use of control chart and process capability data 267
10.5 A service industry example – process capability analysis
in a bank 270
Chapter highlights 271
References 272
Discussion questions 273
Worked examples 273
Part 5 Process Improvement
11 Process problem solving and improvement 277
Objectives 277
11.1 Introduction 277
11.2 Pareto analysis 280
11.3 Cause and effect analysis 289
11.4 Scatter diagrams 296
11.5 Stratification 298
11.6 Summarizing problem solving and improvement 300
Chapter highlights 301
References 302
Discussion questions 303
Worked examples 307
12 Managing out-of-control processes 315
Objectives 315
12.1 Introduction 315
12.2 Process improvement strategy 316
12.3 Use of control charts for trouble-shooting 318
12.4 Assignable or special causes of variation 329
Chapter highlights 331
References 332
Discussion questions 332
Contents ix
13 Designing the statistical process control system 334
Objectives 334
13.1 SPC and the management system 334
13.2 Teamwork and process control/improvement 338
13.3 Improvements in the process 340
13.4 Taguchi methods 347
13.5 Summarizing improvement 353
Chapter highlights 353
References 354
Discussion questions 355
14 Six-sigma process quality 356
Objectives 356
14.1 Introduction 356
14.2 The six-sigma improvement model 359
14.3 Six-sigma and the role of Design of Experiments 360
14.4 Building a six-sigma organization and culture 364
14.5 Ensuring the financial success of six-sigma projects 366
14.6 Concluding observations and links with Excellence 373
Chapter highlights 375
References 376
Discussion questions 376
15 The implementation of statistical process control 378
Objectives 378
15.1 Introduction 378
15.2 Successful users of SPC and the benefits derived 379
15.3 The implementation of SPC 380
A final comment 384
Chapter highlights 385
Appendices
A The normal distribution and non-normality 386
B Constants used in the design of control charts for mean 396
C Constants used in the design of control charts for range 397
D Constants used in the design of control charts for median
and range 398
E Constants used in the design of control charts for standard
deviation 399
F Cumulative Poisson probability tables 400
G Confidence limits and tests of significance 411
H OC curves and ARL curves for X and R charts 421
I Autocorrelation 426
J Approximations to assist in process control of attributes 428
K Glossary of terms and symbols 433
Index 441
Preface
Stop Producing Chaos – a cry from the heart! When the great guru of quality
management and process improvement W. Edwards Deming died at the age of
93 at the end of 1993, the last words on his lips must have been ‘Management
still doesn’t understand process variation’.
Despite all his efforts and those of his followers, including me, we still find
managers in manufacturing, sales, marketing, finance, service and public
sector organizations all over the world reacting (badly) to information and
data. They often do not understand the processes they are managing, have no
knowledge about the extent of their process variation or what causes it, and
yet they try to ‘control’ processes by taking frequent action. This book is
written for them and comes with some advice: ‘Don’t just do something, sit
there (and think)!’
The business, commercial and public sector world has changed a lot since
I wrote the first edition of Statistical Process Control – a practical guide in the
mid-eighties. Then people were rediscovering statistical methods of ‘quality
control’ and the book responded to an often desperate need to find out about
the techniques and use them on data. Pressure over time from organizations
supplying directly to the consumer, typically in the automotive and high
technology sectors, forced those in charge of the supplying production and
service operations to think more about preventing problems than how to find
and fix them. The second edition of Statistical Process Control (1990)
retained the ‘took kit’ approach of the first but included some of the
‘philosophy’ behind the techniques and their use.
In writing the third and fourth editions I found it necessary to completely
restructure the book to address the issues found to be most important in
those organizations in which my colleagues and I work as researchers,
teachers and consultants. These increasingly include service and public
sector organizations. The theme which runs throughout the book is still
PROCESS. Everything we do in any type of organization is a process,
which requires:
xii Preface
᭹ UNDERSTANDING,
᭹ has VARIATION,
᭹ must be properly CONTROLLED,
᭹ has a CAPABILITY, and
᭹ needs IMPROVEMENT.
Hence the five new sections of this edition.
Of course, it is still the case that to be successful in today’s climate,
organizations must be dedicated to continuous improvement. But this requires
management – it will not just happen. If more efficient ways to produce goods
and services that consistently meet the needs of the customer are to be found,
use must be made of appropriate methods to gather information and analyse
it, before making decisions on any action to be taken.
Part 1 of this edition sets down some of the basic principles of quality and
process management to provide a platform for understanding variation and
reducing it, if appropriate. The remaining four sections cover the subject of
Statistical Process Control in the basic but comprehensive manner used in the
first four editions, with the emphasis on a practical approach throughout.
Again a special feature is the use of real-life examples from a number of
industries, and these have been extended in several ways in this edition.
I was joined in the second edition by my friend and colleague Roy
Followell, who has now retired to France. In this edition I have been helped
again by my colleagues in Oakland Consulting plc and its research and
education division, the European Centre for Business Excellence, based in
Leeds, UK. A major addition in this edition is Chapter 14 on six sigma.
Like all ‘new management fads’ six sigma has been hailed as the saviour to
generate real business performance improvement. It adds value to the good
basic approaches to quality management by providing focus on business
benefits and, as such, now deserves separate and special treatment in
this book.
The wisdom gained by my colleagues and me at the Centre and in the
consultancy, in helping literally thousands of organizations to implement total
quality management, business excellence, good management systems, six
sigma and SPC has been incorporated, where possible, into this edition. I hope
the book now provides a comprehensive guide on how to use SPC ‘in anger’.
Numerous facets of the implementation process, gleaned from many man-
years’ work in a variety of industries, have been threaded through the book,
as the individual techniques are covered.
SPC never has been and never will be simply a ‘took kit’ and in this
edition I hope to provide not only the instructional guide for the tools,
but communicate the philosophy of process understanding and improvement,
which has become so vital to success in organizations throughout the
world.
Preface xiii
The book was never written for the professional statistician or mathema-
tician. As before, attempts have been made to eliminate much of the
mathematical jargon that often causes distress. Those interested in pursuing
the theoretical aspects will now find, at the end of each chapter, references to
books and papers for further study, together with discussion questions. Several
of the chapters end with worked examples taken from a variety of
organizational backgrounds.
The book is written, with learning objectives at the front of each chapter, to
meet the requirements of students in universities, polytechnics, and colleges
engaged in courses on science, technology, engineering, and management
subjects, including quality assurance. It also serves as a textbook for self or
group instruction of managers, supervisors, engineers, scientists and technolo-
gists. I hope the text offers clear guidance and help to those unfamiliar with
either process management or statistical applications.
I would like to acknowledge the contributions of my colleagues in the
European Centre for Business Excellence and in Oakland Consulting. Our
collaboration, both in a research/consultancy environment and in a vast array
of public and private organizations, has resulted in an understanding of the
part to be played by the use of SPC techniques and the recommendations of
how to implement them.
John S. Oakland
Other Titles by the Same Author and Publisher
Total Organisational Excellence – the route to world class performance
Total Quality Management – text and cases
Total Quality Management – A Pictorial Guide
Websites
www.oaklandconsulting.com
www.ecforbe.com
Part 1
Process Understanding
1 Quality, processes and control
Objectives
᭹ To introduce the subject of statistical process control (SPC) by
considering the basic concepts.
᭹ To define terms such as quality, process and control.
᭹ To distinguish between design quality and conformance.
᭹ To define the basics of quality related costs.
᭹ To set down a system for thinking about SPC and introduce some basic
tools.
1.1 The basic concepts
SPC is not really about statistics or control, it is about competitiveness.
Organizations, whatever their nature, compete on three issues: quality,
delivery and price. There cannot be many people in the world who remain to
be convinced that the reputation attached to an organization for the quality of
its products and services is a key to its success and the future of its employees.
Moreover, if the quality is right, the chances are the delivery and price
performance will be competitive too.
What is quality?
The word ‘quality’ is often used to signify ‘excellence’ of a product or service
– we hear talk about ‘Rolls-Royce quality’ and ‘top quality’. In some
manufacturing companies quality may be used to indicate that a product
conforms to certain physical characteristics set down with a particularly
‘tight’ specification. But if we are to manage quality it must be defined in a
way which recognizes the true requirements of the ‘customer’.
Quality is defined simply as meeting the requirements of the customer and
this has been expressed in many ways by other authors:
4 Quality, processes and control
fitness for purpose or use (Juran).
the totality of features and characteristics of a product or service that bear on its ability to
satisfy stated or implied needs (BS 4778: Part 1: 1987 (ISO 8402: 1986)).
the total composite product and service characteristics of marketing, engineering, manufacture,
and maintenance through which the product and service in use will meet the expectation by the
customer (Feigenbaum).
The ability to meet the customer requirements is vital, not only between two
separate organizations, but within the same organization. There exists in every
factory, every department, every office, a series of suppliers and customers.
The typist is a supplier to the boss – is the typist meeting the requirements?
Does the boss receive error-free typing set out as he wants it, when he wants
it? If so, then we have a quality typing service. Does the factory receive from
its supplier defect-free parts which conform to the requirements of the
assembly process? If so, then we have a quality supplier.
For industrial and commercial organizations, which are viable only if they
provide satisfaction to the consumer, competitiveness in quality is not only
central to profitability, but crucial to business survival. The consumer should
not be required to make a choice between price and quality, and for
manufacturing or service organizations to continue to exist they must learn
how to manage quality. In today’s tough and challenging business environ-
ment, the development and implementation of a comprehensive quality policy
is not merely desirable – it is essential.
Every day people in certain factories scrutinize together the results of the
examination of the previous day’s production, and commence the ritual battle
over whether the material is suitable for despatch to the customer. One may be
called the Production Manager, the other the Quality Control Manager. They
argue and debate the evidence before them, the rights and wrongs of the
specification, and each tries to convince the other of the validity of their
argument. Sometimes they nearly break into fighting.
This ritual is associated with trying to answer the question: ‘Have we done
the job correctly?’ – ‘correctly’ being a flexible word depending on the
interpretation given to the specification on that particular day. This is not
quality control, it is post-production detection, wasteful detection of bad
product before it hits the customer. There is a belief in some quarters that to
achieve quality we must check, test, inspect or measure – the ritual pouring on
of quality at the end of the process – and that quality, therefore, is expensive.
This is nonsense, but it is frequently encountered. In the office we find staff
checking other people’s work before it goes out, validating computer input
data, checking invoices, typing, etc. There is also quite a lot of looking for
things, chasing things that are late, apologizing to customers for non-delivery,
and so on – waste, waste and more waste.
Quality, processes and control 5
The problems are often a symptom of the real, underlying cause of this type
of behaviour, the lack of understanding of quality management. The
concentration of inspection effort at the final product or service stage merely
shifts the failures and their associated costs from outside the company to
inside. To reduce the total costs of quality, control must be at the point of
manufacture or operation; quality cannot be inspected into an item or service
after it has been produced. It is essential for cost-effective control to ensure
that articles are manufactured, documents are typed, or that services are
generated correctly the first time. The aim of process control is the prevention
of the manufacture of defective products and the generation of errors and
waste in non-manufacturing areas.
To get away from the natural tendency to rush into the detection mode, it
is necessary to ask different questions in the first place. We should not ask
whether the job has been done correctly, we should ask first: ‘Can we do the
job correctly?’ This has wide implications and this book aims to provide some
of the tools which must be used to ensure that the answer is ‘Yes’. However,
we should realize straight away that such an answer will only be obtained
using satisfactory methods, materials, equipment, skills and instruction, and a
satisfactory or capable ‘process’.
What is a process?
A process is the transformation of a set of inputs, which can include materials,
actions, methods and operations, into desired outputs, in the form of products,
information, services or – generally – results. In each area or function of an
organization there will be many processes taking place. Each process may be
analysed by an examination of the inputs and outputs. This will determine the
action necessary to improve quality.
The output from a process is that which is transferred to somewhere or to
someone – the customer. Clearly, to produce an output which meets the
requirements of the customer, it is necessary to define, monitor and control the
inputs to the process, which in turn may have been supplied as output from an
earlier process. At every supplier–customer interface there resides a
transformation process and every single task throughout an organization must
be viewed as a process in this way.
To begin to monitor and analyse any process, it is necessary first of all to
identify what the process is, and what the inputs and outputs are. Many
processes are easily understood and relate to known procedures, e.g. drilling
a hole, compressing tablets, filling cans with paint, polymerizing a chemical.
Others are less easily identified, e.g. servicing a customer, delivering a lecture,
storing a product, inputting to a computer. In some situations it can be difficult
to define the process. For example, if the process is making a sales call, it is
vital to know if the scope of the process includes obtaining access to the
6 Quality, processes and control
potential customer or client. Defining the scope of a process is vital, since it
will determine both the required inputs and the resultant outputs.
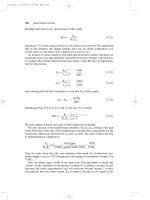
A simple ‘static’ model of a process is shown in Figure 1.1. This describes
the boundaries of the process. ‘Dynamic’ models of processes will be
discussed in Chapter 2.
Once the process is specified, the inputs and suppliers, outputs and customers
can also be defined, together with the requirements at each of the interfaces (the
voice of the customer). Often the most difficult areas in which to do this are in
non-manufacturing organizations or non-manufacturing parts of manufacturing
organizations, but careful use of appropriate questioning methods can release
the necessary information. Sometimes this difficulty stems from the previous
absence of a precise definition of the requirements and possibilities. Inputs to
Figure 1.1 A process
Quality, processes and control 7
processes include: equipment, tools, computers or plant required, materials,
people (and the inputs they require, such as skills, training, knowledge, etc.);
information including the specification for the outputs, methods or procedures
instructions, and the environment.
Prevention of failure in any transformation is possible only if the process
definition, inputs and outputs are properly documented and agreed. The
documentation of procedures will allow reliable data about the process itself
to be collected (the voice of the process), analysis to be performed, and action
to be taken to improve the process and prevent failure or non-conformance
with the requirements. The target in the operation of any process is the total
avoidance of failure. If the objective of no failures or error-free work is not
adopted, at least as a target, then certainly it will never be achieved. The key
to success is to align the employees of the business, their roles and
responsibilities with the organization and its processes. This is the core of
process alignment and business process re-design (BPR). When an organiza-
tion focuses on its key processes, that is the value-adding activities and tasks
themselves, rather than on abstract issues such as ‘culture’ and ‘participation’,
then the change process can begin in earnest.
BPR challenges managers to rethink their traditional methods of doing work
and commit to a customer-focused process. Many outstanding organizations
have achieved and maintained their leadership through process re-design or ‘re-
engineering’. Companies using these techniques have reported significant
bottom-line results, including better customer relations, reductions in cycle
time to market, increased productivity, fewer defects/errors and increased
profitability. BPR uses recognized techniques for improving business processes
and questions the effectiveness of the traditional organizational structure.
Defining, measuring, analysing and re-engineering/designing processes to
improve customer satisfaction pays off in many different ways.
What is control?
All processes can be monitored and brought ‘under control’ by gathering and
using data. This refers to measurements of the performance of the process and
the feedback required for corrective action, where necessary. Once we have
established that our process is ‘in control’ and capable of meeting the
requirements, we can address the next question: ‘Are we doing the job
correctly?’, which brings a requirement to monitor the process and the
controls on it. Managers are in control only when they have created a system
and climate in which their subordinates can exercise control over their own
processes – in other words, the operator of the process has been given the
‘tools’ to control it.
If we now re-examine the first question: ‘Have we done it correctly?’, we
can see that, if we have been able to answer both of the questions: ‘Can we
8 Quality, processes and control
do it correctly?’ (capability) and ‘Are we doing it correctly?’ (control) with
a ‘yes’, we must have done the job correctly – any other outcome would be
illogical. By asking the questions in the right order, we have removed the need
to ask the ‘inspection’ question and replaced a strategy of detection with one
of prevention. This concentrates attention on the front end of any process – the
inputs – and changes the emphasis to making sure the inputs are capable of
meeting the requirements of the process. This is a managerial responsibility
and these ideas apply to every transformation process, which must be
subjected to the same scrutiny of the methods, the people, the skills, the
equipment and so on to make sure they are correct for the job.
The control of quality clearly can take place only at the point of
transformation of the inputs into the outputs, the point of operation or
production, where the letter is typed or the artefact made. The act of inspection
is not quality control. When the answer to ‘Have we done it correctly?’ is
given indirectly by answering the questions on capability and control, then we
have assured quality and the activity of checking becomes one of quality
assurance – making sure that the product or service represents the output from
an effective system which ensures capability and control.
1.2 Design, conformance and costs
Before any discussion on quality can take place it is necessary to be clear
about the purpose of the product or service, in other words, what the customer
requirements are. The customer may be inside or outside the organization and
his/her satisfaction must be the first and most important ingredient in any plan
for success. Clearly, the customer’s perception of quality changes with time
and an organization’s attitude to quality must, therefore, change with this
perception. The skills and attitudes of the people in the organization are also
subject to change, and failure to monitor such changes will inevitably lead to
dissatisfied customers. Quality, like all other corporate matters, must be
continually reviewed in the light of current circumstances.
The quality of a product or service has two distinct but interrelated
aspects:
᭹ quality of design;
᭹ quality of conformance to design.
Quality of design
This is a measure of how well the product or service is designed to achieve its
stated purpose. If the quality of design is low, either the service or product will
not meet the requirements, or it will only meet the requirement at a low level.
Quality, processes and control 9
A major feature of the design is the specification. This describes and
defines the product or service and should be a comprehensive statement of all
aspects which must be present to meet the customer’s requirements.
A precise specification is vital in the purchase of materials and services for
use in any conversion process. All too frequently, the terms ‘as previously
supplied’, or ‘as agreed with your representative’, are to be found on
purchasing orders for bought-out goods and services. The importance of
obtaining materials and services of the appropriate quality cannot be
overemphasized and it cannot be achieved without proper specifications.
Published standards should be incorporated into purchasing documents
wherever possible.
There must be a corporate understanding of the company’s quality position in
the market place. It is not sufficient that the marketing department specifies a
product or service, ‘because that is what the customer wants’. There must also
be an agreement that the producing departments can produce to the
specification. Should ‘production’ or ‘operations’ be incapable of achieving
this, then one of two things must happen: either the company finds a different
position in the market place, or substantially changes the operational facilities.
Quality of conformance to design
This is the extent to which the product or service achieves the specified
design. What the customer actually receives should conform to the design and
operating costs are tied firmly to the level of conformance achieved. The
customer satisfaction must be designed into the production system. A high
level of inspection or checking at the end is often indicative of attempts to
inspect in quality. This will achieve nothing but spiralling costs and
decreasing viability. Conformance to a design is concerned largely with the
quality performance of the actual operations. The recording and analysis of
information and data play a major role in this aspect of quality and this is
where statistical methods must be applied for effective interpretation.
The costs of quality
Obtaining a quality product or service is not enough. The cost of achieving it
must be carefully managed so that the long-term effect of ‘quality costs’ on
the business is a desirable one. These costs are a true measure of the quality
effort. A competitive product or service based on a balance between quality
and cost factors is the principal goal of responsible production/operations
management and operators. This objective is best accomplished with the aid
of a competent analysis of the costs of quality.
The analysis of quality costs is a significant management tool which
provides:
10 Quality, processes and control
᭹ A method of assessing and monitoring the overall effectiveness of the
management of quality.
᭹ A means of determining problem areas and action priorities.
The costs of quality are no different from any other costs in that, like the costs
of maintenance, design, sales, distribution, promotion, production, and other
activities, they can be budgeted, monitored and analysed.
Having specified the quality of design, the producing or operating units
have the task of making a product or service which matches the requirement.
To do this they add value by incurring costs. These costs include quality-
related costs such as prevention costs, appraisal costs, and failure costs.
Failure costs can be further split into those resulting from internal and external
failure.
Prevention costs
These are associated with the design, implementation and maintenance of the
quality management system. Prevention costs are planned and are incurred
prior to production or operation. Prevention includes:
Product or service requirements. The determination of the requirements and
the setting of corresponding specifications, which also take account of
capability, for incoming materials, processes, intermediates, finished products
and services.
Quality planning. The creation of quality, reliability, production, supervision,
process control, inspection and other special plans (e.g. pre-production trials)
required to achieve the quality objective.
Quality assurance. The creation and maintenance of the overall quality
management system.
Inspection equipment. The design, development and/or purchase of equipment
for use in inspection work.
Training. The development, preparation and maintenance of quality training
programmes for operators, supervisors and managers to both achieve and
maintain capability.
Miscellaneous. Clerical, travel, supply, shipping, communications and other
general office management activities associated with quality.
Resources devoted to prevention give rise to the ‘costs of getting it right the
first time’.
Quality, processes and control 11
Appraisal costs
These costs are associated with the supplier’s and customer’s evaluation of
purchased materials, processes, intermediates, products and services to assure
conformance with the specified requirements. Appraisal includes:
Verification. Of incoming material, process set-up, first-offs, running
processes, intermediates and final products or services, and includes product
or service performance appraisal against agreed specifications.
Quality audits. To check that the quality management system is functioning
satisfactorily.
Inspection equipment. The calibration and maintenance of equipment used in
all inspection activities.
Vendor rating. The assessment and approval of all suppliers – of both products
and services.
Appraisal activities result in the ‘cost of checking it is right’.
Internal failure costs
These costs occur when products or services fail to reach designed standards
and are detected before transfer to the consumer takes place. Internal failure
includes:
Scrap. Defective product which cannot be repaired, used or sold.
Rework or rectification. The correction of defective material or errors to meet
the requirements.
Reinspection. The re-examination of products or work which has been
rectified.
Downgrading. Product which is usable but does not meet specifications and
may be sold as ‘second quality’ at a low price.
Waste. The activities associated with doing unnecessary work or holding
stocks as the result of errors, poor organization, the wrong materials,
exceptional as well as generally accepted losses, etc.
Failure analysis. The activity required to establish the causes of internal
product or service failure.