Health and Elderly Care Expenditure in an AgingWorld docx
Bạn đang xem bản rút gọn của tài liệu. Xem và tải ngay bản đầy đủ của tài liệu tại đây (231.39 KB, 47 trang )
Health and Elderly Care
Expenditure in an Aging World
Leslie Mayhew
RR-00-21
September 2000
International Institute for Applied Systems Analysis, Laxenburg, Austria
Tel: +43 2236 807 Fax: +43 2236 71313 E-mail:
Web: www.iiasa.ac.at
International StandardBook Number 3-7045-0139-5
Research Reports, which record research conducted at IIASA, are independently reviewed before
publication. Views or opinions expressed herein do not necessarily represent those of the Institute,
its National Member Organizations, or other organizations supporting the work.
Copyright
c
2000
International Institute for Applied Systems Analysis
All rights reserved. No part of this publication may be reproduced or transmitted in any form or by
any means, electronic or mechanical, including photocopy,recording, or any information storage or
retrieval system, without permission in writing from the copyright holder.
CoverdesignbyAnkaJames.
Printed by Remaprint, Vienna.
Contents
Abstract iv
Acknowledgments iv
1 Introduction 1
2 Health Care Services 6
2.1 MeasuringHealthExpenditure 6
2.2 MethodofAnalysis 10
2.3 More Developed Countries . . 13
2.4 Less Developed Countries . . 16
3 Disability and Welfare Services 19
3.1 Measuring Disability 19
3.2 MethodofAnalysis 22
3.3 More Developed Countries . . 24
3.4 Less Developed Countries . . 27
3.5 Disability and the Provision of Elderly Care Services 27
4 Conclusions 36
Annex: Overview of Method Used to Measure Disability 38
References 41
iii
Abstract
The world’s population is aging, albeit at different rates in different countries.
The International Institute for Applied Systems Analysis (IIASA) is building an
economic–demographic model for exploring the consequences of populationaging
on the global economy. So far it has concentrated on impacts mediated through
public and private pension systems. It now wishes to extend the model to cover
other sectors whose provision is also highly age sensitive, including health and
elderly care services. This report explores the consequences of population aging
for these vital services and considers the basic mechanisms fueling their growth.
These mechanisms fall into essentially two categories: The first is related to the
biomedical processes of aging, which can lead to chronic illness and disability in
old age. The second concerns the costs of treatment and long-term care, which in
turn are a function of medical technologyand institutionalfactors, how services are
delivered, and who bears the costs.
Using simple but explicit projection methodologies, we project health care and
disability-related expenditure in two major world regions, corresponding to more
developed countries(MDCs) and less developed countries (LDCs). The key policy-
related conclusions are as follows:
• Aging will overtake population growth as the main demographic driver of
health expenditure growth, but its effect will be less than that of technological
and institutional factors.
• Health expenditure will expand rapidly in LDCs (relative to gross domestic
product) to reach levels currently observed in MDCs.
• The number of people with disabilities will grow substantially, but will level
out in MDCs by 2050 (earlier for all but the oldest age groups), while the
number of people with disabilities in all age groups will continue to grow in
LDCs. Assuming that most care for the disabled continues to be provided by
the family and community, projected increases in disability-relatedexpenditure
are modest.
Acknowledgments I am grateful to my colleagues at IIASA for the stimulating
discussions on the issues raised in this paper, particularly to Landis MacKellar,
who heads IIASA’s Social Security Reform Project.
iv
1
Introduction
The impact of population aging on the global economy is now a major issue.
This report, a contribution to the project on global social security reform at the
International Institute for Applied Systems Analysis (IIASA), focuses on health
and elderly care services (MacKellar and Reisen, 1998; MacKellar and Ermolieva,
1999). While these expenditure areas are less economically significant than pen-
sions, the other main area of impact, they still account for over 10% of gross do-
mestic product (GDP) in developed countries. They are major consumers of public
expenditure; they straddle the public and the formal and informal private sectors,
and are sensitive to the size and age distribution of the population and to patterns
of morbidity. Their growth and development over the past 30 years or so, however,
are only partly explained by aging and population growth. More important are fac-
tors such as technological change (new treatments and drugs), higher utilizationper
capita, institutional behavior, higher labor costs, etc.
Our focus is on population and aging because of the very different population
trajectories in developed and developing regions and their different starting posi-
tions. It is now firmly established, for example, that older people consume more
health services per capita than any other age group except perhaps the newly born.
On average, their ability to perform daily tasks slowly erodes until, at some stage,
they become dependent on others for home help, or possibly residential care or
long-term care in a hospital. The degree of dependency, and sometimes also the
need for medication, reaches a maximum in the period just before death (Seale and
Cartwright, 1994). The economic consequences are therefore varied, directly or in-
directly involving the work place, households, and agencies in the public, private,
and voluntary sectors (see, e.g., Jackson, 1998). Not surprisingly, governments are
becoming increasingly aware of the need for coordinated policies in the fields of
employment, pensions, disability, and health.
Some trends, though, will pull in opposite directions. It is expected, for exam-
ple, that future generations of older people will be better prepared to live indepen-
dent lives into advanced old age, particularly with the aid of modern technology
and medical breakthroughs such as body-part replacement, which may improve the
quality of life for some. There is some evidence that older people already have
1
2
healthier lifestylesand are better educated and informed than previous generations,
with the result that the threshold for frailty and disability is being pushed later into
old age in some instances (ONS, 1997). Estimates of future health- and disability-
related expenditure depend crucially on whether the longevity revolution is adding
healthy life years or years of illness and dependency to the human life span.
Despite the uncertainty arising from countervailing forces, and certainly based
on experience over the past 50 or so years, it is expected that demand will continue
to grow and that health care services will continue to consume a rising share of
GDP in all major world regions. To some extent, this merely reflects the changing
consumption basket of aging societies (in the case of the more developed coun-
tries, or MDCs) and societies undergoing structural economic and social change,
including rapid health transition(in the case of less developed countries, or LDCs).
A rising health-sector share of GDP is not necessarily an adverse trend (Aaron,
1996). However, the health sector’s increasing claim on resources is not without
consequences for the real economy and represents an important index of structural
change.
While in some countries health systems confer universal coverage, the same is
not true of elderly care services, which continue to be dominated by care within
the family unit or immediate community, the so-called informal sector. A central
issue in this case is the extent to which services provided by third parties (state
or private residential and nursing homes, etc.) in the formal sector should be paid
for out of personal income, sales of assets, and so forth. Again, the picture varies
substantially, even within countries, because of differences in income and social
factors such as deprivation and home and family circumstances.
The aim of this report is to provide greater clarity and a firmer empirical basis
for analysisof these issues in the context of IIASA’s global economic–demographic
model, which is aimed at the medium to long term. Using recently available data,
we attempt to separate aging effects from other contributors to growth, focusing on
aging and disability and the demands older people and the disabled make on health
and other services. In IIASA’s model, the world is divided into two regions. One
region comprises the MDCs and includes the newly independent countries in the
European part of the former Soviet Union. This region accounts for 82% of world
GDP, but only 22% of global population. The other region comprises LDCs and
includes China, India, and the newly independent Central Asian countries of the
former Soviet Union.
The differences between the economies and population age profiles of the two
regions are telling, providing important clues as to the future impact of population
aging on health and elderly care services. Figure 1.1 shows two population pyra-
mids based on IIASA’s central population projections at two points in time, 1995
and 2050. The horizontal axes are scaled to show the percentage of population by
age group rather than population number in order to emphasize the differences in
3
0-4
10-14
20-24
30-34
40-44
50-54
60-64
70-74
80-84
90-94
1 0 0 +
Percentage of population
15 10
500
51015
Age
Age
Percentage of population
15 10
500
51015
0-4
10-14
20-24
30-34
40-44
50-54
60-64
70-74
80-84
90-94
1 0 0 +
''#
#
MDCs LDCs
MDCs LDCs
(a )
(b )
Figure 1.1. Population pyramids in (a) 1995 and (b) 2050. Population in each
age group is expressed as a percentage of the total population in a region. Source:
IIASA central population projections (Lutz, 1996).
shape between regions and between years. In 1995, the MDC pyramid is highly
tapered but still quite broad at the base, whereas the LDC pyramid is dominated by
youngergenerations,withrelativelysmall percentages of older people. By 2050 the
aging process reaches maturity in MDCs, with the majority of the population con-
centrated in older age groups. In LDCs the pyramid is substantially transformed,
resembling the MDC pyramid for 1995.
4
Sources of Information on Health and Elderly Care
Services
In considering the scope of health and elderly care services, we are dependent to
a significant degree on the availability of suitable data in the private and public
sectors. For this report, elderly care services are defined to include personal and
social services such as social care in the home or in an institution such as a nursing
or residential home. These services may include help with daily living, advice on
financial affairs, companionship, and so forth. A key problem with elderly care ser-
vices is how to evaluate the relative importance and size of each sector – whether
state-funded, private, or informal. Details about the informal sector are especially
scarce, and its economicvalueremains an unknownquantity, althoughit iscertainly
very large (usually assumed to be over 80% of the total). The size of the formal sec-
tor, which provides residential, day, and home (domiciliary) services and benefits
in kind (such as meals), is better reported, but there remain many hidden transfers
which are categorized elsewhere in national accounts. One example is the cost of
residential care, part or all of which may be paid directly by the state or by the
individual, or indirectly through social security benefits. These and other hidden
transfers, the opportunity costs of unpaid care, and benefits provided in kind from
many sources, including voluntary organizations, increase the difficulty of piecing
together the elderly care jigsaw puzzle.
There is no single or complete source of data on all aspects of these issues.
Expenditure in each country is sensitive to cultural, behavioral, and institutional
factors; to morbidity and mortality profiles; and to the level of economic develop-
ment. Set against this, however, are the similarities in demography within each ma-
jor region, the increasingly shared experiences of medical advances, and common
outlooks and values, for example, in terms of national and international policies
toward the disabled, in which emphasis is on equality within society.[1] It should
be noted that while the picture that emerges is coherent and persuasive, it is built
up partly from information available in every country and partly from fragmentary
information from one or more countries that has been extrapolated to the rest of the
region. It follows that the structure of the approach is as important as the results
themselves, because the framework, including the IIASA model, can be updated as
new and better information becomes available.
A key source of information for this report was IIASA’s central scenario for
world populationprojectionsfrom 1995 to2100(Lutz, 1996), althoughfor the most
part we concentrated on the period to 2050, for which information was the most re-
liable. Also invaluable were Organisation for Economic Co-operation and Devel-
opment (OECD) databases covering health and social expenditure, including some
information on activity levels and unit costs (OECD, 1998a, 1998b); the European
System of Social Protection Statistics(Eurostat, 1996, 1998); United Nations (UN)
5
and World Bank data (UN, 1998; World Bank, 1993, 1999), especially macroeco-
nomic and some health expenditure data for LDCs and miscellaneous sources and
studies drawn from countries as diverse as the UK, USA, Canada, Australia, Fin-
land, Japan, and China; and relevant conference proceedings. There were major
shortcomings with respect to health and disability data for LDCs; consequently,
key issues are only scratched at the surface. In the case of MDCs (comprising
OECD countries and countries in Eastern Europe and the former Soviet Union),
the analysis prior to 1995 is based on OECD databases only.
The results presented are therefore a mixtureof thefirm and not-so-firm, the rel-
atively precise and the merely indicative. Therefore, where necessary, appropriate
assumptions and qualifications are spelled out. To a significant degree, this report
builds on established trends over long periods, relatively stable features of the pop-
ulation such as the onset and prevalence of disabilities, and underlying trends in
economic growth. No attempt is made to predict technological changes that may
have an impact on the delivery of health care and other services, or major break-
throughs in medical treatments that may otherwise have an impact on longevity,
health service costs, and so forth. These are presumed to be subsumed in the un-
derlying growth rate.
Part 2 of this report considers health care services. Part 3 looks at disabilityand
elderly care services. Conclusions are presented in Part 4.
2
Health Care Services
2.1 Measuring Health Expenditure
Medical expenditure is high in the first few years of life and increases again in
old age with the onset of chronic illnesses and disability. To determine the contri-
bution of population growth and aging to future expenditure, we need to separate
the proportion of growth attributable to population trends and aging from growth
attributable to other causes. The OECD publishes data on health expenditure per
capita in selected older age groups as a ratio of expenditure in the 0 to 64 age group
(OECD, 1998a). Although there are many gaps, a coherent picture emerges across
countries showing expenditure in older age groups to be significantly greater than
that in other age groups apart from the very young (see van der Gaag and Preker,
1998; European Commission, 1997).
Data from England and Wales (see Figure 2.1) are consistent with the wider
OECD picture and have the advantage of being available in time series over the
entire age spectrum. They are also consistent with general examples provided by
Cichon et al. (1999). Although the period is relatively short (1982–1993), the data
are remarkably stable in most age groups. An exception occurs in the case of
the 85+ age group, where the increase and subsequent downturn in the mid-1980s
marks a change of policy concerningtheappropriatenessof keepingvery old people
in hospitals (we return to this point later). Otherwise, the flatness of the curves
is noteworthy, especially given increases in health service utilization, changes in
treatments, improvements in quality, decreasing lengths of hospital stay, and the
growing use of, for example, day services.
The stability evident in Figure 2.1 suggests that relative age-specific expendi-
ture indices should be fairly stable over time, at least in MDCs. Table 2.1 presents
such indices calculated from the data plotted in Figure 2.1, with the lowest age
group (0–4) as the baseline. We will presently apply these indices to project how
the changing age structure of the population in MDCs is likely to affect growth in
health care expenditure. Note that our assumption is not that levels of age-specific
per capita health care expenditure in Englandand Wales are representative of levels
of expenditure in MDCs as a whole, but that the age profile of such expenditure is
6
7
0
1
2
3
4
5
6
7
8
1982/3 1984/5 1986/7 1988/9 1990/1 1992/3
Fiscal year
45 64
6574
75 84
85+
Ratio
Figure 2.1. Ratio of per capita health expenditurein differentage groups to average
per capita health expenditure calculated over all age groups (only older age groups
shownfor clarity), Englandand Wales, circa 1982 to 1992. Source: UK Department
of Health, personal correspondence.
Table 2.1. Relative per capita health care expenditure by age group, England and
Wales, circa 1980 to 1990 (age 0–4 =1.00). Source: Calculated from data presented
in Figure 2.1.
Age group Relative expenditure
0–4 1.00
5–14 0.40
15–44 0.53
45–64 0.82
65–74 1.70
75–84 3.20
85+ 5.52
representative, a much weaker assumption. We are saying simply that health care
expenditure nearly doubles in moving from one age group to the next.
For LDCs, the issues are substantially different; moreover, equivalent data are
unavailable. The nature of the problem is illustrated in Table 2.2 (based on data
from Murray and Lopez, 1996), showing the estimated percentage of deaths by
major causes in different world regions in 2000 and 2020. In MDCs the ma-
jority of deaths are currently from noncommunicable diseases, whereas in LDCs
8
Table 2.2. Pattern of mortality in MDCs and LDCs, in 2000 and 2020 (projected).
Source: Based on data from Murray and Lopez (1996), baseline scenario in tables
12a to 12h and 16a to 16h on pp. 616–647, 760–791.
MDCs LDCs
Cause of death 2000 2020 2000 2020
All deaths (millions) 12.6 13.5 43.5 54.8
Communicable (%) 5.8 5.0 32.6 17.5
Noncommunicable (%) 87.3 88.6 55.4 68.8
Injuries (%) 6.9 6.4 12.0 13.7
communicable diseases are still a major cause of death. As the table shows, this
situation is expected to change in the medium term, so that LDCs will eventu-
ally look more like MDCs, with a gradual convergence over a period presumably
accompanied by commensurate changes in health care services.
At the present time, expenditure on communicable diseases in MDCs is only a
small percentage of total health care expenditure. For example, based on Murray
and Lopez’s classification, in England and Wales communicable disease accounts
for only about 5.5% of hospital costs and 3.3% of primary care costs, whereas in-
jury and poisoning account for 5.8% of costs. The rest of the costs are associated
with noncommunicable diseases such as neoplasms, psychiatric disorders, and car-
diovascular malfunctions. So the distribution of expenditure in this case is quite
close to the distribution of mortality by cause.
It makes little sense to apply the MDC indices in Table 2.1 to LDCs, which
are characterized by a different morbidity and mortality structure. An alternative
is to use mortality rates as a proxy variable, based on the crude assumption that
age-specific per capita health expenditure is proportional to age-specific mortality
rates, thecoefficient of proportionalitybeinginvariant over the age spectrum. (If we
knew how the coefficient varied with age, we could calculate relative age-specific
health expenditure indices directly on the basis of mortalitydata.) One way to build
on this approach is to assume that all medical expenditure takes place in the year
prior to death and that, given the current medical technology in use in LDCs, the
cost of this care is invariant with respect to age.
This procedure gives a spread of weights for 1995 ranging from 1 to 8, which is
slightlymore extreme than in the example in Table 2.1. They fall below the weights
shown between the ages of 4 and 60, at which point they cross. As mortality in
future years decreases, the weights for the oldest age groups fall, giving a spread
of 1 to 7 (compared with about 1 to 5.5 in MDCs); thus some general convergence
seems likely. To take the argument one step further, we can scale the weights for
both regions by the expected population in each age group to obtain profiles of
relative total health expenditure by age group. It should be noted that, because all
9
Age
R elative expediture
LD C s 2020
LD C s 1995
LD C s 2050
MDCs 1995
0
0.5
1.0
1.5
2.0
2.5
3.0
0
410
14 20
24 30
34 40
44 50
54 60
64 70
74 80
84
Figure 2.2. Relative health care expenditure by age group (age 0–4 = 1.0), MDCs
(1995) and LDCs (1995–2050) compared.
regions and time periods are scaled so that the index is equal to 1.0 at the 0 to 4 age
group, differences in the health care costs in MDCs and LDCs cannot be inferred.
As can be seen in Figure 2.2, the estimated age profile of health expenditure
in LDCs is projected to evolve over time. The comparable profile for MDCs for
1995 is also shown. The figure shows that, by the end of the period, age-related
expenditure in LDCs overtakes that experienced in MDCs in 1995 for theoldest age
groups. Underlying the projections are changes in the age structure of mortality,
as age-specific mortality rates of the aged rise relative to age-specific mortality
rates of the young (i.e., mortality rates decline less for older people than for the
young). If medical spending is linked to mortality at the level of the individual, as
we hypothesize, then the population-wide mortality transition will be accompanied
by a similar shift in the age pattern of health expenditure.
However, there is universal agreement that the increase in health expenditure in
MDCs can be attributed mostly to development and application of new diagnostic
procedures, drugs, and medical interventions (see, e.g., Cutler, 1995). The impact
of these technological changes has primarily benefited older people. Thus, the
steeply rising weights in Table 2.1 represent not only the fact that older people have
poorer health than young people, but also that there exist technologies developed
over the past 50 years for treating the health conditions associated with old age.
Indeed, this finding may be compared with that of Cutler and Meara (1997) that
the spending profile in 1953 was relatively flat compared with today’s profile. It is
probably reasonable to speculate that the age expenditure profile of the USA (and
10
by inference, MDCs as a whole) in 1953 was similar to that shown in Figure 2.2
for LDCs in 1995.
While the evolution of the LDC age-expenditure curves in Figure 2.2 reflects
changes in the age structure of mortality, it does not take into account the fact that if
the coefficient of proportionalitywere replaced with an age- and time-indexed coef-
ficient, projected health expenditure for older age groups would probably rise even
faster. Accelerating this process will be the fact that, whereas new medical tech-
nologies were developed from scratch in MDCs, LDCs are able to import existing
technologies. Therefore, in presenting the projections in Figure 2.2,weareaware
that, if anything, they understate the rapidity of the changes in health expenditure
that may be anticipated.
2.2 Method of Analysis
We use a “growth factor” method to analyze trends in health care expenditure.
Estimated health expenditure in time t, H(t), is related to a base period as follows:
H(t)=H(0)e
t(r
P
+r
U
)
. (2.1)
We hypothesize two growth rates, one of which (r
P
) reflects demographic
change (change in total population and change in age structure), and the second
of which (r
U
), calculated as a residual, is interpreted as an underlying rate for new
technology and the growth in factor costs.
Let I(t) be an index of population size and structure, and let r
P
betherateof
change in this index:
r
P
(t)=
1
t
ln I(t) . (2.2)
Then it is easy to confirm that
r
U
(t)=
1
t
ln
H(t)
H(0)I(t)
. (2.3)
If we define the demographic index so that I(0) = 1, then the underlying rate
can be written
r
U
(t)=
1
t
ln
H(t)
I(t)
H(0)
I(0)
, (2.4)
so that r
U
can be interpreted as the rate of growth of total health care expenditure
normalized by an index of population size and structure.
11
The underlying rate reflects technological change, changes in per capita utiliza-
tion, shifts in the care provided, and other factors, whereas the demographic rate
combines population trends and aging, and is designed to capture the health needs
of a growing population and the costs of treating an older population. These as-
sumptions mean, for example, that even if the underlying rate of change were zero,
health care expenditure would continue to grow (or fall) depending on changes in
population size and age structure. It also means that if the underlying rate were
to fall (as has occurred, for example, in some transition economies of the former
Soviet Union), the GDP share of health could still increase depending on the direc-
tion of population change.
As our index of population-related growth in health expenditure, we define
I(t)=
i
P
i
(t)c
i
(t)
i
P
i
(0)c
i
(0)
, (2.5)
where P
i
(t) is population in age group i and c
i
(t) is the age-specific relative expen-
diture index. Note that I(0) =1.
It is possible to decompose I(t) into components related to population change
(“volume effect”) and aging (“distributioneffect”) by rewriting as follows:
I(t)=I
P
(t)I
A
(t) , (2.6)
with
I
P
(t)=
i
P
i
(t)
i
P
i
(0)
, (2.7)
and
I
A
(t)=
i
p
i
(t)c
i
(t)
i
p
i
(0)c
i
(0)
, (2.8)
where p
i
(t) is the proportion of population in age group i.
Based on thediscussionin the previoussection, we assume that c
i
(t) is constant
over time at the values given in Table 2.1 for MDCs:
c
i
(t)=c
i
(0) , (2.9)
so
I
MDC
(t)=
i
P
i
(t)c
i
(0)
i
P
i
(0)c
i
(0)
. (2.10)
12
In the case of the LDCs, we have assumed that health expenditure is propor-
tional to age-specific mortality, an approach that leads to the expression
c
i
(t)=m(0)d
i
(t) , (2.11)
where m is a constant of proportionality and d is the age-specific mortality rate.
Because m cancels, the index is then
I
LDC
(t)=
i
P
i
(t)d
i
(t)
i
P
i
(0)d
i
(0)
. (2.12)
The population growth term of the multiplicative decomposition is
I
LDC
P
(t)=
i
P
i
(t)
i
P
i
(0)
=
P
T
(t)
P
T
(0)
, (2.13)
where the T subscript refers to total population in all age groups and the aging
component is
I
LDC
A
(t)=
i
p
i
(t)d
i
(t)
i
p
i
(0)d
i
(0)
. (2.14)
I(t) and I
A
(t) for LDCs have an immediate interpretation in terms of total deaths
and the crude death rate (total deaths over total population):
I
LDC
(t)=
i
D
i
(t)
i
D
i
(0)
=
D
T
(t)
D
T
(0)
, (2.15)
where D
i
(t) is deaths in age group i and the T subscript refers to total deaths; and
I
LDC
A
(t)=
i
P
i
(t)
P
T
(t)
D
i
(t)
P
i
(t)
i
P
i
(0)
P
T
(0)
D
i
(0)
P
i
(0)
=
CDR(t)
CDR(0)
, (2.16)
where CDR is the crude death rate.
13
0
2
4
6
8
10
12
Year
Percent
1960 1965 1970 1975 1980 1985 1990 1995
Figure 2.3. Health care expenditure as a percentage of GDP in OECD countries,
1960 to 1997. Source: OECD, 1998a.
2.3 More Developed Countries
In this and the next section, we consider the application of the growth factor model
to health care expenditure in both world regions. In OECD countries, health care
expenditure increased at a rate of 5.7% per year between 1960 and 1995 in real
terms. GDP, meanwhile, grew at 3.4% per year, with the result that health care now
accounts for 9.8% of GDP, compared with 4.3% in 1960 (Figure 2.3). Based on ap-
plicationof the growth factor model, of the total “headline” rate of growth in health
expenditure of 5.7%, 1.3% was caused by population changes and aging. The re-
mainder (4.4%, by far the larger share) represents the underlying rate, which we
have attributed elsewhere to technological, institutional, and other effects. These
results are shown in column one of Table 2.3. Note from the model equations that
the effects are actually multiplicative, although allowing them to be additive turns
out to be an accurate approximation.
How will population change and aging affect future MDC health expenditure,
and what will be its share of GDP? Answering these questions involves three judg-
ments, one about demographic change, another about the underlying rate of growth
of health care, and a third about the rate of economic growth. Of these, the under-
lying rate for health care is perhaps the most difficult to judge. As noted, health
care expenditure in the OECD grew continuously between 1960 and 1995 except
for a brief period during the early 1980s, when it faltered for a year or two. All the
signs are that this level of underlying growth is set to continue, albeit possibly at
a slightly slower rate as a result of cost containment policies. Extrapolation of the
14
Table 2.3. Development of health expenditure and GDP in MDCs, 1960 to 2050,
in percent. Note: 3.4% for 1960to 1995 is an estimate based on OECD region only.
1960–1995 1995–2020 2020–2050
GDP growth per annum 3.40 3.00
a
3.00
a
Health care expenditure growth per annum 5.70 4.10 3.70
Underlying rate 4.40 3.00
a
3.00
a
Age and volume 1.31 1.06 0.74
Due to population change 0.96 0.27 –0.05
Due to aging 0.35 0.79 0.79
As percentage of GDP (end of period) 9.84 12.80 16.00
Private 40 40 40
a
Assumedrate.
past 30 years of OECD experience suggests, therefore, that the underlying rate of
growth for the MDC region should be a bit less than 4% per annum (pa).
However, the MDC region in the IIASA model includes not only OECD coun-
tries but Eastern Europe and most of the former Soviet Union as well. In these
regions, GDP has fallen dramatically in recent years (one assumes temporarily)
with the introduction of market reforms. Interestingly, these countries provide an
illustrationof what happens to health care expenditurewhen an economy is in rapid
decline. Data from Chellaraj et al. (1996) indicatethat the GDPshare of healthcare
has increased as GDP has fallen in absolute terms. This suggests that even if there
is a prolonged period of economic transition, including rigorous health cost con-
tainment policies, the underlying growth rate will remain positive in this part of the
world even where absolute expenditure declines.
Taking these factors into account, we assume 3% pa for the underlying rate of
future growth in health care expenditure in the MDC region, which is about 1% pa
below the OECD rate prior to 1995.
Combining this assumption with the IIASA central scenario population projec-
tion results in the health care expenditure projections shown in Table 2.3.Demo-
graphic change contributes 1.06% pa to health expenditure growth between 1995
and 2020, declining to 0.74% pa between 2020 and 2050 (see Table 2.3). Of the
1.06% pa between 1995 and 2020, most (0.79% pa) is due to aging and the rest
(0.27% pa), to volume (i.e., population increase). Between 2020 and 2050, 0.79%
pa is due to aging, with a small offset (–0.05% pa) due to a declining population.
These results can be compared withthe more substantialimpact (1.3% pa) of popu-
lation change and aging in the period from 1960 to 1995,most of which (0.96% pa)
was due to population increase. A major conclusion to be elicited from Table 2.3,
therefore, isthat,notwithstandingunderlyinggrowth,futuredemographic pressures
on health services will come not from population increase, as in the recent past, but
from population aging.
15
Based on a long-term GDP growth assumption of 3% pa, the projections in
Table 2.3 imply that health care’s share of GDP will grow from 9.8% in 1995 to
12.8% by 2020 and 16.0% by 2050. This proportion is broadly equivalent to that
currently seen in the USA, whose own expenditure on health care has been forecast,
in one estimate, to increase to 27.1% of GDP by 2040 (Warshawsky, 1999). The
MDC average will be reached unless there is more pressure to bear down on costs
(e.g., through rationing of medical interventions), more recognition is given to pre-
ventive care, or there are other changes in policy or technology. If GDP growth is
slower – for example, if improvements in productivityfail to compensate for slower
labor force growth – then the health share will be even higher.
A potentially important unknown is whether the assumed age-specific relative
health expenditure indices shown in Table 2.1 will continue at the levels indicated
or will fall – for example, as a result of cost containment policies or improving
health. If it is assumed that present relative expenditure indices for the 85+ age
group are set equal to those for the 75 to 84 age group, which are lower, the GDP
share of health expenditure is reduced only marginally. If the expenditure indices
for age groups over 75 are set equal to those for the 65 to 74 age group, the reduc-
tion is about 0.5% of GDP in 2020, rising to just under 2% in 2050. This is a more
substantial reduction, but it also provides a good illustration of the limitations of
cost containment policies aimed solely at older people. In comparison, if, for ex-
ample, the underlying rate of growth were to be reduced from 3% to 2%, the GDP
share of health expenditure would fall to 10% and 12% in 2020 and 2050, respec-
tively, which is a far more substantial reduction. The key conclusion therefore is
that aging, while becoming more important, is only one relatively small part of the
upward drive in health expenditure.
From the standpoint of applying the IIASA model, it is also important to know
how much of health expenditure is publicly financed and how much is privately fi-
nanced. The relative merits of different forms of provisionare not our concern here,
only the extent to which they affect the financing of health services and the various
contribution rates. The part of total health expenditure that is privately financed is
defined as the difference between total and public expenditure. Based on OECD
data, private expenditure dropped from 59% of the total in 1960 to about 40% in
1975 (Figure 2.4), and has since stabilized. This somewhat counterintuitivefinding
(intuitively, one might expect private expenditure to increase its share) is consistent
with the findings of other studies that private medical expenditure is negatively re-
lated to GDP per capita (e.g., see Musgrove, 1996). Equally interesting, however,
is the fact that the decline of the private-sector share seems to have been arrested,
possibly reflecting the success of cost containment policies in the public sector.
In the absence of any obvious trends or other changes in government policies, we
assume that private health expenditure will continue at around 40% of the total.
16
0
10
20
30
40
50
60
70
Year
Percent
1960 1965 1970 1975 1980 1985 1990 1995
Figure 2.4. Private expenditure on health as a percentage of total health care ex-
penditure, 1960 to 1996. Source: OECD, 1998a.
2.4 Less Developed Countries
There are too many gaps in the data for LDCs to produce an analysis as detailed
as that for MDCs. This means that coverage of the key indicators is sparse and
the conclusions are necessarily weaker. As far as can be determined, however, the
economies of LDCs grew at an average rate of 3.2% pa between 1960 and 1995. We
assume this rate of growth continues at 3% pa, which is the same as our assumed
GDP growth rate for MDCs. Public expenditure on health care is about 2.7% of
GDP (World Bank, 1999), with the level of private medical expenditure unclear,
but potentially double this. In any event, total expenditure is a much smaller pro-
portion of GDP (very roughly half) than in MDCs. Because no reliable figures are
available for years prior to 1960, it is not possible to provide accurate estimates
of the historical underlying growth rate of health care expenditure. For projection
purposes, it seems reasonable to assume a growth rate of 3% pa, as we have done
for MDCs.
It is possible, however, to estimate the contribution of population change and
aging to health expenditure based on the mortality-linked hypothesis described in
Section 2.3. Analysis (see Table 2.4) shows that the effective contributionof popu-
lation change and aging in LDCs between 1960 and 1995 was about 0.4% pa, much
less than in MDCs. Of particular interest is the fact that this rate breaks down into
a 1.9% pa increase due to population growth (double the volume effect in MDCs),
but a 1.5% pa decrease due to population age structure changes. Rapid fertility
decline has decreased the number of very young persons (vis-`a-vis the number of
young persons in the absence of fertility change), who have relatively high health
17
Table 2.4. Development of health expenditure and GDP in LDCs, 1960 to 2050,
in percent.
1960–1995 1995–2020 2020–2050
GDP growth per annum 3.20 3.00
a
3.00
a
Health care expenditure growth per annum n.a. 4.80 4.62
Underlying rate n.a. 3.00
a
3.00
a
Population and aging 0.40 1.80 1.62
Due to population change 1.90 1.54 –0.73
Due to aging –1.50 0.26 2.35
As percentage of GDP (end of period) 2.70
b
4.20 6.90
a
Assumed rate.
b
Public expenditure only.
care costs, but has only recently started to translate into a growing number of older
people. Both MDC and LDC populations have “aged” in terms of rising average
(and median) age; in MDCs, however, aging has occurred from the top of the pop-
ulation pyramid, whereas in LDCs it has occurred from the bottom of the pyramid.
Since young adults have the lowest health costs of any age group, the result has
been downward pressure on total health expenditure in LDCs in this period.
In the future, deceleration of overall population growth will ease pressure on
LDC health expenditure, but population age structure change will switch from
braking expenditure growth to accelerating it. The combined effect of population
growth and aging produces a growthrate of 1.8% pa between 1995 and 2020, which
then falls to 1.62% pa between 2020 and 2050. Of these totals, in the period up to
2020, 0.26% pa (one-seventh) is attributable to aging and the rest is attributable
to population growth; after 2020 the effect of aging increases to 2.35% pa, but
the effect of population growth turns negative (–0.73% pa). Thus we conclude
that the demographic sources of growth in LDC health expenditure are quite dif-
ferent from those in MDCs. In the latter, most (1995–2020) or all (2020–2050)
population-related growth is due to aging. In the former, the aging component is
only beginning to be felt, but its impact is increasing.
With an assumed underlying growth rate of 3% pa, total public expenditure
on health care as a proportion of GDP is set to increase from 2.7% in 1995 to
about 4.2% in 2020 and 6.9% in 2050, with the final percentage being higher when
private expenditure is added in. Doubling the 4.2% GDP share of public-sector
health expenditure expected in 2020 to arrive at an estimate of total (public plus
private) health expenditure of 8.4% implies that in 2020 LDCs will face a situation
not unlike that of MDCs in 1995. Doubling the share expected for 2050, total LDC
health expenditure at 13.8% of GDP is not projected to differ appreciably from
expenditure in MDCs (16%). Add to this the possibility that the underlying rate of
growth may be more rapid in LDCs than in MDCs because of rapid assimilation of
18
MDC medical technology (and, perhaps, less effective cost containment measures)
and it is striking how rapidly the LDCs are projected to approach the situation of
today’s MDCs. In other words, any differences are basically due to the time lag
rather than to fundamentally different behavior.
3
Disability and Elderly Care Services
3.1 Measuring Disability
Disability may be congenital or a result of illness, injury, or physical deterioration,
especially in old age, when many find it difficult to manage without the support
of others. Knowing the severity of a disability is therefore important because it is
an indicator of dependency on others, such as friends or family, the state, or other
agencies. Thus it is helpful to think of disabilityas occurring on a continuumrather
than being a precise condition, and so distinguishable from ill health in the sense
that it describes a physical inability to carry out a particular activity. The medical
conditions primarily associated with disability in old age are circulatory diseases,
mental deterioration, and arthritis.
More precise descriptions and definitions of disability are given in numerous
texts and in statistical surveys and compendia. The World Health Organization, for
example, has adopted the International Classification of Impairments, Disabilities
and Handicaps (ICIDH) as a measurement framework, which is intended to be
complementary to the International Classification of Diseases (ICD) system for
diseases (see the annex to this report). Partly because of the expense and difficulty
of measuring disability,even on a samplebasis, it willtake time to builda consistent
and comparable database for all countries.
Estimates of the prevalence of disability are based on the number of people
with disabilitiesabove a certain threshold. Therefore, unless all countries adopt the
same threshold, definitions and estimates of the number of disabled are bound to
vary. Administrative data on receipt of disability benefits are a potential source of
information, but not all countries offer disability benefits, and those that do have
different eligibility rules.
In many countries, family and householdsurveys or censuses include questions
about the state of health of individuals that could potentially provide the basis for
international comparison. How disability questions are posed can give rise to dif-
ferent estimates, even among the same population, although distributions across
age groups tend to be similar.
Some years ago the UN published a volume on disability statistics that is il-
lustrative of the problem (UN, 1990). This work showed that Austria headed the
19
20
disability league, having a disabilityprevalence rate 20 times that of Egypt, a result
most observers would find implausible (e.g., see Metts et al., 1998). The reason
for the difference in this admittedly extreme case was that in Egypt disability was
measured on the basis of impairments (e.g., blindness) and in Austria, on the abil-
ity to carry out the tasks of daily living. There is also anecdotal evidence that
Austrian social security disability benefits are very generous, which could encour-
age overreporting.
Any analysis must therefore be based on a choice between data produced under
different definitions or data taken from a smaller, representative population under
strictly controlled conditions. Our starting point is an in-depth survey of disability
carried out in the UK during the 1980s. This highly detailed study, regarded as the
“gold standard” in its field, is still widely used and quoted, and is even used for
resource allocation purposes by some local service providers. The methodology is
described in the annex to this report, including examples from categories ranging
between 1, “least disabled,” and 10, “most disabled.”It is convenient to group these
10 categories into three larger groups. We arbitrarily chose the cutoffs to be cate-
gories 1 to 4 (least severe), 5 to 7 (intermediate severity), and 8 to 10 (most severe).
Figure 3.1 shows how disability rates increase with age in each category; Table 3.1
shows the actual rates on which the graph is based as well as the overall disability
rate per thousand.
Table 3.1 shows that the overall disability rate is about 14% of the population.
This is roughly equivalent to values obtained in household and census-based sur-
vey questions about “limiting long-standing illness.” These gave percentages for
the UK in the range of 12% to 18% (ONS, 1998), but obviously using less de-
tailed survey instruments. Although not broken down by severity, recent work at
the DisabilityStatistics Center at the University of California, San Francisco (Kaye
et al., 1997), using the National Health Interview Survey (NHIS) provides confir-
matory evidence. This work shows, for example, an overall US disability rate of
15% in 1994, up from 11.7% in 1970 as a result of changes in the population age
structure. Age-specific rates in the over 60 age group are around 40% in the USA,
which is reasonably close to the 47% obtained using Office of Population Censuses
and Surveys (OPCS) prevalence rates.
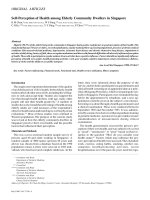
As far as Figure 3.1 is concerned, the prevalence rate is accurately described
by an exponential equation of the form δ
x
= Aexp(bx),whereδ
x
is the prevalence
rate at age x and b is the rate of increase in disability with age. Calibration yields
avalueforb of 0.052 and for A of 7.92 per thousand, which could be loosely
interpreted as the congenital rate of disability (R-squared = 0.996). Each severity
category can be similarly described, although the goodness of fit becomes inferior
as prevalence levels decrease.
21
0
100
200
300
400
500
600
700
800
16
19
20
29
3039
4049
5059
60
69
70
79
80+
Age group
R ate per thousand
Least severe
In te rm e d ia te
M ost severe
Figure 3.1. Prevalence of disability by age and severity category. Source: OPCS,
1988.
Table 3.1. Disability rates per thousand by age and severity (adapted from OPCS,
1988).
Age group
16– 20– 30– 40– 50– 60– 70–
Severity 19 29 39 49 59 69 79 80+ All
Most 555714275720022
Intermediate7101323 345711223840
Least 9 16 26 40 85 156 239 276 80
All 21 31 44 70 133 240 408 714 142
The period of most severe disability – and, therefore, greatest dependency – is
concentrated in the last years of life. Reviewing studies carried out in six countries
in 1980 and 1993 (Australia, Japan, Canada, UK, France, and Norway), the OECD
observed that this period had hardly changed over that time frame and that it was
significantly higher for women than for men, with a combined average of around
two years. By combining these data with mortality schedules, it is possible to
obtain an estimate of the number of severely disabled that is independent of the
prevalence rate.