Age- and sex-related effects on the neuroanatomy of healthy elderly pdf
Bạn đang xem bản rút gọn của tài liệu. Xem và tải ngay bản đầy đủ của tài liệu tại đây (1.47 MB, 12 trang )
Age- and sex-related effects on the neuroanatomy of healthy elderly
Herve´ Lemaıˆtre,
a
Fabrice Crivello,
a
Blandine Grassiot,
a
Annick Alpe´rovitch,
b
Christophe Tzourio,
b
and Bernard Mazoyer
a,c,d,
T
a
Groupe d’Imagerie Neurofonctionnelle, UMR 6194, CNRS, CEA, Universite´s de Caen et Paris 5, GIP Cyceron, BP5229, F-14074 Caen, France
b
INSERM U360, Hoˆpital Pitie´-Salpeˆtrie`re, 75013 Paris, France
c
Unite´ IRM, CHU de Caen, 14000 Caen, France
d
Institut Universitaire de France, 75005 Paris, France
Received 16 December 2004; revised 4 February 2005; accepted 24 February 2005
Available online 13 April 2005
Effects of age and sex, and their interaction on the structural brain
anatomy of healthy elderly were assessed thanks to a cross-sectional
study of a cohort of 662 subjects aged from 63 to 75 years. T1- and T2-
weighted MRI scans were acquired in each subject and further
processed using a voxel-based approach that was optimized for the
identification of the cerebrospinal fluid (CSF) compartment. Analysis
of covariance revealed a classical neuroanatomy sexual dimorphism,
men exhibiting larger gray matter (GM), white matter (WM), and CSF
compartment volumes, together with larger WM and CSF fractions,
whereas women showed larger GM fraction. GM and WM were found
to significantly decrease with age, while CSF volume significantly
increased. Tissue probability map analysis showed that the highest
rates of GM atrophy in this age range were localized in primary
cortices, the angular and superior parietal gyri, the orbital part of the
prefrontal cortex, and in the hippocampal region. There was no
significant interaction between bSexQ and bAgeQ for any of the tissue
volumes, as well as for any of the tissue probability maps. These
findings indicate that brain atrophy during the seventh and eighth
decades of life is ubiquitous and proceeds at a rate that is not
modulated by bSexQ.
D 2005 Elsevier Inc. All rights reserved.
Keywords: Brain; Aging; Sex; Voxel-based morphometry; MRI
Introduction
The increase of life expectancy during the last century has led
to a growing number of dementia cases in the aging population.
Prevalence studies suggested that, in 2000, the number of persons
with Alzheimer’s disease in the United States was 4.5 million and
predicted to rise to 13.2 million by 2050 (Hebert et al., 2003). This
dementia incidence upsurge has reinforced the importance of
characterizing the mechanisms of the human brain aging during the
seventh and eighth decades of life. Indeed, a better understanding
of the normal neuroanatomical aging could be of high interest for
dissociating processes specifically associated with pathologic brain
changes from those associated to normal changes.
During the past two decades, several studies have investigated
the effect of aging on the human brain. More often than not, these
studies investigated cerebral changes over life span (from 20 up to
80 years). Their findings have led to a large consensus regarding
the global morphological changes due to aging. First, postmortem
studies have described, starting at the fourth decade, a decrease of
the brain weight and an increase of the cerebrospinal fluid volume
(CSF) (Dekaban, 1978). Then, studies using Magnetic Resonance
Imaging (MRI) have confirmed and refined these findings by
showing that the gray matter (GM) volume starts to decrease earlier
in the life (at the end of the first decade), whereas the white matter
(WM) volume starts to decrease at the fourth decade (Courchesne
et al., 2000; Pfefferbaum et al., 1994).
There seems to exist, however, a large variability in the way the
different brain areas are reacting to aging. These selective age-
related neuroanatomical changes could be explained by several
aging theories. One of them is based on brain ontogeny and
phylogeny and states that the age-related changes of the various
cerebral regions follow a time pattern that is the reverse sequence
of their maturation during development (Braak et al., 1999; Raz et
al., 1997). According to this model, late maturating unimodal or
high-order heteromodal associative cortices are the first and the
most age-sensitive, while early maturating primary areas are
subject to later and smaller age-related changes. In agreement
with this model, several studies have specifically focused on
associative cortices and have shown a preferential atrophy of the
regions belonging to the prefrontal cortex (Coffey et al., 1992;
Jernigan et al., 2001; Salat et al., 2001). Other studies have
reported focal atrophy localized into the temporal lobe (Bigler et
al., 2002) including the hippocampus (Raz et al., 2004b; Tisserand
et al., 2000). However, other aging hypotheses based on the
dysfunction of the principal neurotransmitter systems could also
explain the affliction of these cerebral regions in healthy elderly
1053-8119/$ - see front matter D 2005 Elsevier Inc. All rights reserved.
doi:10.1016/j.neuroimage.2005.02.042
T Corres ponding author. G roupe d’ Ima gerie Neurofonctionnelle
UMR6194, CNRS, CEA, Universite
´
s de Caen et Paris 5, GIP Cyceron,
BP5229, F-14074 Caen, France. Fax: +33 231 470 271.
E-mail address: (B. Mazoyer).
Available online on ScienceDirect (www.sciencedirect.com).
www.elsevier.com/locate/ynimg
NeuroImage 26 (2005) 900– 911
subjects. Indeed, the age-related decline of dopaminergic (Volkow
et al., 2000) and cholinergic (Podruchny et al., 2003) systems,
which project on the frontal and limbic structures, respectively,
could be associated to this cerebral pattern of atrophy.
Meanwhile, using whole brain exploratory approaches, several
other studies were aimed at identifying other potential targets of
normal aging. These studies have found an age-related atrophy of
associative cortices but, more surprisingly, an implication of
several primary cortices normally considered as spared by aging
(Good et al., 2001; Sowell et al., 2003; Van Laere and Dierckx,
2001). For example, Salat et al. (2004) found that regional
cortical thinning with age (which has been found highly
correlated with regional GM density, Narr et al., in press)is
widespread over large parts of the cortex including motor,
auditory, and visual primary areas, as well as association cortices
such as the inferior lateral prefrontal cortex. Interestingly, a few
recent studies have specifically focused on the seventh and
subsequent decades, a period of life where maturation processes
no longer interfere with aging, and have reported a similar pattern
of regional age-related atrophy (Resnick et al., 2003; Tisserand et
al., 2004).
Beside age, sex is another major player of the inter-individual
brain morphology variability and several studies have been
interested in the potential impact of sex on age-related brain
changes. As a rule, these studies concluded that men exhibited
larger age-related brain atrophy and CSF increase than women over
the entire life span (Coffey et al., 1998; Gur et al., 1999; Yue et al.,
1997), this effect being enhanced in the frontal and temporal lobes
(Gur et al., 2002; Murphy et al., 1996; Raz et al., 1997, 2004a).
Conversely, reports of regional age-related atrophy higher in
women than in men are rare, although larger reduction of gray
matter in women have been reported in the visual cortex (Raz et al.,
1993), the parietal lobes and the hippocampus (Murphy et al.,
1996).
Actually, as the majority of these studies were based on large
age range cohorts, little is actually known about the effect of sex on
age-related changes in brain structure of healthy elderly subjects. In
the present study, we have investigated this issue by taking
advantage of a large epidemiology study dealing with vascular
aging for which a large cohort of subjects in their seventh or eighth
decades were recruited and examined with MRI.
Methods
Subjects
The sample of subjects who participated to the present protocol
is a sub-sample of the EVA (Epidemiology of Vascular Aging)
cohort (n = 1389), a longitudinal study on vascular aging and
cognitive decline in healthy elderly subjects, the characteristics of
which have been described elsewhere (Dufouil et al., 2001).
Subjects, born between 1922 and 1932, were recruited from
electoral rolls in Nantes (West of France) from June 1991 to June
1993. All participants gave their written informed consent to the
EVA study protocol, which was approved by the Ethic committee
of the Kremlin-Biceˆtre hospital. A number of biological and
sociological parameters were collected from each subject including
age, sex, hypertension, education level (number of schooling
years), and handedness. Subject’s global cognitive performances
were assessed using the Mini-Mental State Examination (MMSE)
(Folstein et al., 1985).
At 4-year follow-up, MRI examination was proposed to all
subjects and 88% of them agreed to participate. This sub-sample
did not differ from the rest of the cohort in terms of age, sex ratio,
hypertension, and cognitive performances. Due to financial
limitations, MRI could be performed in 845 subjects only, among
whom 32 had to be excluded because of the poor technical quality
of their scans, and 11 others because of previous history of stroke
as confirmed by a neurologist. Left with a sample of 802 subjects
(471 women, 331 men), we randomly selected 331 women in order
to obtain groups of men and women with identical size. Basic
demographic statistics are presented in Table 1. At the time of their
MRI, the 331 men and 331 women did not differ for age. However,
the men group had a higher mean level of education, a larger
proportion of hypertensive subjects, and a smaller proportion of
right-handed subjects, than women. ANCOVA reveals no effect of
Sex (P = 0.14) or Age (P = 0.29) on the cohort MMSE scores.
Rather, we found a significant bSex by AgeQ interaction (P =
0.0012), the age-related decrease of MMSE being larger in women
than in men.
MRI imaging
MRI acquisition
MR images were acquired between November 1995 an d
September 1997, using the same machine (1.0 T Magnetom
Expert, Siemens, Erlangen) and a standardized acquisition proto-
col. Exclusion criteria were conventional: (1) carrying a cardiac
pacemaker, valvular prosthesis, or other internal electrical/mag-
netic device; (2) history of neurosurgery or aneurysm; (3) presence
of metal fragments in the eyes, brain, or spinal cord; (4)
claustrophobia. MRI acquisition was performed after the bio-
logical/psychological testing.
The MRI acquisition which consisted of a three-dimensional
(3D) high-resolution T1-weighted brain volume was first acquired
using a 3D inversion recovery spoiled-gradient echo sequence (3D
IR-SPGR; TR = 97 ms; TE = 4 ms; TI = 300 ms; sagittal
acquisition). The 3D volume matrix size was 128
Â
256
Â
256,
with a 1.4
Â
0.89
Â
0.89 mm
3
voxel size. T2- and PD- (proton
density) weighted brain volumes were also acquired during the
same sequence using a 2D axial turbo spin-echo sequence with two
echo times (TR = 3500 ms; TE1 = 15 ms; TE2 = 85 ms; 23 cm
field of view). T2 and PD acquisitions consisted of 26 contiguous
Table 1
Sample characteristics
Men Women P value
Number of subjects 331 331
Age (years) 69.52 (3.09)
[63.77, 75.60]
69.56 (2.95)
[63.69, 75.47]
0.87
#
Education
level (years)
11.3 (3.8) [4, 20] 10.2 (3.0) [4, 20] 0.00051
y
Hypertensive
subjects (%)
48.0% 37.4% 0.0075
z
Right-handed
subjects (%)
89.7% 95.1% 0.012
z
MMSE score
(max = 30)
27.7 (2.0) 27.4 (2.0) 0.14
#
Mean (standard deviation); [range]; MMSE: Mini-mental state examination.
#
Student’s t test.
y
Wilcoxon rank sum and signed rank test.
z
Pearson’s chi-squared test.
H. Lemaıˆtre et al. / NeuroImage 26 (2005) 900–911 901
5-mm-thick axial slices (13.0 cm axial field of view), having a
256
Â
256 matrix size, and a 0.89
Â
0.89 mm
2
in-plane resolution.
Positioning in the magnet was based on a common landmark for all
subjects, namely, the orbito-meatal line, so that the entire brain,
including cerebellum and mid-brain, was contained within the field
of view of both T1 and T2/PD acquisitions. Data sets (T1, T2, and
PD) were readily reconstructed, visually checked for major
artifacts, before further analysis. Finally, only the T1- and T2-
weighted images were used in the framework of our study.
Image processing
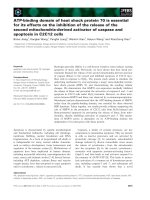
The T1- and T2-weighted images of each subject were first
aligned to each other (Woods et al., 1992) and then analyzed with
SPM99 ( We used the so-called
optimized Voxel-Based Morphometry (VBM) protocol (Good et
al., 2001) that we slightly modified in two ways in order to account
for the structural characteristics of aged brains (see Fig. 1). First,
GM, WM, and CSF templates specific to our database (EVA
priors) were used for tissue segmentation. Second, segmentation of
the CSF class was refined using T2 images.
Creating EVA priors
Tissue templates specific to our database (EVA priors) were
created using a sub-sample of 120 randomly selected subjects (60
men and 60 women) matched for age, hypertension frequency,
handedness, and education level with the entire group. Each of the
120 subject T1 volumes was segmented using the MNI priors
available in SPM, providing 120 individual GM, WM, and CSF
tissue maps. The 120 GM images were then non-linearly spatially
normalized to the GM MNI template (7
Â
8
Â
7 non-linear basis
functions in the three orthogonal directions). The normalization
parameters (deformation fields) obtained from the GM warping
step were then reapplied to the WM and CSF partition images, the
resulting images being further interpolated as 1 mm
3
isotropic
voxel volume. Individual GM, WM, and CSF image volumes were
further smoothed with an 8-mm full-width at half-maximum
isotropic Gaussian kernel. Finally, EVA priors were obtained by
computing GM, WM, and CSF probability maps based on the set
of 120 GM, WM, and CSF partition volumes, respectively.
Processing individual images of the 662 subjects cohort
Each subject T1 volume image was first segmented using
MNI priors in order to obtain a GM partition image in his
native space. This GM volume was then non-linearly spatially
normalized to the EVA GM template using 7
Â
8
Â
7 non-
linear basis functions in the three orthogonal directions.
Corresponding normalization parameters (deformati on fields)
were reapplied to the subject original brain T1 and T2 images,
the resulting images being further interpolated (1 mm
3
isotropic
voxel). The resulting normalized T1 volume was then
segmented using the EVA priors thereby providing GM, WM,
and CSF partition images (see Fig. 1, left side).
Optimizing the CSF partition image
Obtaining a good segmentation of the CSF compartment
requires an accurate definition of its borders. Accordingly, we
proceeded to a multi-spectral segmentation of both the T1 and T2
volumes, again using the EVA priors. An optimized CSF partition
image was obtained by subtracting the GM and WM partition
images provided by the first mono-spectral T1 segmentation from
the sum of the GM, WM, and CSF partition images provided by
this second segmentation (see Fig. 1, right side). In summary, the
final CSF partition images were derived from a multi-spectral
segmentation combining T1 and T2 volumes, while the final GM
and WM partition images were derived from the segmentation of
the T1 volumes only (see Fig. 1 for a detailed description of the
pipeline procedure). The improvement provided by this modified
CSF segmentation scheme was quantified by comparing the
absolute CSF and total intracranial volumes (see below for tissue
volumes estimation) obtained either without or with T2 image
inclusion in the segmentation process.
Image modulation
Finally, we applied a so-called bmodulationQ to each cerebral
partition image, adjusting their voxel intensities for the strength
of the deformation they were submitted to during the spatial
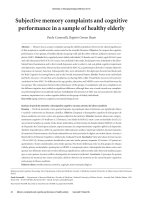
Fig. 1. Flow chart of the image processing protocol. The blue part is
equivalent to the optimized VBM protocol proposed by Good et al. (2001),
whereas the red part describes how T2-weighted MR images were
incorporated in order to optimize the CSF tissue segmentation. MRI:
whole brain images in their native space. GM, WM, and CSF: gray matter,
white matter, and cerebrospinal fluid tissue images, respectively. The
prefixes bnQ and bmQ denote images in the stereotactic space after
normalization and modulation, respectively. T1 and T1T2 indices refer to
mono-spectral (T1) and multi-spectral (T1 and T2) segmentations,
respectively. The figure shows four images corresponding to the same
axial slice of the same subject: nT1 and nT2 (gray-scaled) are the
normalized T1- and T2-weighted images, respectively, whereas nCSF
T1
and
nCSF
Opt
(color-scaled) are the CSF tissue images without and with
optimization, respectively. The skull inner and outer limits were derived
as iso-intensity contours in the normalized T2 image (nT2) and super-
imposed on both CSF tissue images.
H. Lemaıˆtre et al. / NeuroImage 26 (2005) 900–911902
normalization process (Good et al., 2001). Modulation preserves
the subject’s original tissue quantity after its transfer to the
reference space. Finally, all cerebral partition images were
smoothed with a 12-mm full-width at half-maximum isotropic
Gaussian kernel.
Volume estimation
For each subject, GM, WM, and CSF volumes were computed
as the integral of the voxel intensities over the corresponding
modulated tissue partition image. Total Intracranial Volume (TIV)
was computed as the sum of the GM, WM, and CSF volumes, and
fractional cerebral compartment volumes as the ratios of tissue
absolute volumes to TIV.
Statistical analysis
Volumetry
TIV and GM, WM, CSF absolute and fractional volumes were
analyzed using the same ANCOVA design, with bSexQ as the main
factor, bAgeQ as the covariate, including a bSexbyAgeQ
interaction. Significance level set at P b 0.05 for each tissue
volume analysis. Slopes of the linear regressions of cerebral
compartment volumes with age were estimated separately for men
and for women.
Tissue partition maps
ANCOVA was applied to modulated and smoothed GM, WM,
and CSF probability maps as implemented in SPM ( Friston et al.,
1995), using two different intensity normalizations: voxels of each
tissue partition map were scaled to either TIV value, adjusting for
head size, or to absolute cerebral compartment volume, searching
for local variations within each cerebral compartment. A map-wise
threshold of P b 0.05 corrected for multiple comparisons was used
for each tissue map analysis.
Results
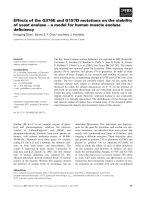
A brain atlas for healthy elderly
Fig. 2 shows selected slices through the average T1 volume,
and the GM, WM, and CSF probability maps computed over the
sample of 662 subjects. Such maps constitute a probabilistic brain
atlas in healthy elderly human subjects aged between 63 and 75
years. GM and WM atrophy, and CSF enlargement, are the most
prominent features of these maps when compared with their
counterparts in young healthy adults. As such maps could be of
value for others working with anatomical/functional brain images
of aged subjects, they will be made available to the neuroimaging
community on the Internet.
Evaluation of the optimized CSF tissue segmentation
Using a multi-spectral rather than a mono-spectral segmentation
led to smaller average volumes both for the CSF (357 F 58 cm
3
vs.
494 F 68 cm
3
, mean F SD, n = 662) and for TIV (1371 F 132
cm
3
vs. 1515 F 134 cm
3
). It also gave a larger age-related CSF
volume increase (3.6 cm
3
/year vs. 2.3 cm
3
/year) and a smaller age-
related TIV decrease (0.4 cm
3
/year vs. 1.7 cm
3
/year). This last
finding constitutes a clear indication that including T2 images
improved the CSF segmentation since one cannot expect TIV to
significantly decrease over such a short age range. In the
subsequent results, we will thus only consider the CSF volume
obtained with the multi-spectral segmentation only.
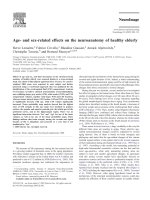
Fig. 2. Selected slices through the average (n = 662) normalized T1
volumes and corresponding gray matter (GM), white matter (WM), and
cerebrospinal fluid (CSF) probability maps. The gray scale applies to GM,
WM, and CSF tissue images and gives the probability for a voxel to belong
to the considered tissue. The location of the five axial slices is shown on a
three-dimensional rendering of the average T1 volume (z = 49, 31, 15, À1,
and À17 mm from the biÀcommissural plane, respectively).
Table 2
Sex and age effects and bSex by AgeQ interaction on absolute cerebral
compartment volumes
Men Women Sex effect
( P value)
Age effect
( P value)
Sex by
Age
( P value)
TIV 1454 (107) 1288 (100) b0.001 0.90 0.93
Slope À0.059
ns
À0.28
ns
GM 575 (44) 532 (38) b0.001 b0.001 0.37
Slope À1.73* À2.67**
WM 491 (46) 428 (43) b0.001 0.0043 0.97
Slope À1.67* À1.62*
CSF 387 (51) 327 (49) b0.001 b0.001 0.60
Slope 3.34** 4.01**
Mean (standard deviation) of absolute cerebral compartment volumes (in
cm
3
) in men and women (upper line) and slopes of their regression on age
(in cm
3
/year) with their significance levels (lower line): ns: non-significant,
*P b 0.05, **P b 0.001.
The last three columns give the P values of the Sex and Age effects as well
as the bSex by AgeQ interaction of the ANCOVA analysis. TIV: total
intracranial volume; GM: gray matter; WM: white matter; CSF: cerebro-
spinal fluid.
H. Lemaıˆtre et al. / NeuroImage 26 (2005) 900–911 903
Volumetric data
Results regarding absolute and fractional brain tissue volumes
are shown in Tables 2 and 3, respectively. As expected, TIV, GM,
WM, and CSF absolute volumes were larger in men than in
women. There was no bSex by AgeQ interaction for any of the
absolute cerebral compartment volumes. For the 662 subjects, TIV
was found to be unaffected by age, while GM (2.2 cm
3
/year) and
WM (1.7 cm
3
/year) volume significantly decreased with age, their
decreases being compensated by an equivalent increase of CSF
volume (3.6 cm
3
/year). Note, however, that the rate of GM loss
was somewhat smaller in men than in women whereas the rate of
WM loss was identical for both sexes. Nevertheless, the GM to
WM volume ratio did not vary with age and stayed higher in
women (1.25) than in men (1.18).
The GM fraction was found higher in women than in men,
whereas both the WM and CSF fractions were higher in men than
in women. There was a significant effect of age on all cerebral
compartment fractions, with no bSex by AgeQ interaction for any of
them but, again, the GM fraction decrease was somewhat larger in
women (0.20% per year) than in men (0.12% per year). For WM,
men and women exhibited the same rate of fractional volume
decrease (0.11% per year). The GM and WM fraction losses were
compensated by a rate of CSF fraction increase of 0.23% per year
for men and of 0.32% per year for women.
Voxel-based morphometry
Adjusted either by TIV or by cerebral compartment volumes,
the regional regression coefficients with age for the GM, WM, and
CSF compartments were not statistically different between men
and women (P b 0.05 corrected for multiple comparisons). As no
bSex by AgeQ interaction was found in any of the three compart-
ment maps, age-related effects on tissue distribution are presented
for the entire sample of 662 subjects. Note that a trend for a larger
(albeit not significant) age effect in women was observed in the
GM and CSF TIV-adjusted maps, similar to what was reported
above for cerebral compartment volumes when expressed as TIV
fractions. However, this trend vanished when the tissue maps were
adjusted for tissue volumes rather than for TIV.
Age-related changes in tissue probability maps corrected for TIV
The age-related variations of GM, WM, and CSF probability
maps corrected for TIV are depicted in the Fig. 3. The rate of
GM loss was highest in primary cortices, including the Heschl’s
gyrus, the cortex surrounding the Calcarine fissure and the pre-
and postcentral gyri. Rates of GM losses were also very high in
the angular and superior parietal gyri, in the orbital part of the
prefrontal cortex, and in the hippocampal region. By contrast,
the rate of GM losses appeared marginal in areas such as the
lateral and medial surfaces of the superior frontal gyri, the
median cingulate gyrus, and the inferior temporal gyrus.
Interestingly, we found positive regression slopes with age in
the subcortical gray nuclei bordering the third and lateral
ventricles, namely, the caudate nuclei, putamen, pallidum, and
thalami.
For the white matter, the general pattern brought out high WM
losses in the corpus callosum and in the major pathways surrounding
the lateral ventricles such as the anterior and posterior callosal fibers,
the optical tracts, and the posterior limb of the internal capsule. By
contrast, smaller WM fasciculi, close to the cortical surface, did not
show any significant variations with age.
Finally, increase of CSF with age was highest in the third and
lateral ventricles, and in the interhemispheric and Sylvian fissures.
Age-related changes in tissue probability maps corrected for
absolute cerebral compartment volumes
The effect of age on GM, WM, or CSF maps corrected for their
absolute tissue volumes is summarized in Fig. 4 and Table 4.
Variability of cranial vault was implicitly accounted for in these
analyses since each global cerebral compartment volume was
highly correlated with TIV (r
2
= 0.81, 0.91, and 0.77 for GM, WM,
and CSF, respectively, P b 0.001 in all three cases). The results
show, for each cerebral compartment, the regions in which the age-
related rate of local volume variation exceeds that of the global
tissue volume. Significantly higher reductions of GM with age
were found in the Heschl’s, precentral, postcentral, middle frontal
(orbital part), and superior parietal gyri, as well as in the
hippocampus. Meanwhile, the rate of WM losses was significantly
higher in the bundle of fibers running alongside the lateral
ventricles and in the genu of the corpus callosum. By contrast,
the increase of CSF was homogeneous over the entire compartment
as no significant regional age-related increase was found in the
CSF map of subjects when adjusted for their CSF global volume.
Discussion
Enhanced CSF compartment using multi-spectral segmentation in
the elderly
Including T2 images in the tissue segmentation procedure
resulted in a better characterization of the outer border of the CSF
compartment and a more realistic CSF probability values in the
ventricles and major sulci. This was expected since T2 images
exhibit a good contrast between the subarachnoidal CSF and the
dura mater adhering to the inner skull surface. However, the larger
Table 3
Sex and age effects and bSex by AgeQ interaction on fractional cerebral
compartment volumes
Men Women Sex effect
( P value)
Age
effect
( P value)
Sex by
Age
( P value)
GM fraction 0.396
(0.021)
0.414
(0.021)
b0.001 b0.001 0.11
Slope À0.12* À0.20**
WM fraction 0.337
(0.016)
0.332
(0.017)
b0.001 b0.001 0.89
Slope À0.11** À0.11**
CSF fraction 0.266
(0.027)
0.253
(0.028)
b0.001 b0.001 0.19
Slope 0.23** 0.32**
GM/WM 1.18
(0.08)
1.25
(0.09)
b0.001 0.65 0.38
Slope 0.00042
ns
À0.0015
ns
Mean (standard deviation) of fractional cerebral compartment volumes
(relative to TIV) and of the gray to white matter ratio in men and women
(upper line) and slopes of their regression on age (in %/year) with their
significance levels (lower line): ns: non-significant, *P b 0.01, **P b 0.001.
The last three columns give the P values of the Sex and Age effects as well
as the bSex by AgeQ interaction of the ANCOVA analysis. GM: gray matter;
WM: white matter; CSF: cerebrospinal fluid.
H. Lemaıˆtre et al. / NeuroImage 26 (2005) 900–911904
slice thickness of the original T2 images (5 mm) as compared to
the original T1 images (1.4 mm) induced an important partial
volume effect, which affected the quality of the multi-spectral
segmentation. For this reason, multi-spectral segmentation was
only used to classify the voxels belonging to the CSF compart-
ments, while the GM and WM compartments were obtained with a
mono-spectral segmentation of T1 images. Note that the CSF
volumes so estimated are consistent both with another in vivo
study that also used a multi-spectral segmentation (Courchesne et
al., 2000) and with postmortem data (Blinkov and Glezer, 1968).
Actually, mono-spectral segmentation leads to an underestimation
of the CSF volume in the oldest subjects (i.e., those who present
the largest atrophy). Consequently, when estimated using a mono-
spectral segmentation, TIV appears to decrease with age in the
elderly while it stays roughly constant when estimated with a
multi-spectral segmentation. Note that a previous study using the
same optimized VBM approach and T1-weighted image segmen-
tation only, also reported a linear decline of TIV with age for men
but not for women (Good et al., 2001). As the age of the subjects of
this latter study spread over seven decade s, these authors
interpreted the TIV decrease as a secular trend of increasing
cranial vault over the last century. Obviously, such an explanation
does not hold for our findings since they were observed over a
single decade (cranial perimeter and height of our subjects did not
vary with age). The fact that TIV decrease with age could be
corrected by including T2-weighted images in the segmentation
leads us to conclude that it was an artifact of the mono-spectral
segmentation.
Age effects in cross-sectional versus longitudinal studies
Before discussing our results in details, it is also worthwhile
discussing the intrinsic limitations of cross-sectional studies, such
as ours, where age effects on neuroanatomy are measured at a
single time across a sample of subjects having different ages. The
limited age range of our cohort does limit potential secular effects
on brain volumes that could severely bias cross-sectional studies
performed on the entire span of life (such as the increase in the
height, and as a result, the TIV, of subjects born between 1920 and
1990, for example). A short age range does not, however, reduce
the between-subject variability and statistical power loss that
characterize cross-sectional studies and make longitudinal studies
preferable. Conversely, very large samples are more manageable in
cross-sectional than in longitudinal studies, which can compensate
the statistical power difference between the two designs. For
instance, Davatzikos and Resnick (2002) found that age effects on
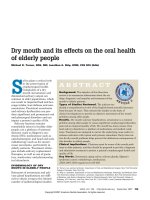
Fig. 3. Age-related gray matter, white matter, and cerebrospinal fluid volume regression maps (after correction for total intracranial volume). Regression maps
are superimposed onto their corresponding tissue probability maps and displayed without statistical threshold. The hot (green to red) and cold (green to blue)
color scales represent the negative and positive slopes with age, respectively. The location of the axial slices is shown on a three-dimensional rendering of the
average T1 volume [z = 59, 49, 39, 31, 23, 15, 7, 0, À9, and À17 mm from the bi-commissural plane (pink box), respectively]. L: Left; R: Right.
H. Lemaıˆtre et al. / NeuroImage 26 (2005) 900–911 905
white matter connectivity in elderly were significant both in cross-
sectional and longitudinal studies, but that longitudinal findings
were more pronounced than cross-sectional ones. Amazingly, the
same authors performed a longitudinal study of 116 healthy elderly
subjects aged from 59 to 85 years, and did not find any detectable
changes in global or regional brain volumes over 1 year, while they
found rates of tissue loss of 1.4 cm
3
/year and 1.9 cm
3
/year for the
GM and WM, respectively, using a cross-sectional analysis on the
same sample (Resnick et al., 2000). These authors invoked, here,
the limits of their image processing accuracy when only subtle
cerebral changes are expected over a short period of time. Note,
however, that very short longitudinal investigation can be sufficient
to highlight neuroanatomical differences in pathological processes
such Alzheimer’s disease (Fox et al., 2001). Interestingly, re-
analyzing 92 subjects among their initial 116 ones over a 4-year
period, Resnick et al. (2003) found a 71% and 63% increase of the
GM and WM rate of atrophy as compared to the rates they
estimated in their previous cross-sectional analysis, showing that
when a larger period of time (3 to 4 years) separates two MRI
examinations of a longitudinal study, higher age-related effects on
brain atrophy rates are found in longitudinal analysis as compared
to cross-sectional ones.
Global age-related cerebral volume changes in healthy elderly
We observed a loss of 3.9 cm
3
/year of brain tissue (GM plus
WM), in agreement with previous studies dealing with elderly
subjects (Liu et al., 2003; Resnick et al., 2000, 2003). In fact, the
latter studies reported a loss of 4.4 cm
3
/year on average (range
from 3.2 to 5.4 cm
3
/year), a value very close to ours. However, the
rate of brain tissue loss we found was somewhat different from that
of studies based over the entire life span. Postmortem studies have
reported an age-related decrease of brain volume close to 2 cm
3
/
year between the third and eighth decades (Dekaban, 1978;
Pakkenberg and Gundersen, 1997). In addition, the average of
atrophy rates reported by MRI studies performed over the entire
life span sets at 2.5 cm
3
/year (range from 1.5 to 4.2 cm
3
/year)
(Blatter et al., 1995; Good et al., 2001; Guttmann et al., 1998;
Jernigan et al., 2001; Liu et al., 2003; Van Laere and Dierckx,
2001). Actually, according to some authors, the GM volume
linearly decreases starting from the second decade, whereas the
Fig. 4. Areas of age-related reductions in gray matter and white matter after correction for global tissue volume. Student’s t maps are superimposed onto their
corresponding tissue probability maps and displayed at a P b 0.05 significance level corrected for multiple comparisons. The x and z coordinates (in mm) give
the slice locations in the stereotactic space. L: left; R: right.
Table 4
Regional gray matter reduction with age
Anatomical
label
xyztvalue
Frontal L Precentral gyrus À53 10 43 5.4
L Middle frontal
gyrus, orbital part
À45 52 À2 5.2
R Middle frontal
gyrus, orbital part
43 47 À7 4.6
Parietal L Postcentral gyrus À56 À13 46 6.2
R Postcentral gyrus 50 À12 36 5.4
L Superior parietal
gyrus
À32 À70 53 5.7
Temporal L Heschl’s gyrus À43 À16 À2 6.0
R Heschl’s gyrus 42 À20 10 6.0
Limbic L Hippocampus À32 À40 À2 5.5
t value: Student’s t value (P b 0.05 corrected for multiple comparisons); xy
z: MNI space stereotactic coordinates in mm; L: left; R: right.
H. Lemaıˆtre et al. / NeuroImage 26 (2005) 900–911906
WM volume increases until the fourth decade and, then, decreases
in the following decades (Courchesne et al., 2000; Jernigan et al.,
2001). Thus, one should expect the annual rate of brain tissue loss
to increase in elderly. Our findings are consistent with this
hypothesis and confirm that brain shrinkage is a non-linear
phenomenon over the life span that accelerates after the sixth
decade.
We found that GM and WM almost equally contributed to brain
shrinkage, no significant difference being observed between the
annual atrophy rates of these two brain compartments (P = 0.58).
This is in agreement with the findings of two previous studies in
elderly (Resnick et al., 2000, 2003), and with those of another
study dealing with a larger age range sample (Good et al., 2001).
However, the regression slopes we found for GM (2.2 cm
3
/year)
and WM (1.7 cm
3
/year) do not fit with the supposed larger WM
loss rate proposed by other authors (Guttmann et al., 1998; Liu et
al., 2003). Difference in study designs (i.e., cross-sectional vs.
longitudinal) is an unlikely explanation given the short age range
of the samples of the Liu study and of ours. Rather, even though
we could not find in the two above reports whether or not the
atrophy rates of GM and WM were significantly different (both
reports state that the rate of atrophy is significant for WM only), we
believe that the use of different segmentation procedure could be at
the origin of these discrepant findings. First, note that Guttmann et
al. (1998) use d T2- and PD-weighted images only for the
segmentation step which renders the GM/WM limit hard to define.
Second, in elderly subjects aged from 57 to 77 years, Liu et al.
(2003) reported an annual loss of brain tissue (GM plus WM) that
did not match the corresponding annual increase of CSF in the
same sample, the unexplained 1.4 cm
3
/year difference being
possibly the consequence of an inaccurate tissue segmentation. It
seems thus reasonable to assume that GM and WM contributions to
brain shrinkage are similar during the seventh and eighth decades,
but additional studies focusing on the following decades are
needed to check whether this holds later in life.
Voxel-wise age-related changes in healthy elderly
The regional distribution of age-related reduction of GM
volume was found to be very heterogeneous, some areas seeming
particularly vulnerable, others being relatively spared. Interest-
ingly, the largest rates of atrophy were found in the primary
auditory, somatosensory, and motor cortices (see Fig. 4). Highly
negative regression slopes of GM density with age were also
observed in the primary visual cortex but failed to reach
significance after adjustment for the global GM rate of atrophy.
We believe this lack of significance to be the consequence of
higher residual standard errors of the regression slope estimated in
this region (about twofold the average residual standard error
computed over the whole GM map as indicated by analysis of the
residual variance image). This is likely to be due to the high
residual anatomical variance given both the large spatial variability
of the Calcarine fissure (Thompson et al., 1996) and the relative
small cortical thickness (Von Economo, 1929) observed in the
primary visual cortex as compared to other regions (see also the
GM probability map in Fig. 2). Thus, notwithstanding the lack of
significant findings, we believe that the primary visual cortex
should be considered as a focus of age-related GM reduction, as
well as others primary cortices.
More generally, it should be stressed that VBM findings are
influenced by the amount of residual anatomical variability between
subjects after spatial normalization (Crivello et al., 2002; Good et
al., 2001) since this procedure does not perfectly align cerebral
structures between subjects. However, we believe this bias source to
have a weak impact on our findings. First, the smoothing applied to
our images (FWHM = 12 mm) dramatically reduces the inter-
individual misalignment of cerebral structures after spatial normal-
ization. Second, the very large number of subjects included in our
study, as opposed to studies performed on relative small samples,
acts as a supplementary image smoothing process, compensating in
part the anatomical residual variability. As a matter of fact,
inspection of the residual variance image, that partly reflects the
spatial distribution of the inter-individual anatomical variability,
revealed that the occipital cortex was the only region presenting a
high negative regression coefficient associated with a high residual
variance. Meanwhile, the same image also revealed that many
associative regions presented small residual variances, a pattern also
shared by the primary cortices (except the primary visual one).
These findings allow to refute the idea that the strong age effect
found on primary cortices could be explained by a weaker inter-
individual anatomical variability in these regions.
Note that primary cortices have been previously reported as
spared by the aging processes (Jernigan et al., 2001; Raz et al.,
1997), as predicted with the classical blast in, first outQ brain area
aging theory (Raz, 2001). Actually, a close look at the most recent
literature reveals that several studies, using a voxel-based approach
similar to ours, have mentioned primary cortices as the seat of large
rates of atrophy (Good et al., 2001; Resnick et al., 2003; Salat et
al., 2004; Tisserand et al., 2004). Concerning the age-related
decline in perisylvian regions such as insula and Heschl’s gyrus,
Tisserand et al. (2004) suggested that cerebral regions with
complex anatomical boundaries for manual tracing have been
largely ignored in aging studies using classical ROI approach. This
assumption may partially explain why we found in the present
study some new cerebral regions vulnerable to aging. Such
converging results require reconsidering the status of the primary
cortices in normal aging. One could postulate that, whereas the
associative cortices are particularly affected in pathological aging
such as Alzheimer’s disease, the same associative cortices would
be distinctly less affected and primary cortices more vulnerable in
normal aging. This hypot hesis is consistent with reports of
cognitive decline of the lowest echelons of sensory and motor
systems in healthy elderly subjects (Kaye et al., 1994). Moreover,
several studies have shown that, in absence of peripheral sensor
age-related changes, hearing loss, visual decline, as well as motor
slowness during aging could be associated to an affliction of their
respective primary cortices (Mendelson and Ricketts, 2 001;
Schmolesky et al., 2000; Yordanova et al., 2004).
The other areas where preferential age-related GM reduction
was observed, included the hippocampus and the orbital part of the
middle frontal gyri and are more classically found in studies
dealing with normal and/or pathological brain aging (Petersen et
al., 2000; Salat et al., 2001).
The prefrontal cortex is usually considered as the structure most
affected during normal aging, all age ra nges taken together
(Jernigan et al., 2001; Raz et al., 1997), and therefore is a key
region of the frontal aging theory (relating that the major part of
cognitive aging is related to a structural deficit of the prefrontal
cortex, West, 1996). In recent whole brain exploratory studies, GM
reduction with age was also found in the left middle frontal gyrus
(Good et al., 2001), the orbital and inferior frontal cortex (Resnick
et al., 2003), the frontal pole and dorsolateral prefrontal cortex
H. Lemaıˆtre et al. / NeuroImage 26 (2005) 900–911 907
(Tisserand et al., 2004), or the inferior lateral prefrontal cortex
(Salat et al., 2004). Therefore, taking into account nomenclature
differences, the orbital part of the middle frontal gyrus appears to be
a preferential target for age-related decrease of GM in healthy
elderly. Note that this area has been reported in functional
neuroimaging studies as mainly involved in maintaining informa-
tion in working memory (see Tisserand and Jolles, 2003 for review).
In this context, increased atrophy rates in this area in healthy elderly
may constitute an early neural correlate of future diminished
performances in executive functions. Nevertheless, because of the
importance of the prefrontal cortex in cognitive aging, future
imaging studies are clearly needed to better differentiate the specific
functions of the different frontal regions in relation to aging.
Regarding the hippocampus, although it is a key target of age-
related memory changes, previous studies have experienced
difficulty to demonstrate significant hippocampal atrophy with
age in absence of Alzheimer’s disease (Jack et al., 2002).
Interestingly, Raz et al. (2004a) recently showed a non-linear
relationship between the hippocampus volume and age, the rate of
atrophy in this region being small until the sixth decade, while
larger atrophy rate occurs afterwards. This model fits with our
findings, observed in a sample of subjects aged between 63 and 75
years, as well as with those of two other studies dealing with
subjects over 50 years (Resnick et al., 2003; Tisserand et al., 2004).
The biological mechanisms driving the differential age vulner-
ability of the various cortical regions remain unclear. Age-related
impairment of specific neurotransmitter systems, such as the
dopaminergic or cholinergic systems (Kaasinen and Rinne, 2002;
Mesulam, 1995), may be put forward. As a matter of fact, key
structures of these two systems (the substantia nigra and the nucleus
basalis of Meynert, respectively) show a loss of dopaminergic/
cholinergic neurons with age (Rehman and Masson, 2001). This
could in turn trigger atrophy in the cortical structures on which these
subcortical nuclei mainly project, such as the prefrontal cortex and
the hippocampus (Goldman-Rakic and Brown, 1981; Volkow et al.,
2000; Wenk et al., 1989). However, further investigations are
clearly needed to determine the exact link between regional atrophy
and the impairment of the neurotransmitter systems.
Surprisingly, regional GM analysis also revealed some foci of
age-related increase which were localized bilaterally in the caudate,
putamen and pallidum, and thalami, a phenomenon previously
reported by others (Good et al., 2001). Although these areas may
be less affected than others by aging, we agree with others that they
must also be the seat of a normal age-related shrinkage (Gunning-
Dixon et al., 1998). Thus, we believe that what we observed in
these areas could be an artifact due to the presence of particular
GM/CSF and GM/WM interfaces. First, the age-related ventricle
enlargement due to brain atrophy could lead to a displacement of
adjacent gray nuclei simulating an artificial increase of GM with
age in voxel-based approaches. Secondly, the volume left by the
loss of myelin in the WM fibers of the internal capsule (Abe et al.,
2002) could be replaced by putamen and pallidum neuron cell
bodies, producing an apparent spatial expansion of GM. Alter-
nately, Ylikoski et al. (1995) reported in healthy elderly an age-
related increase of white matter hyperintensities (WMH) in the
periventricular areas. This type of lesion, observed with a
hyposignal in T1-weighted images, could be potentially misclassi-
fied as GM and imitate an increase of GM with age. This remark is
all the more right as several subjects were hypertensive and as
hypertension has been significantly associated with an increased
severity of WMH in our cohort of subjects (Dufouil et al., 2001).
Finally, as opposed to what was found for the GM, there were
only few areas of accelerated WM atrophy with age after removal
of the global age-related WM volume reduction. In fact,
accelerated WM atrophy rates were observed almost exclusively
in the corpus callosum, in agreement with the findings of a
previous study in healthy subjects aged between 70 and 82 years
(Sullivan et al., 2002). Such age-related WM reduction could be
attributed to the micro-structural deterioration of the WM identified
in diffusion imaging studies (Pfefferbaum et al., 2000), which was
interpreted as a demyelination of WM fibers during aging (Meier-
Ruge et al., 1992). Otherwise, the ventricular enlargement in aging
could determine partly the age-related changes in WM fibers
surrounding ventricles by a simple mechanical force (Peterson et
al., 2001).
Global versus voxel-wise age-related brain changes
The results obtained in the TIV-adjusted VBM analysis show, at
the voxel level, the same age-related trends that those observed at
the cerebral volumetric level. Such concordance is explained by the
fact that the TIV-adjusted VBM analysis did not take into account
the age effect on the cerebral volumes. Therefore, the age-related
changes estimated in the fractional cerebral volumes reflect the
global outcome of all age-related variations identified at the voxel
level. By contrast, adjusting VBM analysis for absolute cerebral
volumes rather than TIV provided quasi-identical age-related
regression maps of GM, WM, and CSF compartments between
men and women. This means that the regional pattern of age-
related changes were similar in men and women for each tissue
taken separately. More generally, the age effects on global cerebral
volumes and on tissue maps do not necessarily match since VBM
findings are highly dependent on the kind of adjustment used (TIV
or cerebral volumes for instance). Thus, several scenarios can be
envisaged. On the one hand, if a VBM analysis is not adjusted for a
global effect, this global effect naturally spreads over regionally,
and as a consequence, the volumetric and VBM findings are well
related. On the other hand, if the global effect is modeled and
adjusted for in a VBM analysis, regional changes due to this effect
(i.e., regional changes greater that the global one) could be
highlighted or not, leading to related or discrepant findings
between volumetric and VBM findings.
Sex effect on structural brain aging
The neuroanatomical sexual dimorphism we observed in
healthy elderly is in close agreement with previous observation
in younger adults (Gur et al., 1999). In addition, we did not find
any significant bSex by AgeQ interaction either on global cerebral
compartment volumes (either absolute or fractional) or in tissue
probability maps, although a trend for larger rate of GM loss and
CSF increase was present in women (associated with a larger age-
related decline of MMSE score in women). These findings are in
contradiction with the common idea that men brains are more
vulnerable to aging (Coffey et al., 1998). In a sample of elderly
aged from 66 to 96 years, these authors reported an increase of
sulcal CSF volume in men only. Taking a sub-sample of subjects
aged from 65 to 75 years, the same authors highlighted an annual
rate of sulcal CSF increase for men and women of 2.1 and 0.06
cm
3
/year, respectively. By contrast, we estimated an annual rate of
CSF increase (including sulcal and ventricular CSF compartments)
for men and women of 3.3 and 4.0 cm
3
/year, respectively.
H. Lemaıˆtre et al. / NeuroImage 26 (2005) 900–911908
A possible explanation of this discrepancy could come from
differences in hypertensive subject proportion or education level
between men and women in our cohort. Indeed, some studies have
reported the effect of these two factors on the neuroanatomical
aging. For example, concerning the hypertension, Strassburger et
al. (1997) reported a greater cerebral atrophy in occipital and
temporal regions for hypertensive elderly subjects as compared to
normotensive elderly subjects. Concerning the education level,
Coffey et al. (1999) highlighted a positive correlation between the
number of years of education and the peripheral CSF volume in
healthy elderly subjects. However, including these variables, as
confounding factors in the analysis, did not modify our results. One
could also raise the issue of using a common normalization
template, including both men and women, with the possible
ensuing bias of reproducing a similar atrophy scheme in men and
women. However, using a specific template for each sex did not
significantly modify our results.
Rather, Coffey et al. (1998) also reported no sex effect on brain
atrophy on the same sample, what seems contradictory with their
findings concerning the CSF and may indicate a problem in
volume estimation that could possibly originate from the manual
tissue segmentation performed in this study.
As other recent studies (Resnick et al., 2000, 2003), based on
automated image segmentation rather than manual tracing, also
reported no bSex by AgeQ interaction in healthy elderly, one is led to
admit that in their seventh and eighth decades, men brain are not
more, if not less, vulnerable to aging than that of women. Arguments
in favor of this hypothesis may be found in several studies of white
matter lesions that have shown a larger prevalence of this type of
lesions in women compared to men aged over 60 years (Sijens et al.,
2001; Wen and Sachdev, 2004), which may be due to a larger age-
related decrease of the brain choline level in women (Sijens et al.,
2003). The drastic changes in circulating hormone concentrations
due to menopause in women around age 50 years could be one cause
of such phenomenon (Lamberts, 2002; Raz et al., 2004c), but this
assertion requires further investigations to be validated.
Conclusion
Modifications of brain anatomy in the seventh and eighth
decades appear to be characterized by (1) a shrinkage due to
approximate equal loss of gray and white matter, (2) an
inhomogeneous cortical pattern of atrophy rates, larger rates being
observed in primary cortices as well as in associative and limbic
areas. These modifications seem to be sex independent.
Acknowledgments
This study has been conducted within the framework of the
ICBM project ( The authors are
grateful to N. Tzourio-Mazoyer for her thoughtful comments on
the manuscript. H. Lemaıˆtre and B. Grassiot are supported by
grants from the Commissariat a` l’Energie Atomique and the Basse-
Normandie Regional Council.
References
Abe, O., Aoki, S., Hayashi, N., Yamada, H., Kunimatsu, A., Mori, H.,
Yoshikawa, T., Okubo, T., Ohtomo, K., 2002. Normal aging in the
central nervous system: quantitative MR diffusion-tensor analysis.
Neurobiol. Aging 23, 433– 441.
Bigler, E.D., Anderson, C.V., Blatter, D.D., Andersob, C.V., 2002.
Temporal lobe morphology in normal aging and traumatic brain injury.
Am. J. Neuroradiol. 23, 255 –266.
Blatter, D.D., Bigler, E.D., Gale, S.D., Johnson, S.C., Anderson, C.V.,
Burnett, B.M., Parker, N., Kurth, S., Horn, S.D., 1995. Quantitative
volumetric analysis of brain MR: normative database spanning 5
decades of life. Am. J. Neuroradiol. 16, 241 – 251.
Blinkov, S.M., Glezer, I.I., 1968. The Human Brain in Figures and Tables,
A Quantitative Handbook. Plenum Press, New York.
Braak, E., Griffing, K., Arai, K., Bohl, J., Bratzke, H., Braak, H., 1999.
Neuropathology of Alzheimer ’s disease: what is new since A.
Alzheimer? Eur. Arch. Psychiatry Clin. Neurosci. 249 (Suppl. 3),
14 – 22.
Coffey, C.E., Wilkinson, W.E., Parashos, I.A., Soady, S.A., Sullivan, R.J.,
Patterson, L.J., Figiel, G.S., Webb, M.C., Spritzer, C.E., Djang, W.T.,
1992. Quantitative cerebral anatomy of the aging human brain: a
cross-sectional study using magnetic resonance imaging. Neurology
42, 527– 536.
Coffey, C.E., Lucke, J.F., Saxton, J.A., Ratcliff, G., Unitas, L.J., Billig, B.,
Bryan, R.N., 1998. Sex differences in brain aging: a quantitative
magnetic resonance imaging study (published erratum appears in Arch.
Neurol. 1998 May;55(5):627). Arch. Neurol. 55, 169 – 179.
Coffey, C.E., Saxton, J.A., Ratcliff, G., Bryan, R.N., Lucke, J.F., 1999.
Relation of education to brain size in normal aging: implications for the
reserve hypothesis. Neurology 53, 189 –196.
Courchesne, E., Chisum, H.J., Townsend, J., Cowles, A., Covington, J.,
Egaas, B., Harwood, M., Hinds, S., Press, G.A., 2000. Normal brain
development and aging: quantitative analysis at in vivo MR imaging in
healthy volunteers. Radiology 216, 672 – 682.
Crivello, F., Schormann, T., Tzourio-Mazoyer, N., Roland, P.E., Zilles, K.,
Mazoyer, B.M., 2002. Comparison of spatial normalization procedures
and their impact on functional maps. Hum. Brain Mapp. 16, 228 – 250.
Davatzikos, C., Resnick, S.M., 2002. Degenerative age changes in white
matter connectivity visualized in vivo using magnetic resonance
imaging. Cereb. Cortex 12, 767 – 771.
Dekaban, A.S., 1978. Changes in brain weights during the span of human
life: relation of brain weights to body heights and body weights. Ann.
Neurol. 4, 345 – 356.
Dufouil, C., Kersaint-Gilly, A., Besancon, V., Levy, C., Auffray, E.,
Brunnereau, L., Alperovitch, A., Tzourio, C., 2001. Longitudinal study
of blood pressure and white matter hyperintensities: the EVA MRI
cohort. Neurology 56, 921– 926.
Folstein, M., Anthony, J.C., Parhad, I., Duffy, B., Gruenberg, E.M., 1985.
The meaning of cognitive impairment in the elderly. J. Am. Geriatr.
Soc. 33, 228 – 235.
Fox, N.C., Crum, W.R., Scahill, R.I., Stevens, J.M., Janssen, J.C., Rossor,
M.N., 2001. Imaging of onset and progression of Alzheimer’s disease
with voxel-compression mapping of serial magnetic resonance images.
Lancet 358, 201 – 205.
Friston, K.J., Holmes, A.P., Worsley, K.J., Poline, J.B., Frith, C.D.,
Frackowiak, R.S.J., 1995. Statistical parametric maps in functional
imaging: a general approach. Hum. Brain Mapp. 2, 189– 210.
Goldman-Rakic, P.S., Brown, R.M., 1981. Regional changes of mono-
amines in cerebral cortex and subcortical structures of aging rhesus
monkeys. Neuroscience 6, 177– 187.
Good, C.D., Johnsrude, I.S., Ashburner, J., Henson, R.N., Friston, K.J.,
Frackowiak, R.S., 2001. A voxel-based morphometric study of ageing
in 465 normal adult human brains. NeuroImage 14, 21– 36.
Gunning-Dixon, F.M., Head, D., McQuain, J., Acker, J.D., Raz, N., 1998.
Differential aging of the human striatum: a prospective MR imaging
study. Am. J. Neuroradiol. 19, 1501 – 1507.
Gur, R.C., Turetsky, B.I., Matsui, M., Yan, M., Bilker, W., Hughett, P., Gur,
R.E., 1999. Sex differences in brain gray and white matter in healthy
young adults: correlations with cognitive performance. J. Neurosci. 19,
4065 –4072.
Gur, R.C., Gunning-Dixon, F.M., Turetsky, B.I., Bilker, W.B., Gur, R.E.,
2002. Brain region and sex differences in age association with brain
H. Lemaıˆtre et al. / NeuroImage 26 (2005) 900–911 909
volume: a quantitative MRI study of healthy young adults. Am. J.
Geriatr. Psychiatry 10, 72– 80.
Guttmann, C.R., Jolesz, F.A., Kikinis, R., Killiany, R.J., Moss, M.B.,
Sandor, T., Albert, M.S., 1998. White matter changes with normal
aging. Neurology 50, 972 – 978.
Hebert, L.E., Scherr, P.A., Bienias, J.L., Bennett, D.A., Evans, D.A., 2003.
Alzheimer disease in the US population: prevalence estimates using the
2000 census. Arch. Neurol. 60, 1119– 1122.
Jack, C.R., Dickson, D.W., Parisi, J.E., Xu, Y.C., Cha, R.H., O’Brien, P.C.,
Edland, S.D., Smith, G.E., Boeve, B.F., Tangalos, E.G., Kokmen, E.,
Petersen, R.C., 2002. Antemortem MRI findings correlate with hippo-
campal neuropathology in typical aging and dementia. Neurology 58,
750 –757.
Jernigan, T.L., Archibald, S.L., Fennema-Notestine, C., Gamst, A.C.,
Stout, J.C., Bonner, J., Hesselink, J.R., 2001. Effects of age on tissues
and regions of the cerebrum and cerebellum. Neurobiol. Aging 22,
581 –594.
Kaasinen, V., Rinne, J.O., 2002. Functional imaging studies of dopamine
sys tem and cognition in normal aging and Parkinson’s disease.
Neurosci. Biobehav. Rev. 26, 785– 793.
Kaye, J.A., Oken, B.S., Howieson, D.B., Howieson, J., Holm, L.A.,
Dennison, K., 1994. Neurologic evaluation of the optimally healthy
oldest old. Arch. Neurol. 51, 1205–1211.
Lamberts, S.W., 2002. The endocrinology of aging and the brain. Arch.
Neurol. 59, 1709 – 1711.
Liu, R.S., Lemieux, L., Bell, G.S., Sisodiya, S.M., Shorvon, S.D., Sander,
J.W., Duncan, J.S., 2003. A longitudinal study of brain morphometrics
using quantitative magnetic resonance imaging and difference image
analysis. NeuroImage 20, 22 – 33.
Meier-Ruge, W., Ulrich, J., Bruhlmann, M., Meier, E., 1992. Age-related
white matter atrophy in the human brain. Ann. N. Y. Acad. Sci. 673,
260 –269.
Mendelson, J.R., Ricketts, C., 2001. Age-related temporal processing speed
deterioration in auditory cortex. Hear. Res. 158, 84–94.
Mesulam, M.M., 1995. The cholinergic contribution to neuromodulation in
the cerebral cortex. Semin. Neurosci. 7, 297– 307.
Murphy, D.G., DeCarli, C., McIntosh, A.R., Daly, E., Mentis, M.J., Pietrini,
P., Szczepanik, J., Schapiro, M.B., Grady, C.L., Horwitz, B., Rapoport,
S.I., 1996. Sex differences in human brain morphometry and
metabolism: an in vivo quantitative magnetic resonance imaging and
positron emission tomography study on the effect of aging. Arch. Gen.
Psychiatry 53, 585 – 594.
Narr, K.L., Bilder, R.M., Toga, A.W., Woods, R.P., Rex, D.E., Szeszko,
P.R., Robinson, D., Sevy, S., Gunduz-Bruce, H., Wang, Y.P., DeLuca,
H., Thompson, P.M., in press. Mapping cortical thickness and gray
matter concentration in first episode schizophrenia. Cereb. Cortex.
Pakkenberg, B., Gundersen, H.J., 1997. Neocortical neuron number in
humans: effect of sex and age. J. Comp. Neurol. 384, 312 – 320.
Petersen, R.C., Jack Jr., C.R., Xu, Y.C., Waring, S.C., O’Brien, P.C., Smith,
G.E., Ivnik, R.J., Tangalos, E.G., Boeve, B.F., Kokmen, E., 2000.
Memory and MRI-based hippocampal volumes in aging and AD.
Neurology 54, 581 –587.
Peterson, B.S., Feineigle, P.A., Staib, L.H., Gore, J.C., 2001. Automated
measurement of latent morphological features in the human corpus
callosum. Hum. Brain Mapp. 12, 232–245.
Pfefferbaum, A., Mathalon, D.H., Sullivan, E.V., Rawles, J.M., Zipursky,
R.B., Lim, K.O., 1994. A quantitative magnetic resonance imaging
study of changes in brain morphology from infancy to late adulthood.
Arch. Neurol. 51, 874– 887.
Pfefferbaum, A., Sullivan, E.V., Hedehus, M., Lim, K.O., Adalsteinsson,
E., Moseley, M., 2000. Age-related decline in brain white matter
anisotropy measured with spatially corrected echo-planar diffusion
tensor imaging. Magn. Reson. Med. 44, 259 – 268.
Podruchny, T.A., Connolly, C., Bokde, A., Herscovitch, P., Eckelman,
W.C., Kiesewetter, D.O., Sunderland, T., Carson, R.E., Cohen, R.M.,
2003. In vivo muscarinic 2 receptor imaging in cognitively normal
young and older volunteers. Synapse 48, 39 – 44.
Raz, N., 2001. Ageing and the Brain. Encyclopedia of Life Sciences,
London.
Raz, N., Torres, I.J., Spencer, W.D., Baertschie, J.C., Millman, D., Sarpel, G.,
1993. Neuroanatomical correlates of age-sensitive and age-invariant cogQ
nitive abilities: an in vivo MRI investigation. Intelligence 17, 407 – 422.
Raz, N., Gunning, F.M., Head, D., Dupuis, J.H., McQuain, J., Briggs, S.D.,
Loken, W.J., Thornton, A.E., Acker, J.D., 1997. Selective aging of the
human cerebral cortex observed in vivo: differential vulnerability of the
prefrontal gray matter. Cereb. Cortex 7, 268 – 282.
Raz, N., Gunning-Dixon, F., Head, D., Rodrigue, K.M., Williamson, A.,
Acker, J.D., 2004a. Aging, sexual dimorphi sm, and hemispheric
asymmetry of the cerebral cortex: replicability of regional differences
in volume. Neurobiol. Aging 25, 377–396.
Raz, N., Rodrigue, K.M., Head, D., Kennedy, K.M., Acker, J.D., 2004b.
Differential aging of the medial temporal lobe: a study of a five-year
change. Neurology 62, 433 – 438.
Raz, N., Rodrigue, K.M., Kennedy, K.M., Acker, J.D., 2004c. Hormone
replacement therapy and age-related brain shrinkage: regional effects.
NeuroReport 15, 2531 – 2534.
Rehman, H.U., Masson, E.A., 2001. Neuroendocrinology of ageing. Age
Ageing 30, 279 – 287.
Resnick, S.M., Goldszal, A.F., Davatzikos, C., Golski, S., Kraut, M.A.,
Metter, E.J., Bryan, R.N., Zonderman, A.B., 2000. One-year age changes
in MRI brain volumes in older adults. Cereb. Cortex 10, 464– 472.
Resnick, S.M., Pham, D.L., Kraut, M.A., Zonderman, A.B., Davatzikos, C.,
2003. Longitudinal magnetic resonance imaging studies of older adults:
a shrinking brain. J. Neurosci. 23, 3295 – 3301.
Salat, D.H., Kaye, J.A., Janowsky, J.S., 2001. Selective preservation and
degeneration within the prefrontal cortex in aging and Alzheimer
disease. Arch. Neurol. 58, 1403 – 1408.
Salat, D.H., Buckner, R.L., Snyder, A.Z., Greve, D.N., Desikan, R.S., Busa,
E., Morris, J.C., Dale, A.M., Fischl, B., 2004. Thinning of the cerebral
cortex in aging. Cereb. Cortex 14, 721– 730.
Schmolesky, M.T., Wang, Y., Pu, M., Leventhal, A.G., 2000. Degradation
of stimulus selectivity of visual cortical cells in senescent rhesus
monkeys. Nat. Neurosci. 3, 384 – 390.
Sijens, P.E., Den Heijer, T., De Leeuw, F.E., De Groot, J.C., Achten, E.,
Heijboer, R.J., Hofman, A., Breteler, M.M., Oudkerk, M., 2001. Human
brain chemical shift imaging at age 60 to 90: analysis of the causes of
the observed sex differences in brain metabolites. Invest. Radiol. 36,
597 –603.
Sijens, P.E., den, H.T., Origgi, D., Vermeer, S.E., Breteler, M.M., Hofman,
A., Oudkerk, M., 2003. Brain changes with aging: MR spectroscopy at
supraventricular plane shows differences between women and men.
Radiology 226, 889 – 896.
Sowell, E.R., Peterson, B.S., Thompson, P.M., Welcome, S.E., Henkenius,
A.L., Toga, A.W., 2003. Mapping cortical change across the human life
span. Nat. Neurosci. 6, 309 – 315.
Strassburger, T.L., Lee, H.C., Daly, E.M., Szczepanik, J., Krasuski, J.S.,
Mentis, M.J., Salerno, J.A., DeCarli, C., Schapiro, M.B., Alexander,
G.E., 1997. Interactive effects of age and hypertension on volumes of
brain structures. Stroke 28, 1410 – 1417.
Sullivan, E.V., Pfefferbaum, A., Adalsteinsson, E., Swan, G.E., Carmelli,
D., 2002. Differential rates of regional brain change in callosal and
ventricular size: a 4-year longitudinal MRI study of elderly men. Cereb.
Cortex 12, 438 – 445.
Thompson, P.M., Schwartz, C., Lin, R.T., Khan, A.A., Toga, A.W., 1996.
Three-dimensional statistical analysis of sulcal variability in the human
brain. J. Neurosci. 16, 4261 – 4274.
Tisserand, D.J., Jolles, J., 2003. On the involvement of prefrontal networks
in cognitive ageing. Cortex 39, 1107 – 1128.
Tisserand, D.J., Visser, P.J., van Boxtel, M.P., Jolles, J., 2000. The relation
between global and limbic brain volumes on MRI and cognitive
performance in healthy individuals across the age range. Neurobiol.
Aging 21, 569 – 576.
Tisserand, D.J., van Boxtel, M.P., Pruessner, J.C., Hofman, P., Evans, A.C.,
Jolles, J., 2004. A voxel-based morphometric study to determine
H. Lemaıˆtre et al. / NeuroImage 26 (2005) 900–911910
individual differences in gray matter density associated with age and
cognitive change over time. Cereb. Cortex 14, 966 – 973.
Van Laere, K.J., Dierckx, R.A., 2001. Brain perfusion SPECT: age- and
sex-related effects correlated with voxel-based morphometric findings
in healthy adults. Radiology 221, 810–817.
Volkow, N.D., Logan, J., Fowler, J.S., Wang, G.J., Gur, R.C., Wong, C.,
Felder, C., Gatley, S.J., Ding, Y.S., Hitzemann, R., Pappas, N., 2000.
Association between age-related decline in brain dopamine activity and
impairment in frontal and cingulate metabolism. Am. J. Psychiatry 157,
75 –80.
Von Economo, C., 1929. The Cytoarchitectonics of the Human Cerebral
Cortex. Oxford Medical Publications, London.
Wen, W., Sachdev, P., 2004. The topography of white matter hyper-
intensities on brain MRI in healthy 60- to 64-year-old individuals.
NeuroImage 22, 144 – 154.
Wenk, G.L., Pierce, D.J., Struble, R.G., Price, D.L., Cork, L.C., 1989. Age-
related changes in multiple neurotransmitter systems in the monkey
brain. Neurobiol. Aging 10, 11– 19.
West, R.L., 1996. An application of prefrontal cortex function theory to
cognitive aging. Psychol. Bull. 120, 272–292.
Woods, R.P., Cherry, S.R., Mazziotta, J.C., 1992. Rapid automated
algorithm for aligning and reslicing PET images. J. Comput. Assist.
Tomogr. 16, 620– 633.
Ylikoski, A., Erkinjuntti, T., Raininko, R., Sarna, S., Sulkava, R., Tilvis, R.,
1995. White matter hyperintensities on MRI in the neurologically
nondiseased elderly. Analysis of cohorts of consecutive subjects aged 55
to 85 years living at home. Stroke 26, 1171 –1177.
Yordanova, J., Kolev, V., Hohnsbein, J., Falkenstein, M., 2004. Sensor-
imotor slowing with ageing is mediated by a functional dysregulation of
motor-generation processe s: evidence from high-resolution event-
related potentials. Brain 127, 351 – 362.
Yue, N.C., Arnold, A.M., Longstreth Jr., W.T., Elster, A.D., Jungreis,
C.A., O’Leary, D.H., Poirie r, V.C., Bryan, R.N., 1997. Sulcal,
ventricular, and white matter changes at MR imaging in the aging
brain: data from the cardiovascular health study (see comments).
Radiology 202, 33 – 39.
H. Lemaıˆtre et al. / NeuroImage 26 (2005) 900–911 911