APPENDIX A TO PART 136 METHODS FOR ORGANIC CHEMICAL ANALYSIS OF MUNICIPAL AND INDUSTRIAL WASTEWATER pot
Bạn đang xem bản rút gọn của tài liệu. Xem và tải ngay bản đầy đủ của tài liệu tại đây (288.7 KB, 27 trang )
APPENDIX A TO PART 136
METHODS FOR ORGANIC CHEMICAL ANALYSIS OF MUNICIPAL AND
INDUSTRIAL WASTEWATER
METHOD 624—PURGEABLES
1. Scope and Application
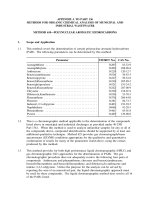
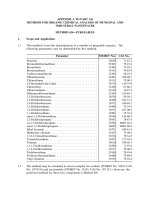
1.1 This method covers the determination of a number of purgeable organics. The
following parameters may be determined by this method:
Parameter STORET No. CAS No.
Benzene 34030 71-43-2
Bromodichloromethane 32101 75-27-4
Bromoform 32104 75-25-2
Bromomethane 34413 74-83-9
Carbon tetrachloride 32102 56-23-5
Chlorobenzene 34301 108-90-7
Chloroethane 34311 75-00-3
2-Chloroethylvinyl ether 34576 110-75-8
Chloroform 32106 67-66-3
Chloromethane 34418 74-87-3
Dibromochloromethane 32105 124-48-1
1,2-Dichlorobenzene 34536 95-50-1
1,3-Dichlorobenzene 34566 541-73-1
1,4-Dichlorobenzene 34571 106-46-7
1,1-Dichloroethane 34496 75-34-3
1,2-Dichloroethane 34531 107-06-2
1,1-Dichloroethane 34501 75-35-4
trans-1,2-Dichloroethene 34546 156-60-5
1,2-Dichloropropane 34541 78-87-5
cis-1,3-Dichloropropene 34704 10061-01-5
trans-1,3-Dichloropropene 34699 10061-02-6
Ethyl benzene 34371 100-41-4
Methylene chloride 34423 75-09-2
1,1,2,2-Tetrachloroethane 34516 79-34-5
Tetrachloroethene 34475 127-18-4
Toluene 34010 108-88-3
1,1,1-Trichloroethene 34506 71-55-6
1,1,2-Trichloroethene 34511 79-00-5
Trichloroethane 39180 79-01-6
Trichlorofluoromethane 34488 75-69-4
Vinyl chloride 39175 75-01-4
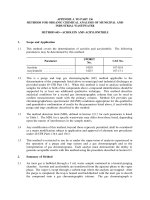
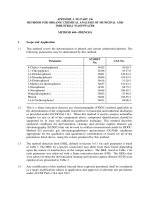
1.2 The method may be extended to screen samples for acrolein (STORET No. 34210, CAS
No. 107-02-8) and acrylonitrile (STORET No. 34215, CAS No. 107-13-1), however, the
preferred method for these two compounds is Method 603.
1.3 This is a purge and trap gas chromatographic/mass spectrometer (GC/MS) method
applicable to the determination of the compounds listed above in municipal and
industrial discharges as provided under 40 CFR Part 136.1.
1.4 The method detection limit (MDL, defined in Section 14.1) for each parameter is
1
listed in Table 1. The MDL for a specific wastewater may differ from those listed,
depending upon the nature of interferences in the sample matrix.
1.5 Any modification to this method, beyond those expressly permitted, shall be
considered as a major modification subject to application and approval of alternate
test procedures under 40 CFR Parts 136.4 and 136.5. Depending upon the nature of
the modification and the extent of intended use, the applicant may be required to
demonstrate that the modifications will produce equivalent results when applied to
relevant wastewaters.
1.6 This method is restricted to use by or under the supervision of analysts experienced
in the operation of a purge and trap system and a gas chromatograph/mass
spectrometer and in the interpretation of mass spectra. Each analyst must
demonstrate the ability to generate acceptable results with this method using the
procedure described in Section 8.2.
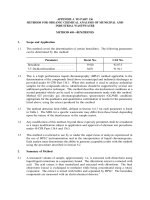
2. Summary of Method
2.1 An inert gas is bubbled through a 5 mL water sample contained in a
specially-designed purging chamber at ambient temperature. The purgeables are
efficiently transferred from the aqueous phase to the vapor phase. The vapor is swept
through a sorbent trap where the purgeables are trapped. After purging is completed,
the trap is heated and backflushed with the inert gas to desorb the purgeables onto a
gas chromatographic column. The gas chromatograph is temperature programmed to
separate the purgeables which are then detected with a mass spectrometer.
2,3
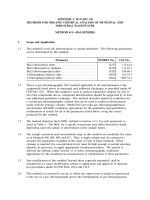
3. Interferences
3.1 Impurities in the purge gas, organic compounds outgassing from the plumbing ahead
of the trap, and solvent vapors in the laboratory account for the majority of
contamination problems. The analytical system must be demonstrated to be free from
contamination under the conditions of the analysis by running laboratory reagent
blanks as described in Section 8.1.3. The use of non-Teflon plastic tubing, non-Teflon
thread sealants, or flow controllers with rubber components in the purge and trap
system should be avoided.
3.2 Samples can be contaminated by diffusion of volatile organics (particularly
fluorocarbons and methylene chloride) through the septum seal into the sample
during shipment and storage. A field reagent blank prepared from reagent water and
carried through the sampling and handling protocol can serve as a check on such
contamination.
3.3 Contamination by carry-over can occur whenever high level and low level samples
are sequentially analyzed. To reduce carry-over, the purging device and sample
syringe must be rinsed with reagent water between sample analyses. Whenever an
unusually concentrated sample is encountered, it should be followed by an analysis of
reagent water to check for cross contamination. For samples containing large
amounts of water-soluble materials, suspended solids, high boiling compounds or
high pureeable levels, it may be necessary to wash the purging device with a
detergent solution, rinse it with distilled water, and then dry it in a 105°C oven
between analyses. The trap and other parts of the system are also subject to
contamination; therefore, frequent bakeout and purging of the entire system may be
required.
4. Safety
4.1 The toxicity or carcinogenicity of each reagent used in this method has not been
precisely defined; however, each chemical compound should be treated as a potential
health hazard. From this viewpoint, exposure to these chemicals must be reduced to
the lowest possible level by whatever means available. The laboratory is responsible
for maintaining a current awareness file of OSHA regulations regarding the safe
handling of the chemicals specified in this method. A reference file of material data
handling sheets should also be made available to all personnel involved in the
chemical analysis. Additional references to laboratory safety are available and have
been identified for the information of the analyst.
4-6
4.2. The following parameters covered by this method have been tentatively classified as
known or suspected, human or mammalian carcinogens: benzene, carbon
tetrachloride, chloroform, 1,4-dichlorobenzene, and vinyl chloride. Primary standards
of these toxic compounds should be prepared in a hood. A NIOSH/MESA approved
toxic gas respirator should be worn when the analyst handles high concentrations of
these toxic compounds.
5. Apparatus and Materials
5.1 Sampling equipment, for discrete sampling.
5.1.1 Vial—25 mL capacity or larger, equipped with a screw cap with a hole in the
center (Pierce #13075 or equivalent). Detergent wash, rinse with tap and
distilled water, and dry at 105°C before use.
5.1.2 Septum—Teflon-faced silicone (Pierce #12722 or equivalent). Detergent wash,
rinse with tap and distilled water, and dry at 105°C for one hour before use.
5.2 Purge and trap system—The purge and trap system consists of three separate pieces
of equipment: A purging device, trap, and desorber. Several complete systems are
now commercially available.
5.2.1 The purging device must be designed to accept 5 mL samples with a water
column at least 3 cm deep. The gaseous head space between the water column
and the trap must have a total volume of less than 15 mL. The purge gas
must pass though the water column as finely divided bubbles with a diameter
of less than 3 mm at the origin. The purge gas must be introduced no more
than 5 mm from the base of the water column. The purging device illustrated
in Figure 1 meets these design criteria.
5.2.2 The trap must be at least 25 cm long and have an inside diameter of at least
0.105 in. The trap must be packed to contain the following minimum lengths
of adsorbents: 1.0 cm of methyl silicone coated packing (Section 6.3.2), 15 cm
of 2,6-dyphenylene oxide polymer (Section 6.3.1), and 8 cm of silica gel
(Section 6.3.3). The minimum specifications for the trap are illustrated in
Figure 2.
5.2.3 The desorber should be capable of rapidly heating the trap to 180°C. The
polymer section of the trap should not be heated higher than 180°C and the
remaining sections should not exceed 200°C. The desorber illustrated in
Figure 2 meets these design criteria.
5.2.4 The purge and trap system may be assembled as a separate unit or be coupled
to a gas chromatograph as illustrated in Figures 3 and 4.
5.3 GC/MS system
5.3.1 Gas chromatograph—An analytical system complete with a temperature
programmable gas chromatograph suitable for on-column injection and all
required accessories including syringes, analytical columns, and gases.
5.3.2 Column—6 ft long x 0.1 in ID stainless steel or glass, packed with 1% SP-1000
on Carbopack B (60/80 mesh) or equivalent. This column was used to develop
the method performance statements in Section 14. Guidelines for the use of
alternate column packings are provided in Section 11.1.
5.3.3 Mass spectrometer—Capable of scanning from 20-260 amu every
seven seconds or less, utilizing 70 V (nominal) electron energy in the electron
impact ionization mode, and producing a mass spectrum which meets all the
criteria in Table 2 when 50 ng of 4-bromofluorobenzene (BFB) is injected
through the GC inlet.
5.3.4 GC/MS interface—Any GC to MS interface that gives acceptable calibration
points at 50 ng or less per injection for each of the parameters of interest and
achieves all acceptable performance criteria (Section 10) may be used. GC to
MS interfaces constructed of all glass or glass-lined materials are
recommended. Glass can be deactivated by silanizing with
dichlorodimethylsilane.
5.3.5 Data system—A computer system must be interfaced to the mass spectrometer
that allows the continuous acquisition and storage on machine-readable media
of all mass spectra obtained throughout the duration of the chromatographic
program. The computer must have software that allows searching any
GC/MS data file for specific m/z (masses) and plotting such m/z abundances
versus time or scan number. This type of plot is defined as an Extracted Ion
Current Profile (EICP). Software must also be available that allows integrating
the abundance in any EICP between specified time or scan number limits.
5.4 Syringes—5 mL, glass hypodermic with Luerlok tip (two each), if applicable to the
purging device.
5.5 Micro syringes—25 µL, 0.006 in. ID needle.
5.6 Syringe valve—Two-way, with Luer ends (three each).
5.7 Syringe—5 mL, gas-tight with shut-off valve.
5.8 Bottle—15 mL, screw-cap, with Teflon cap liner.
5.9 Balance—Analytical, capable of accurately weighing 0.0001 g.
6. Reagents
6.1 Reagent water—Reagent water is defined as a water in which an interferent is not
observed at the MDL of the parameters of interest.
6.1.1 Reagent water can be generated by passing tap water through a carbon filter
bed containing about 1 lb of activated carbon (Filtrasorb-300, Calgon Corp., or
equivalent).
6.1.2 A water purification system (Millipore Super-Q or equivalent) may be used to
generate reagent water.
6.1.3 Reagent water may also be prepared by boiling water for 15 minutes.
Subsequently, while maintaining the temperature at 90°C, bubble a
contaminant-free inert gas through the water for one hour. While still hot,
transfer the water to a narrow mouth screw-cap bottle and seal with a
Teflon-lined septum and cap.
6.2 Sodium thiosulfate—(ACS) Granular.
6.3 Trap materials
6.3.1 2,6-Diphenylene oxide polymer—Tenax, (60/80 mesh), chromatographic grade
or equivalent.
6.3.2 Methyl silicone packing—3% OV-1 on Chromosorb-W (60/80 mesh) or
equivalent.
6.3.3 Silica gel—35/60 mesh, Davison, Grade-15 or equivalent.
6.4 Methanol—Pesticide quality or equivalent.
6.5 Stock standard solutions—Stock standard solutions may be prepared from pure
standard materials or purchased as certified solutions. Prepare stock standard
solutions in methanol using assayed liquids or gases as appropriate. Because of the
toxicity of some of the compounds, primary dilutions of these materials should be
prepared in a hood. A NIOSH/MESA approved toxic gas respirator should be used
when the analyst handles high concentrations of such materials.
6.5.1 Place about 9.8 mL of methanol into a 10 mL ground glass stoppered
volumetric flask. Allow the flask to stand, unstoppered, for about 10 minutes
or until all alcohol wetted surfaces have dried. Weigh the flask to the nearest
0.1 mg.
6.5.2 Add the assayed reference material
6.5.2.1 Liquids—Using a 100 µL syringe, immediately add two or more drops
of assayed reference material to the flask, then reweigh. Be sure that
the drops fall directly into the alcohol without contacting the neck of
the flask.
6.5.2.2 Gases—To prepare standards for any of the four halocarbons that boil
below 30°C (bromomethane, chloroethane, chloromethane, and vinyl
chloride), fill a 5 mL valved gas-tight syringe with the reference
standard to the 5.0 mL mark. Lower the needle to 5 mm above the
methanol meniscus. Slowly introduce the reference standard above the
surface of the liquid (the heavy gas will rapidly dissolve in the
methanol).
6.5.3 Reweigh, dilute to volume, stopper, then mix by inverting the flask several
times. Calculate the concentration in µg/µL from the net gain in weight.
When compound purity is assayed to be 96% or greater, the weight may be
used without correction to calculate the concentration of the stock standard.
Commercially prepared stock standards may be used at any concentration if
they are certified by the manufacturer or by an independent source.
6.5.4 Transfer the stock standard solution into a Teflon-sealed screw-cap bottle.
Store, with minimal headspace, at -10 to -20°C and protect from light.
6.5.5 Prepare fresh standards weekly for the four gases and 2-chloroethylvinyl ether.
All other standards must be replaced after one month, or sooner if comparison
with check standards indicates a problem.
6.6 Secondary dilution standards—Using stock solutions, prepare secondary dilution
standards in methanol that contain the compounds of interest, either singly or mixed
together. The secondary dilution standards should be prepared at concentrations such
that the aqueous calibration standards prepared in Section 7.3 will bracket the
working range of the analytical system. Secondary dilution standards should be
stored with minimal headspace and should be checked frequently for signs of
degradation or evaporation, especially just prior to preparing calibration standards
from them.
6.7 Surrogate standard spiking solution—Select a minimum of three surrogate compounds
from Table 3. Prepare stock standard solutions for each surrogate standard in
methanol as described in Section 6.5. Prepare a surrogate standard spiking solution
from these stock standards at a concentration of 15 µg/mL in water. Store the
solutions at 4°C in Teflon-sealed glass containers with a minimum of headspace. The
solutions should be checked frequently for stability. The addition of 10 µL of this
solution of 5 mL of sample or standard is equivalent to a concentration of 30 µg/L of
each surrogate standard.
6.8 BFB Standard—Prepare a 25 µg/mL solution of BFB in methanol.
6.9 Quality control check sample concentrate—See Section 8.2.1.
7. Calibration
7.1 Assemble a purge and trap system that meets the specifications in Section 5.2.
Condition the trap overnight at 180°C by backflushing with an inert gas flow of at
least 20 mL/min. Condition the trap for 10 minutes once daily prior to use.
7.2 Connect the purge and trap system to a gas chromatograph. The gas chromatograph
must be operated using temperature and flow rate conditions equivalent to those
given in Table 1.
7.3 Internal standard calibration procedure—To use this approach, the analyst must select
three or more internal standards that are similar in analytical behavior to the
compounds of interest. The analyst must further demonstrate that the measurement
of the internal standard is not affected by method or matrix interferences. Some
recommended internal standards are listed in Table 3.
7.3.1 Prepare calibration standards at a minimum of three concentration levels for
each parameter by carefully adding 20.0 µL of one or more secondary dilution
standards to 50 mL, 250 mL, or 500 mL of reagent water. A 25 µmL syringe
with a 0.006 in. ID needle should be used for this operation. One of the
calibration standards should be at a concentration near, but above, the MDL
(Table 1) and the other concentrations should correspond to the expected range
of concentrations found in real samples or should define the working range of
the GC/MS system. These aqueous standards can be stored up to 24 hours, if
held in sealed vials with zero headspace as described in Section 9.2. If not so
stored, they must be discarded after one hour.
7.3.2 Prepare a spiking solution containing each of the internal standards using the
procedures described in Sections 6.5 and 6.6. It is recommended that the
secondary dilution standard be prepared at a concentration of 15 µg/mL of
each internal standard compound. The addition of 10 µL of this standard to
5.0 mL of sample or calibration standard would be equivalent to 30 µg/L.
7.3.3 Analyze each calibration standard according to Section 11, adding 10 µL of
internal standard spiking solution directly to the syringe (Section 11.4).
Tabulate the area response of the characteristic m/z against concentration for
each compound and internal standard, and calculate response factors (RF) for
each compound using Equation 1.
This equation corrects an error made in the original method publication (49 FR 43234,
October 26, 1984). This correction will be formalized through a rulemaking in FY97.
Equation 1
where:
A = Area of the characteristic m/z for the parameter to be measured.
s
A = Area of the characteristic m/z for the internal standard.
is
C = Concentration of the internal standard.
is
C = Concentration of the parameter to be measured.
s
If the RF value over the working range is a constant (<35% RSD), the RF can
be assumed to be invariant and the average RF can be used for calculations.
Alternatively, the results can be used to plot a calibration curve of response
ratios, A /A , vs. concentration ratios C /C .
sis sis
*
7.4 The working calibration curve or RF must be verified on each working day by the
measurement of a QC check sample.
7.4.1 Prepare the QC check sample as described in Section 8.2.2.
7.4.2 Analyze the QC check sample according to the method beginning in
Section 10.
7.4.3 For each parameter, compare the response (Q) with the corresponding
calibration acceptance criteria found in Table 5. If the responses for all
parameters of interest fall within the designated ranges, analysis of actual
samples can begin. If any individual Q falls outside the range, proceed
according to Section 7.4.4.
NOTE: The large number of parameters in Table 5 present a substantial
probability that one or more will not meet the calibration
acceptance criteria when all parameters are analyzed.
7.4.4 Repeat the test only for those parameters that failed to meet the calibration
acceptance criteria. If the response for a parameter does not fall within the
range in this second test, a new calibration curve or RF must be prepared for
that parameter according to Section 7.3.
8. Quality Control
8.1 Each laboratory that uses this method is required to operate a formal quality control
program. The minimum requirements of this program consist of an initial
demonstration of laboratory capability and an ongoing analysis of spiked samples to
evaluate and document data quality. The laboratory must maintain records to
document the quality of data that is generated. Ongoing data quality checks are
compared with established performance criteria to determine if the results of analyses
meet the performance characteristics of the method. When results of sample spikes
indicate atypical method performance, a quality control check standard must be
analyzed to confirm that the measurements were performed in an in-control mode of
operation.
8.1.1 The analyst must make an initial, one-time, demonstration of the ability to
generate acceptable accuracy and precision with this method. This ability is
established as described in Section 8.2.
8.1.2 In recognition of advances that are occurring in chromatography, the analyst is
permitted certain options (detailed in Section 11.1) to improve the separations
or lower the cost of measurements. Each time such a modification is made to
the method, the analyst is required to repeat the procedure in Section 8.2.
8.1.3 Each day, the analyst must analyze a reagent water blank to demonstrate that
interferences from the analytical system are under control.
8.1.4 The laboratory must, on an ongoing basis, spike and analyze a minimum of
5% of all samples to monitor and evaluate laboratory data quality. This
procedure is described in Section 8.3.
8.1.5 The laboratory must, on an ongoing basis, demonstrate through the analyses of
quality control check standards that the operation of the measurement system
is in control. This procedure is described in Section 8.4. The frequency of the
check standard analyses is equivalent to 5% of all samples analyzed but may
be reduced if spike recoveries from samples (Section 8.3) meet all specified
quality control criteria.
8.1.6 The laboratory must spike all samples with surrogate standards to monitor
continuing laboratory performance. This procedure is described in Section 8.5.
8.1.7 The laboratory must maintain performance records to document the quality of
data that is generated. This procedure is described in Section 8.6.
8.2 To establish the ability to generate acceptable accuracy and precision, the analyst must
perform the following operations.
8.2.1 A quality control (QC) check sample concentrate is required containing each
parameter of interest at a concentration of 10 µg/mL in methanol. The QC
check sample concentrate must be obtained from the U.S. Environmental
Protection Agency, Environmental Monitoring and Support Laboratory in
Cincinnati, Ohio, if available. If not available from that source, the QC check
sample concentrate must be obtained from another external source. If not
available from either source above, the QC check sample concentrate must be
prepared by the laboratory using stock standards prepared independently from
those used for calibration.
8.2.2 Prepare a QC check sample to contain 20 µg/L of each parameter by adding
200 µL of QC check sample concentrate to 100 mL of reagent water.
8.2.3 Analyze four 5 mL aliquots of the well-mixed QC check sample according to
the method beginning in Section 10.
8.2.4 Calculate the average recovery ( ) in µg/L, and the standard deviation of
the recovery (s) in µg/L, for each parameter of interest using the four results.
8.2.5 For each parameter compare s and with the corresponding acceptance
criteria for precision and accuracy, respectively, found in Table 5. If s and
for all parameters of interest meet the acceptance criteria, the system
performance is acceptable and analysis of actual samples can begin. If any
individual s exceeds the precision limit or any individual falls outside the
range for accuracy, the system performance is unacceptable for that parameter.
NOTE: The large number of parameters in Table 5 present a substantial
probability that one or more will fail at least one of the
acceptance criteria when all parameters are analyzed.
8.2.6 When one or more of the parameters tested fail at least one of the acceptance
criteria, the analyst must proceed according to Section 8.2.6.1 or 8.2.6.2.
8.2.6.1 Locate and correct the source of the problem and repeat the test for all
parameters of interest beginning with Section 8.2.3.
8.2.6.2 Beginning with Section 8.2.3, repeat the test only for those parameters
that failed to meet criteria. Repeated failure, however, will confirm a
general problem with the measurement system. If this occurs, locate
and correct the source of the problem and repeat the test for all
compounds of interest beginning with Section 8.2.3.
8.3 The laboratory must, on an ongoing basis, spike at least 5% of the samples from each
sample site being monitored to assess accuracy. For laboratories analyzing one to 20
samples per month, at least one spiked sample per month is required.
8.3.1 The concentration of the spike in the sample should be determined as follows:
8.3.1.1 If, as in compliance monitoring, the concentration of a specific
parameter in the sample is being checked against a regulatory
concentration limit, the spike should be at that limit or one to five times
higher than the background concentration determined in Section 8.3.2,
whichever concentration would be larger.
8.3.1.2 If the concentration of a specific parameter in the sample is not being
checked against a limit specific to that parameter, the spike should be
at 20 µg/L or one to five times higher than the background
concentration determined in Section 8.3.2, whichever concentration
would be larger.
8.3.2 Analyze one 5 mL sample aliquot to determine the background concentration
(B) of each parameter. If necessary, prepare a new QC check sample
concentrate (Section 8.2.1) appropriate for the background concentrations in the
sample. Spike a second 5 mL sample aliquot with 10 µL of the QC check
sample concentrate and analyze it to determine the concentration after spiking
(A) of each parameter. Calculate each percent recovery (P) as 100 (A-B)%/T,
where T is the known true value of the spike.
8.3.3 Compare the percent recovery (P) for each parameter with the corresponding
QC acceptance criteria found in Table 5. These acceptance criteria were
calculated to include an allowance for error in measurement of both the
background and spike concentrations, assuming a spike to background ratio of
5:1. This error will be accounted for to the extent that the analyst's spike to
background ratio approaches 5:1. If spiking was performed at a concentration
7
lower than 20 µg/L, the analyst must use either the QC acceptance criteria in
Table 5, or optional QC acceptance criteria calculated for the specific spike
concentration. To calculate optional acceptance criteria for the recovery of a
parameter: (1) Calculate accuracy (X′) using the equation in Table 6,
substituting the spike concentration (T) for C; (2) calculate overall precision (S′)
using the equation in Table 6, substituting X′ for ; (3) calculate the range for
recovery at the spike concentration as (100 X′/T) ±2.44 (100 S′/T)%.
7
8.3.4 If any individual P falls outside the designated range for recovery, that
parameter has failed the acceptance criteria. A check standard containing each
parameter that failed the criteria must be analyzed as described in Section 8.4.
8.4 If any parameter fails the acceptance criteria for recovery in Section 8.3, a QC check
standard containing each parameter that failed must be prepared and analyzed.
NOTE: The frequency for the required analysis of a QC check standard will
depend upon the number of parameters being simultaneously tested,
the complexity of the sample matrix, and the performance of the
laboratory. If the entire list of parameters in Table 5 must be measured
in the sample in Section 8.3, the probability that the analysis of a QC
check standard will be required is high. In this case the QC check
standard should be routinely analyzed with the spiked sample.
8.4.1 Prepare the QC check standard by adding 10 µL of QC check sample
concentrate (Section 8.2.1 or 8.3.2) to 5 mL of reagent water. The QC check
standard needs only to contain the parameters that failed criteria in the test in
Section 8.3.
8.4.2 Analyze the QC check standard to determine the concentration measured (A)
of each parameter. Calculate each percent recovery (P ) as 100 (A/T)%, where
S
T is the true value of the standard concentration.
8.4.3 Compare the percent recovery (P ) for each parameter with the corresponding
S
QC acceptance criteria found in Table 5. Only parameters that failed the test
in Section 8.3 need to be compared with these criteria. If the recovery of any
such parameter falls outside the designated range, the laboratory performance
for that parameter is judged to be out of control, and the problem must be
immediately identified and corrected. The analytical result for that parameter
in the unspiked sample is suspect and may not be reported for regulatory
compliance purposes.
8.5 As a quality control check, the laboratory must spike all samples with the surrogate
standard spiking solutions as described in Section 11.4, and calculate the percent
recovery of each surrogate compound.
8.6 As part of the QC program for the laboratory, method accuracy for wastewater
samples must be assessed and records must be maintained. After the analysis of five
spiked wastewater samples as in Section 8.3, calculate the average percent recovery
( ) and the standard deviation of the percent recovery (s ). Express the accuracy
p
assessment as a percent recovery interval from -2s to +2s . If =90% and s =10%,
pp p
for example, the accuracy interval is expressed as 70-110%. Update the accuracy
assessment for each parameter a regular basis (e.g., after each 5-10 new accuracy
measurements).
8.7 It is recommended that the laboratory adopt additional quality assurance practices for
use with this method. The specific practices that are most productive depend upon
the needs of the laboratory and the nature of the samples. Field duplicates may be
analyzed to assess the precision of the environmental measurements. Whenever
possible, the laboratory should analyze standard reference materials and participate in
relevant performance evaluation studies.
9. Sample Collection, Preservation, and Handling
9.1 All samples must be iced or refrigerated from the time of collection until analysis. If
the sample contains residual chlorine, add sodium thiosulfate preservative
(10 mg/40 mL is sufficient for up to 5 ppm Cl ) to the empty sample bottle just prior
2
to shipping to the sampling site. EPA Methods 330.4 and 330.5 may be used for
measurement of residual chlorine. Field test kits are available for this purpose.
8
9.2 Grab samples must be collected in glass containers having a total volume of at least
25 mL. Fill the sample bottle just to overflowing in such a manner that no air bubbles
pass through the sample as the bottle is being filled. Seal the bottle so that no air
bubbles are entrapped in it. If preservative has been added, shake vigorously for
one minute. Maintain the hermetic seal on the sample bottle until time of analysis.
9.3 Experimental evidence indicates that some aromatic compounds, notably benzene,
toluene, and ethyl benzene are susceptible to rapid biological degradation under
certain environmental conditions. Refrigeration alone may not be adequate to
3
preserve these compounds in wastewaters for more than seven days. For this reason,
a separate sample should be collected, acidified, and analyzed when these aromatics
are to be determined. Collect about 500 mL of sample in a clean container. Adjust
the pH of the sample to about 2 by adding 1+1 HCl while stirring vigorously. Check
pH with narrow range (1.4-2.8) pH paper. Fill a sample container as described in
Section 9.2.
9.4 All samples must be analyzed within 14 days of collection.
3
10. Daily GC/MS Performance Tests
10.1 At the beginning of each day that analyses are to be performed, the GC/MS system
must be checked to see if acceptable performance criteria are achieved for BFB. The
9
performance test must be passed before any samples, blanks, or standards are
analyzed, unless the instrument has met the DFTPP test described in Method 625
earlier in the day.
10
10.2 These performance tests require the following instrumental parameters:
Electron Energy: 70 V (nominal)
Mass Range: 20-260 amu
Scan Time: To give at least five scans per peak but not to exceed seven
seconds per scan.
10.3 At the beginning of each day, inject 2 µL of BFB solution directly on the column.
Alternatively, add 2 µL of BFB solution to 5.0 mL of reagent water or standard
solution and analyze the solution according to Section 11. Obtain a
background-corrected mass spectrum of BFB and confirm that all the key m/z criteria
in Table 2 are achieved. If all the criteria are not achieved, the analyst must retune
the mass spectrometer and repeat the test until all criteria are achieved.
11. Sample Purging and Gas Chromatography
11.1 Table 1 summarizes the recommended operating conditions for the gas
chromatograph. Included in this table are retention times and MDL that can be
achieved under these conditions. An example of the separations achieved by this
column is shown in Figure 5. Other packed columns or chromatographic conditions
may be used if the requirements of Section 8.2 are met.
11.2 After achieving the key m/z abundance criteria in Section 10, calibrate the system
daily as described in Section 7.
11.3 Adjust the purge gas (helium) flow rate to 40 mL/min. Attach the trap inlet to the
purging device, and set the purge and trap system to purge (Figure 3). Open the
syringe valve located on the purging device sample introduction needle.
11.4 Allow the sample to come to ambient temperature prior to introducing it into the
syringe. Remove the plunger from a 5 mL syringe and attach a closed syringe valve.
Open the sample bottle (or standard) and carefully pour the sample into the syringe
barrel to just short of overflowing. Replace the syringe plunger and compress the
sample. Open the syringe valve and vent any residual air while adjusting the sample
volume to 5.0 mL. Since this process of taking an aliquot destroys the validity of the
sample for future analysis, the analyst should fill a second syringe at this time to
protect against possible loss of data. Add 10.0 µL of the surrogate spiking solution
(Section 6.7) and 10.0 µL of the internal standard spiking solution (Section 7.3.2)
through the valve bore, then close the valve. The surrogate and internal standards
may be mixed and added as a single spiking solution.
11.5 Attach the syringe-syringe valve assembly to the syringe valve on the purging device.
Open the syringe valves and inject the sample into the purging chamber.
11.6 Close both valves and purge the sample for 11.0 ±0.1 minute at ambient temperature.
11.7 After the 11-minute purge time, attach the trap to the chromatograph, adjust the
purge and trap system to the desorb mode (Figure 4), and begin to temperature
program the gas chromatograph. Introduce the trapped materials to the GC column
by rapidly heating the trap to 180°C while backflushing the trap with an inert gas
between 20 and 60 mL/min. for four minutes. If rapid heating of the trap cannot be
achieved, the GC column must be used as a secondary trap by cooling it to 30°C
(subambient temperature, if problems persist) instead of the initial program
temperature of 45°C.
11.8 While the trap is being desorbed into the gas chromatograph, empty the purging
chamber using the sample introduction syringe. Wash the chamber with two 5 mL
flushes of reagent water.
11.9 After desorbing the sample for four minutes, recondition the trap by returning the
purge and trap system to the purge mode. Wait 15 seconds then close the syringe
valve on the purging device to begin gas flow through the trap. The trap temperature
should be maintained at 180°C. After approximately seven minutes, turn off the trap
heater and open the syringe valve to stop the gas flow through the trap. When the
trap is cool, the next sample can be analyzed.
11.10 If the response for any m/z exceeds the working range of the system, prepare a
dilution of the sample with reagent water from the aliquot in the second syringe and
reanalyze.
12. Qualitative Identification
12.1 Obtain EICPs for the primary m/z (Table 4) and at least two secondary masses for
each parameter of interest. The following criteria must be met to make a qualitative
identification:
12.1.1 The characteristic masses of each parameter of interest must maximize in the
same or within one scan of each other.
12.1.2 The retention time must fall within ±30 seconds of the retention time of the
authentic compound.
12.1.3 The relative peak heights of the three characteristic masses in the EICPs must
fall within ±20% of the relative intensities of these masses in a reference mass
spectrum. The reference mass spectrum can be obtained from a standard
analyzed in the GC/MS system or from a reference library.
12.2 Structural isomers that have very similar mass spectra and less than 30 seconds
difference in retention time, can be explicitly identified only if the resolution between
authentic isomers in a standard mix is acceptable. Acceptable resolution is achieved if
the baseline to valley height between the isomers is less than 25% of the sum of the
two peak heights. Otherwise, structural isomers are identified as isomeric pairs.
13. Calculations
13.1 When a parameter has been identified, the quantitation of that parameter should be
based on the integrated abundance from the EICP of the primary characteristic m/z
given in Table 4. If the sample produces an interference for the primary m/z, use a
secondary characteristic m/z to quantitate.
Calculate the concentration in the sample using the response factor (RF) determined in
Section 7.3.3 and Equation 2.
Equation 2
where:
A = Area of the characteristic m/z for the parameter or surrogate standard to
S
be measured.
A = Area of the characteristic m/z for the internal standard.
is
C = Concentration of the internal standard.
is
13.2 Report results in µg/L without correction for recovery data. All QC data obtained
should be reported with the sample results.
14. Method Performance
14.1 The method detection limit (MDL) is defined as the minimum concentration of a
substance that can be measured and reported with 99% confidence that the value is
above zero. The MDL concentrations listed in Table 1 were obtained using reagent
1
water. Similar results were achieved using representative wastewaters. The MDL
11
actually achieved in a given analysis will vary depending on instrument sensitivity
and matrix effects.
14.2 This method was tested by 15 laboratories using reagent water, drinking water,
surface water, and industrial wastewaters spiked at six concentrations over the range
5-600 µg/L. Single operator precision, overall precision, and method accuracy were
12
found to be directly related to the concentration of the parameter and essentially
independent of the sample matrix. Linear equations to describe these relationships
are presented in Table 5.
References
1. 40 CFR Part 136, Appendix B.
2. Bellar, T.A. and Lichtenberg, J.J. “Determining Volatile Organics at
Microgram-per-Litre Levels by Gas Chromatography,” Journal American Water Works
Association, 66, 739 (1974).
3. Bellar, T.A. and Lichtenberg, J.J. “Semi-Automated Headspace Analysis of Drinking
Waters and Industrial Waters for Purgeable Volatile Organic Compounds,”
Measurement of Organic Pollutants in Water and Wastewater, C.E. Van Hall, editor,
American Society for Testing and Materials, Philadelphia, PA. Special Technical
Publication 686, 1978.
4. “Carcinogens-Working With Carcinogens,” Department of Health, Education, and
Welfare, Public Health Service, Center for Disease Control, National Institute for
Occupational Safety and Health, Publication No. 77-206, August 1977.
5. “OSHA Safety and Health Standards, General Industry,” (29 CFR Part 1910),
Occupational Safety and Health Administration, OSHA 2206 (Revised, January 1976).
6. “Safety in Academic Chemistry Laboratories,” American Chemical Society Publication,
Committee on Chemical Safety, 3rd Edition, 1979.
7. Provost, L.P. and Elder, R.S. “Interpretation of Percent Recovery Data,” American
Laboratory, 15, 58-63 (1983). (The value 2.44 used in the equation in Section 8.2.3 is
two times the value 1.22 derived in this report.)
8. “Methods 330.4 (Titrimetric, DPD-FAS) and 330.5 (Spectrophotometric, DPD) for
Chlorine, Total Residual,” Methods for Chemical Analysis of Water and Wastes,
EPA-600/4-79-020, U.S. Environmental Protection Agency, Environmental Monitoring
and Support Laboratory, Cincinnati, Ohio 45268, March 1979.
9. Budde, W.L. and Eichelberger, J.W. “Performance Tests for the Evaluation of
Computerized Eas Chromatography/Mass Spectrometry Equipment and
Laboratories,” EPA-600/4-80-025, U.S. Environmental Protection Agency,
Environmental Monitoring and Support Laboratory, Cincinnati, Ohio 45268,
April 1980.
10. Eichelberger, J.W., Harris, L.E., and Budde, W.L. “Reference Compound to Calibrate
Ion Abundance Measurement in Gas Chromatography-Mass Spectrometry Systems,”
Analytical Chemistry, 47, 995-1000 (1975).
11. “Method Detection Limit for Methods 624 and 625,” Olynyk, P., Budde, W.L., and
Eichelberger, J.W. Unpublished report, May 14, 1980.
12. “EPA Method Study 29 EPA Method 624-Purgeables,” EPA 600/4-84-054, National
Technical Information Service, PB84-209915, Springfield, Virginia 22161, June 1984.
13. “Method Performance Data for Method 624,” Memorandum from R. Slater and
T. Pressley, U.S. Environmental Protection Agency, Environmental Monitoring and
Support Laboratory, Cincinnati, Ohio 45268, January 17, 1984.
Table 1—Chromatographic Conditions and Method Detection Limits
Parameter detection
Retention
time (min.)
Method
limit(µ/L)
Chloromethane 2.3 nd
Bromomethane 3.1 nd
Vinyl chloride 3.8 nd
Chloroethane 4.6 nd
Methylene chloride 6.4 2.8
Trichlorofluoromethane 8.3 nd
1,1-Dichloroethene 9.0 2.8
1,1-Dichloroethane 10.1 4.7
trans-1,2-Dichloroethene 10.8 1.6
Chloroform 11.4 1.6
1,2-Dichloroethane 12.1 2.8
1,1,1-Trichloroethane 13.4 3.8
Carbon tetrachloride 13.7 2.8
Bromodichloromethane 14.3 2.2
1,2-Dichloroproane 15.7 6.0
cis-1,3-Dichloropropene 15.9 5.0
Trichloroethene 16.5 1.9
Benzene 17.0 4.4
Dibromochloromethane 17.1 3.1
1,1,2-Trichloroethane 17.2 5.0
trans-1,3-Dichloropropene 17.2 nd
2-Chloroethylvinlyl ether 18.6 nd
Bromoform 19.8 4.7
1,1,2,2-Tetrachloroethane 22.1 6.9
Tetrachloroethene 22.2 4.1
Toluene 23.5 6.0
Chlorobenzene 24.6 6.0
Ethyl benzene 26.4 7.2
1,3-Dichlorobenzene 33.9 nd
1,2-Dichlorobenzene 35.0 nd
1,4-Dichlorobenzene 35.4 nd
Column conditions: Carbopak B (60/80 mesh) coated with 1% SP-1000 packed in a 6 ft by
0.1 in. ID glass column with helium carrier gas at 30 mL/min. flow rate. Column
temperature held at 45°C for three minutes, then programmed at 8°C/min. to 220°C and
held for 15 minutes.
nd = Not determined.
Table 2—BFB Key m/z Abundance Criteria
Mass m/z Abundance criteria
50 15-40% of Mass 95.
75 30-60% of Mass 95.
95 Base Peak, 100% Relative Abundance.
96 5-9% of Mass 95.
173 <2% of Mass 174.
174 >50% of Mass 95.
175 5-9% of Mass 174.
176 >95% but 101% of Mass 174.
177 5-9% of Mass 176.
Table 3—Suggested Surrogate and Internal Standards
Compound Secondary masses
Retention Primary
time (min) m/z
a
Benzene d-6 17.0 84 . . . . . . . . . . . . . . .
4-Bromofluorobenzene 28.3 95 174, 176
1,2-Dichloroethane d-4 12.1 102 . . . . . . . . . . . . . . .
1,4-Difluorobenzene 19.6 114 63, 88
Ethylbenzene d-5 26.4 111 . . . . . . . . . . . . . . .
Ethylbenzene d-10 26.4 98 . . . . . . . . . . . . . . .
Fluorobenzene 18.4 96 70
Pentafluorobenzene 23.5 168 . . . . . . . . . . . . . . .
Bromochloromethane 9.3 128 49, 130, 51
2-Bromo-1-chloropropane 19.2 77 79, 156
1,4-Dichlorobutane 25.8 55 90, 92
For chromatographic conditions, see Table 1.
a
Table 4—Characteristic Masses for Purgeable Organics
Parameter Primary Secondary
Chloromethane 5052.
Bromomethane 9496.
Vinyl chloride 6264.
Chloroethane 6466.
Methylene chloride 8449, 51, and 86.
Trichlorofluoromethane 101103.
1,1-Dichloroethene 9661 and 98.
1,1-Dichloroethane 6365, 83, 85, 98, and 100.
trans-1,2-Dichloroethene 9661 and 98.
Chloroform 8385.
1,2-Dichloroethane 9862, 64, and 100.
1,1,1-Trichloroethane 9799, 117, and 119.
Carbon tetrachloride 117119 and 121.
Bromodichloromethane 12783, 85, and 129.
1,2-Dichloropropane 11263, 65, and 114.
trans-1,3-Dichloropropene 7577.
Trichloroethene 13095, 97, and 132.
Benzene 78. . . . . . . . . . . . . . .
Dibromochloromethane 127129, 208, and 206.
1,1,2-Trichloroethane 9783, 85, 99, 132, and
134.
cis-1,3-Dichloropropene 7577.
2-Chloroethylvinyl ether 10663 and 65.
Bromoform 173171, 175, 250, 252, 254,
and 256.
1,1,2,2-Tetrachloroethane 16883, 85, 131, 133, and
166.
Tetrachloroethene 164129, 131, and 166.
Toluene 9291.
Chlorobenzene 112114.
Ethyl benzene 10691.
1,3-Dichlorobenzene 146148 and 113.
1,2-Dichlorobenzene 146148 and 113.
1,4-Dichlorobenzene 146148 and 113.
Table 5—Calibration and QC Acceptance Criteria-Method 624
a
Parameter
Range for Limit for Range for Range for P,
Q (µ/g/L) s (µ/g/L) (µ/g/L) P (%)
s
Benzene 12.8 - 27.2 6.9 15.2 - 26.0 37 - 151
Bromodichloromethane 13.1 - 26.9 6.4 10.1 - 28.0 35 - 155
Bromoform 14.2 - 25.8 5.4 11.4 - 31.1 45 - 169
Bromomethane 2.8 - 37.2 17.9 D - 41.2 D - 242
Carbon tetrachloride 14.6 - 25.4 5.2 17.2 - 23.5 70 - 140
Chlorobenzene 13.2 - 26.8 6.3 16.4 - 27.4 37 - 160
Chloroethane 7.6 - 32.4 11.4 8.4 - 40.4 14 - 230
2-Chloroethylvinyl ether D - 44.8 25.9 D - 50.4 D - 305
Chloroform 13.5 - 26.5 6.1 13.7 - 24.2 51 - 138
Chloromethane D - 40.8 19.8 D - 45.9 D - 273
Dibromochloromethane 13.5 - 26.5 6.1 13.8 - 26.6 53 - 149
1,2-Dichlorobenzene 12.6 - 27.4 7.1 11.8 - 34.7 18 - 190
1,3-Dichlorobenzene 14.6 - 25.4 5.5 17.0 - 28.8 59 - 156
1,4-Dichlorobenzene 12.6 - 27.4 7.1 11.8 - 34.7 18 - 190
1,1-Dichloroethane 14.5 - 25.5 5.1 14.2 - 28.5 59 - 155
1,2-Dichloroethane 13.6 - 26.4 6.0 14.3 - 27.4 49 - 155
1,1-Dichlorothene 10.1 - 29.9 9.1 3.7 - 42.3 D - 234
trans-1,2-Dichloroethene 13.9 - 26.1 5.7 13.6 - 28.5 54 - 156
1,2-Dichloropropane 6.8 - 33.2 13.8 3.8 - 36.2 D - 210
cis-1,3-Dichloropropene 4.8 - 35.2 15.8 1.0 - 39.0 D - 227
trans-1,3-Dichloropropene 10.0 - 30.0 10.4 7.6 - 32.4 17 - 183
Ethyl benzene 11.8 - 28.2 7.5 17.4 - 26.7 37 - 162
Methylene chloride 12.1 - 27.9 7.4 D - 41.0 D - 221
1,1,2,2-Tetrachloroethane 12.1 - 27.9 7.4 13.5 - 27.2 46 - 157
Tetrachloroethene 14.7 - 25.3 5.0 17.0 - 26.6 64 - 148
Toluene 14.9 - 25.1 4.8 16.6 - 26.7 47 - 150
1,1,1-Trichloroethane 15.0 - 25.0 4.6 13.7 - 30.1 52 - 162
1,1,2-Trichloroethane 14.2 - 25.8 5.5 14.3 - 27.1 52 - 150
Trichloroethene 13.3 - 26.7 6.6 18.6 - 27.6 71 - 157
Trichlorofluoromethane 9.6 - 30.4 10.0 8.9 - 31.5 17 - 181
Vinyl chloride 0.8 - 39.2 20.0 D - 43.5 D - 251
Q = Concentration measured in QC check sample, in µg/L (Section 7.5.3).
s = Standard deviation of four recovery measurements, in µg/L (Section 8.2.4).
= Average recovery of four recovery measurements, in µg/L (Section 8.2.4).
P, P = Percent recovery measured, (Section 8.3.2, Section 8.4.2).
s
D = Detected; result must be greater than zero.
Criteria were calculated assuming a QC check sample concentration of 20 µg/L.
a
NOTE: These criteria are based directly upon the method performance data in Table 6.
Where necessary, the limits for recovery have been broadened to assure
applicability of the limits to concentrations below those used to develop
Table 6.
Table 6—Method Accuracy and Precision as Functions of Concentration—Method 624
Parameter recovery, precision, precision,
Accuracy, as Single analyst Overall
X' (µ/g/L) s ' (µ/g/L) S' (µ/g/L)
r
Benzene 0.93C+2.00 0.26 -1.74 0.25 -1.33
Bromodichloromethane 1.03C-1.58 0.15 +0.59 0.20 +1.13
Bromoform 1.18C-2.35 0.12 +0.36 0.17 +1.38
Bromomethane
a
1.00C 0.43 0.58
Carbon tetrachloride 1.10C-1.68 0.12 +0.25 0.11 +0.37
Chlorobenzene 0.98C+2.28 0.16 -0.09 0.26 -1.92
Chloroethane 1.18C+0.81 0.14 +2.78 0.29 +1.75
2-Chloroethylvinyl ether
a
1.00C 0.62 0.84
Chloroform 0.93C+0.33 0.16 +0.22 0.18 +0.16
Chloromethane 1.03C+0.81 0.37 +2.14 0.58 +0.43
Dibromochloromethane 1.01C-0.03 0.17 -0.18 0.17 +0.49
1,2-Dichlorobenzene
b
0.94C+4.47 0.22 -1.45 0.30 -1.20
1,3-Dichlorobenzene 1.06C+1.68 0.14 -0.48 0.18 -0.82
1,4-Dichlorobenzene
b
0.94C+4.47 0.22 -1.45 0.30 -1.20
1,1-Dichloroethane 1.05C+0.36 0.13 -0.05 0.16 +0.47
1,2-Dichloroethane 1.02C+0.45 0.17 -0.32 0.21 -0.38
1,1-Dichloroethene 1.12C+0.61 0.17 +1.06 0.43 -0.22
trans-1,2,-Dichloroethene 1.05C+0.03 0.14 +0.09 0.19 +0.17
1,2-Dichloropropane
a
1.00C 0.33 0.45
cis-1,3-Dichloropropene
a
1.00C 0.38 0.52
trans-1,3-Dichloropropene
a
1.00C 0.25 0.34
Ethyl benzene 0.98C+2.48 0.14 +1.00 0.26 -1.72
Methylene chloride 0.87C+1.88 0.15 +1.07 0.32 +4.00
1,1,2,2-Tetrachloroethane 0.93C+1.76 0.16 +0.69 0.20 +0.41
Tetrachloroethene 1.06C+0.60 0.13 -0.18 0.16 -0.45
Toluene 0.98C+2.03 0.15 -0.71 0.22 -1.71
1,1,1-Trichloroethane 1.06C+0.73 0.12 -0.15 0.21 -0.39
1,1,2-Trichloroethane 0.95C+1.71 0.14 +0.02 0.18 +0.00
Trichloroethene 1.04C+2.27 0.13 +0.36 0.12 +0.59
Trichloroflouromethane 0.99C+0.39 0.33 -1.48 0.34 -0.39
Vinyl chloride 1.00C 0.48 0.65
X' = Expected recovery for one or more measurements of a sample containing a
concentration of C, in µg/L.
S = Expected single analyst standard deviation of measurements at an average concentration
r
found of , in µg/L.
S' = Expected interlaboratory standard deviation of measurements at an average
concentration found of , in µg/L.
C = True value for the concentration, in µg/L.
= Average recovery found for measurements of samples containing a concentration of C,
in µg/L.
Estimates based upon the performance in a single laboratory.
a 13
Due to chromatographic resolution problems, performance statements for these isomers are
b
based upon the sums of their concentrations.