Nitrogen doped ZnOfilm grown by the plasma-assisted metal-organic chemical vapor deposition pot
Bạn đang xem bản rút gọn của tài liệu. Xem và tải ngay bản đầy đủ của tài liệu tại đây (150.03 KB, 7 trang )
Journal of Crystal Growth 226 (2001) 123–129
Nitrogen doped ZnO film grown by the plasma-assisted
metal-organic chemical vapor deposition
Xinqiang Wang
a,
*, Shuren Yang
a
, Jinzhong Wang
a
, Mingtao Li
a
,
Xiuying Jiang
a
, Guotong Du
a
, Xiang Liu
b
, R.P.H. Chang
b
a
Department of Electronic Engineering, State Key Lab on Integrated Optoelectronics, Jilin University, Changchun 130023,
People’s Republic of China
b
Materials Research Center, Northwestern University, Evanston, Il, USA
Received 28 December 2000; accepted 5 March 2001
Communicated by M. Schieber
Abstract
Nitrogen doped and non-doped ZnO films are grown by the plasma-assisted metal-organic chemical vapor deposition
(MOCVD) on sapphire. X-ray diffraction spectra show that they are both strongly c-oriented while the N-doped sample
is of better crystal quality. A strong emission coming from A-exciton is observed at 10 and 77 K photoluminescence
(PL) spectra in both samples while deep level transition is hardly observed. More emission peaks are found in the PL
spectrum of the N-doped sample relative to that of a non-doped one. Raman scattering is also performed in back
scattering configuration. E
2
mode is observed in both samples while A
1(LO)
mode can only be found in the N-doped
sample, which indicates that high quality of the N-doped ZnO film. A high resistive ZnO film is obtained by nitrogen
doping. # 2001 Published by Elsevier Science B.V.
Keywords: A1. Doping; A3. Metalorganic chemical vapor deposition; B2. Semiconducting materials
1. Introduction
ZnO, a wide gap semiconductor with band-gap
of 3.36 eV at room temperature, is attracting more
attention because of its good optical, electrical and
piezo-electrical properties. It has potential uses in
optoelectronical systems such as light emitting
diodes (LEDs) [1], photodetectors [2], electrolumi-
nescence devices and solar cells. Recently, opti-
cally pumped ultraviolet (UV) lasing of ZnO film
by molecular beam epitaxy (MBE) and pulsed
laser deposition has been reported by several
authors [3–5]. GaN is known as a good material
for the fabrication of optical devices such as LEDs
and laser diodes (LDs). ZnO has not only the same
crystal structure as GaN, but also a larger exciton
binding energy of 60 meV, which is 2.4 times that
of GaN. Furthermore, Yu et al. have shown that
textured ZnO films might have higher quantum
efficiency than GaN [6]. This indicates that ZnO
should be the most potential material to realize the
next generation UV semiconductor laser. ZnO is
also a promising material for surface acoustic
wave (SAW) devices, which is very important in
this information age. However, high resistive or
*Corresponding author. Tel. +86-431-8922331.
E-mail address: (X. Wang).
0022-0248/01/$ - see front matter # 2001 Published by Elsevier Science B.V.
PII: S 0022-0248(01)01367-7
p-type ZnO film is needed to realize the devices
mentioned above. Nitrogen doping, which has
been successful in fabricating p-type ZnSe [7], is
considered as an effective method to realize high
resistive or p-type ZnO film. In this paper, a non-
doped ZnO film and a nitrogen doped one are
deposited by plasma-assisted metal-organic che-
mical vapor deposition (MOCVD). We have
investigated their structural and optical qualities
and found that the nitrogen doped (N-doped) ZnO
film shows better crystal quality and higher
resistivity relative to the non-doped one.
2. Experiment
ZnO film was grown by MOCVD on (0 0 0 6)
sapphire substrate. Di-ethyl zinc (DEZn) and O
2
were used as sources. High purity Ar was passed
through the DEZn bubbler and saturated with
DEZn vapor to the reactor. N
2
was used as the
carrier gas. The substrate was cleaned in acetone,
methanol, deionized water, and then chemical
etched in H
2
SO
4
:H
3
PO
4
=3 : 1 for 10 min at
1608C followed by deionized water rinse. The
reaction temperature was 6008C and the power of
the plasma source was 900 W. The growth rate was
1 mm/h. The non-doped sample (sample A) was
grown with O
2
flow of 10 SCCM while the
N-doped one (sample B) was deposited with the
flow ratio of O
2
:N
2
=1 : 1. The N-doped sample
looked slight red while the non-doped one was
transparent.
We used SIEMENS D 5005 X-ray diffract-
ometer and Rigaku DMAX 2400 X-ray diffraction
(XRD) to investigate crystal quality. The absorp-
tion measurement was performed by UV-3100
SHIMADZU UV-VIS-NIR Recording spectro-
photometer with Xe lamp as optical source.
Raman measurement was taken by RE-
NISHAW-Ramascope at room temperature in
back-scattering configuration by using 514.5 nm
Ar
+
laser line excitation with an arriving power of
about 70 mW. The scattered light was detected by
a water-cooled charge coupled device (CCD)
detector. The diameter of the laser beam was
about 1 mm. PL spectrum was measured by a
325 nm He–Cd laser. The PL signal from the
sample was filtered by a monochromator and
picked up by a CCD detector. The power arriving
at the sample was about 3 mW with a beam
diameter of 200 mm. For low temperature mea-
surement, the sample was mounted on a closed-
cycle refrigerator.
3. Results and discussion
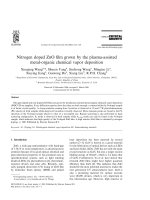
XRD y22y scan spectra of N-doped (sample B)
and non-doped ZnO film (sample A) are shown in
Fig. 1(a) and (b), respectively. In both the two
spectra, we find a dominant peak at around 2y of
Fig. 1. X-ray diffraction spectra of ZnO film. The o-rocking curve is shown in the inset. (a) Non-doped ZnO film; (b) N-doped
ZnO film.
X. Wang et al. / Journal of Crystal Growth 226 (2001) 123–129124
34.68 due to (0 0 0 2) ZnO. This shows that the
films are both strongly c-oriented. The full-width
at half-maximum (FWHM) of (0 0 0 2) peak of
sample B is 0.1488, which is narrower than that of
sample A, 0.1978. The narrower FWHM implies
that the N-doped film is of better crystal quality.
From the statistical result, we inferred that the
length of c-axis was 5.166
(
A in sample A while it is
5.181
(
A in sample B. They are both slightly smaller
than that of bulk ZnO whose c-axis length is
5.2071
(
A, 2y=34.428. This can be ascribed to
tensile stress induced by the deposition process.
The o-rocking curves are shown in the inset of
Fig. 1. It shows that ZnO grows in single c-axis
orientation with the c-axis normal to the sapphire
basal plane, indicating a heteroepitaxial relation-
ship of (0 0 0 1)
ZnO
k(0 0 0 1)
sapphire
. The FWHM
values of o-rocking curve of samples A and B are
0.568 and 0.348, which indicates that the N-doped
sample has smaller mosaicity.
Room temperature photoluminescence (RT-PL)
spectra are performed as shown in Fig. 2. Ultra-
violet (UV) emission, with peak energy positions
of 3.30 and 3.289 eV, is dominantly observed in
samples A and B respectively. The FWHM was
87 meV for sample A, which is narrower than the
value 97 meV of sample B. The FWHM values of
both samples A and B are higher than that of ZnO
films reported by others using MBE and MOCVD
[8,9]. A deep level emission at around 2.513 eV can
be weakly observed in sample A. Its enlarged
figure is shown inset. This deep visible transition is
believed to come from oxygen vacancies, inter-
stitial zinc or zinc vacancies [10–12]. In sample B,
the peak position of deep level transition is weakly
observed around 2.229 eV. In comparison with a
previous study [13], the intensity of the deep level
transition is much lower. The deep level transition
shifts to the lower energy side relative to that of
sample A, which may be related to nitrogen
doping. The ratios of the intensity of UV emission
(I
UV
) to that of deep level emission (I
DLE
) are 193
(sample A) and 136 (sample B), at room tempera-
ture, respectively. The values are both rather high
in comparison with another reported ratio value of
60 observed in ZnO film deposited by molecular
beam epitaxy (MBE) [14] and of 1 by MOCVD
[15]. This high ratio implies that our sample is of
high optical quality. The relatively small I
UV
=I
DLE
value of sample B may be due to a slight increase
in intrinsic defects in ZnO due to nitrogen doping.
PL spectra under different excitation powers were
performed. We do not find any shift of the position
of the UV emission peak. The integrated PL
intensity as a function of the excitation power on
the logarithmic scale is plotted as shown in Fig. 3.
From the figure, it is obvious that the solid line fits
well the data shown by the black square in both
samples. The PL intensity is linearly dependent on
the excitation power. This indicates that the
Fig. 2. Room temperature PL spectrum of ZnO film. The enlarged deep level transition is shown in the inset. (a) Non-doped ZnO film;
(b) N-doped ZnO film.
X. Wang et al. / Journal of Crystal Growth 226 (2001) 123–129 125
dominant photoluminescence of our sample
should be the excitonic radiative recombination
at room temperature.
Low temperature measurement is performed at
10 and 77 K for further study of the optical
properties. Fig. 4(a) and (b) correspond to samples
A and B, respectively. As shown in Fig. 4(a), four
peaks appear at 3.377, 3.370, 3.333 and 3.241 eV,
respectively. The dominant peak at 3.377 eV is
ascribed to the A-exciton emission while the peak
at 3.370 eV corresponds to D8X bound exciton
transition. The peaks at 3.333 and 3.241 eV are due
to the donor–acceptor pair transition and LO
phonon replica, respectively. In the PL spectrum
of 77 K shown in the inset of Fig. 4, the peak due
to D8X bound exciton transition is hardly
observed. The energy positions of other peaks
are at 3.373, 3.314 and 3.238 eV, respectively. They
all shift to the low energy side compared to that at
10 K due to thermal effect. From Fig. 4(b), we can
find two dominant peaks at 3.386 and 3.372 eV
and four other peaks with low intensity at 3.324,
3.248, 3.196 and 3.125 eV, respectively. The peak
at 3.386 eV is ascribed to A-exciton emission while
the peak at 3.372 eV is due to D8X bound exciton
transition. In comparison with that of sample A,
the two peaks shift to high energy level. The peak
at 3.324 eV corresponds to donor–acceptor transi-
Fig. 3. The room temperature dependence of integrated output intensity on excitation intensity on the logarithmic scale. (a) Non-
doped ZnO film; (b) N-doped ZnO film.
Fig. 4. Low temperature PL spectra of ZnO film. (a) Non-doped ZnO film; (b) N-doped ZnO film.
X. Wang et al. / Journal of Crystal Growth 226 (2001) 123–129126
tion while the peaks at 3.248, 3.196 and 3.125 eV
are due to the LO phonon replicas, respectively.
From the 77 K PL spectrum of sample B as shown
in the inset, we find that all the peak positions shift
to the low energy side. Six peaks can also be found
at 3.372, 3.360, 3.3137, 3.239, 3.189 and 3.106 eV.
In comparison with PL spectrum of sample A, we
find that more peaks are observed and the
dominant peak shifts to the higher energy side.
The possible reason is the doping of nitrogen. We
find that sample B shows better optical quality
than sample A at low temperature. By the way,
deep level emission is hardly observed in the PL
spectra of both samples at low temperature.
Raman scattering is performed on both samples
at room temperature in back-scattering configura-
tion as shown in Fig. 5(a) and (b). ZnO has a
hexagonal wurtzite structure and belongs to the
C
6n
symmetry group. In our back-scattering
configuration, A
1(LO)
and E
2
are Raman active.
The peaks at 437.6 cm
À1
in Fig. 5(a) and
437.9 cm
À1
in Fig. 5(b) are ascribed to high
frequency E
2
mode. Since the measure range of
our micro-Raman system was from 100 to
4000 cm
À1
, we cannot observe the low frequency
E
2
mode. Raman spectrum of ZnO powder is also
performed as shown in Fig. 5(c), in which we
observe the peak position of E
2
modes lies at
437.4 cm
À1
. The slight discrepancy of the position
of the E
2
mode of ZnO films and powder shows
that our samples are almost free of stress. We find
the second order Raman spectrum arising from
zone-boundary phonons 2-E
2
(M) at 338 cm
À1
[16].
As shown in Fig. 5(a), the peaks at 380, 417.4,
447.7, 575.9 and 749.4 cm
À1
are ascribed to
sapphire substrate. Since our ZnO film is relatively
Fig. 5. Raman spectra of ZnO films and ZnO powder. (a) Raman spectrum of non-doped ZnO film; (b) Raman spectrum of N-doped
ZnO film; (c) Raman spectrum of ZnO powder.
X. Wang et al. / Journal of Crystal Growth 226 (2001) 123–129 127
thin and non-doped ZnO and sapphire are both
nearly transparent to visible laser light as shown in
Fig. 6, we can clearly observe the Raman peaks of
sapphire. In Fig. 5(b), the second order Raman
spectrum arising from zone-boundary phonons 2-
E
2
(M) is also observed at 331 cm
À1
. The Raman
peaks from sapphire have a low intensity. This is
due to the higher absorption ratio of nitrogen
doped ZnO film relative to non-doped one as
shown in Fig. 6. We can find a dominant peak at
581 cm
À1
in Fig. 5(b) which is ascribed to A
1(LO)
mode. We did not find this A
1(LO)
mode clearly in
non-doped ZnO film. In the Raman study of GaN,
the intensity of A
1(LO)
mode increased with the
decrease of carrier concentration [17]. We think
that ZnO may have the same characteristics as
GaN. Since the carrier concentration of nitrogen
doped ZnO is more than 1000 times smaller than
that of the non-doped one, which is about
4.0 Â 10
17
cm
À3
, we expect that the intensity of
A
1(LO)
should be stronger. This may be the reason
why we find A
1(LO)
mode in N-doped sample but
not in the non-doped sample. Both the higher
intensity of A
1(LO)
mode and the observation of E
2
mode and A
1(LO)
mode coinciding with the
prediction of group theory imply the better crystal
quality of nitrogen doped ZnO film. In the Raman
spectrum of nitrogen doped ZnO film, other peaks
at 274, 508, 641.9, and 857 cm
À1
can be found. The
possible reason may be related to nitrogen doping
and further study about this should be going on.
The resistivity of non-doped ZnO film by four-
point probe measurements is 0.65 O cm. Due to the
high resistivity and low carrier concentration of N-
doped film, four-point probe measurements are
not reliable. However, ohmic contacts are formed
by Al metal on high resistive ZnO film, which
indicates that the N-doped ZnO film is still n-type.
The resistivity of N-doped ZnO film is estimated to
be 5 Â 10
4
O cm by I–V measurement.
4. Conclusions
High quality N-doped and non-doped ZnO
films are successfully deposited. XRD spectra
show that ZnO films are both c-oriented while
the N-doped films show better crystal quality with
smaller mosaicity relative to non-doped samples.
UV emission and deep level transition are ob-
served from PL spectrum at room temperature.
The high value of I
UV
=I
DLE
indicates high optical
quality. We find A band free exciton emission and
D8X bound exciton transition from PL spectrum
at 10 K in both samples. In Raman spectrum of
ZnO film, E
2
and A
1(LO)
modes are observed in N-
doped sample while A
1(LO)
is hardly observed at
non-doped one. In comparison with Raman
spectrum of ZnO powder, we find that the peak
positions of E
2
mode are almost the same
indicating that ZnO films are almost free of stress.
High resistive but not p-type ZnO film is realized
by nitrogen doping.
Acknowledgements
This work was supported by NSFC-RGC (No.
59910161983) and Jilin Province Science Fund
(No. 19990518-1).
References
[1] Toru Soki, Yoshinori Hatanaka, David C. Look, Appl.
Phys. Lett. 76 (2) (2000) 3257.
[2] Y. Liu, C.R. Gorla, S. Liang et al., J. Electron. Mater. 29
(1) (2000) 60.
[3] H. Cao, Y.G. Zhao, H.C. Ong et al., Appl. Phys. Lett. 73
(25) (1998) 3656.
Fig. 6. Absorption spectrum of ZnO film. (Solid line}non-
doped ZnO film; Dash line}N-doped ZnO film.)
X. Wang et al. / Journal of Crystal Growth 226 (2001) 123–129128
[4] Z.K. Tang, G.K.L. Wong, P. Yu et al., Appl. Phys. Lett.
72 (25) (1998) 3270.
[5] D.M. Bagnall, Y.F. Chen, Z. Zhu et al., Appl. Phys. Lett.
70 (17) (1997) 2230.
[6] P. Yu, Z.K. Tang, G.K.L. Wong, M. Kawaski, A. Ohtono,
H. Koinuma, in: M. Scheffler, Zimmermann (Eds.),
Physics of Semiconductors, World Scientific, Singapore,
1996, p. 1453.
[7] K. Ohkawa, A. Ueno, O. Mitsuyu, J. Crystal Growth 117
(1992) 375.
[8] C.R. Gorla, N.W. Emanetoglu, S. Liang et al., J. Appl.
Phys. 85 (5) (1999) 2595.
[9] Yefan Chen, D.M. Bagnall, Hang-jun Koh, et al., J. Appl.
Phys. 84(7) (1998) 3912.
[10] D.C. Reynolds, D.C. Look, B. Jogni, Solid State Com-
mun. 101 (1997) 643.
[11] K. Vanheusden, W.L. Warren, C.H. Seager, J. Appl. Phys.
79 (1996) 7983.
[12] E.G. Bylander, J. Appl. Phys. 49 (3) (1978) 1188.
[13] K. Iwata, P. Fons, A. Yamada, K. Matsubara, S. Niki,
J. Crystal Growth 209 (2000) 526.
[14] H. Kumano, A.A. Ashrafi, A. Heta et al., J. Crystal
Growth 214–215 (2000) 280.
[15] S. Bethke, K. Pan, B.W. Wesseis, Appl. Phys. Lett. 52
(1988) 138.
[16] J.M. Calleja, M. Cardona, Phys. Rev. B 16 (1977) 3753.
[17] N. Wieser, M. Klose, T. Dassow, F. Scholz, J. Off, J.
Crystal Growth 189/190 (1998) 661.
X. Wang et al. / Journal of Crystal Growth 226 (2001) 123–129 129