MALNUTRITION AND INFECTIOUS DISEASE MORBIDITY AMONG CHILDREN MISSED BY THE CHILDHOOD IMMUNIZATION PROGRAM IN INDONESIA pot
Bạn đang xem bản rút gọn của tài liệu. Xem và tải ngay bản đầy đủ của tài liệu tại đây (44.64 KB, 10 trang )
SOUTHEAST ASIAN J TROP MED PUBLIC HEALTH
120
Vol 38 No. 1 January 2007
Correspondence: Dr Richard D Semba, Johns
Hopkins School of Medicine, 550 N. Broadway,
Suite 700, Baltimore, MD 21205, USA.
Tel: 1-410-955-3572; Fax: 1-410-955-0629
E-mail:
INTRODUCTION
Each year, more than 10 million children
die, and the vast majority of child deaths are
in developing countries (Black et al, 2003). Al-
though childhood immunization programs
have led to substantial reductions in measles,
poliomyelitis, diphtheria, tetanus, and whoop-
ing cough, worldwide about 2.5 million chil-
dren under five years of age still die every year
as a result of vaccine-preventable diseases
(WHO/UNICEF, 2005). More child deaths
MALNUTRITION AND INFECTIOUS DISEASE MORBIDITY
AMONG CHILDREN MISSED BY THE CHILDHOOD
IMMUNIZATION PROGRAM IN INDONESIA
Richard D Semba
1
, Saskia de Pee
2
, Sarah G Berger
1
, Elviyanti Martini
3
, Michelle O Ricks
1
and Martin W Bloem
1,4
1
The Johns Hopkins Medical Institutions, Baltimore, MD, USA;
2
Helen Keller International
Asia Pacific, Singapore;
3
Helen Keller International, Jakarta, Indonesia;
4
Nutrition Service,
Policy, Strategy and Program Support Division, World Food Program, Rome, Italy
Abstract. Although it has been thought that child immunization programs may miss the chil-
dren who are in greatest need, there are little published quantitative data to support this idea.
We sought to characterize malnutrition and morbidity among children who are missed by the
childhood immunization program in Indonesia. Vaccination and morbidity histories, anthro-
pometry, and other data were collected for 286,500 children, aged 12-59 months, in rural
Indonesia. Seventy-three point nine percent of children received complete immunizations (3
doses of diphtheria-pertussis-tetanus, 3 doses of oral poliovirus, and measles), 16.8% had
partial coverage (1-6 of 7 vaccine doses), and 9.3% received no vaccines. Of children with
complete, partial, and no immunization coverage, respectively, the prevalence of severe un-
derweight (weight-for-age Z score <-3) was 5.4, 9.9, and 12.6%, severe stunting (height-for-
age Z score <-3) was 10.2, 16.2, and 21.5%, and current diarrhea was 3.8, 7.3, and 8.6% (all
p <0.0001), respectively. In families where the child had complete, partial, and no immuniza-
tions, the history of infant mortality was 6.4, 11.4, and 16.5%, and under-five child mortality
was 7.3, 13.4, and 19.2% (both p <0.0001). Expanded programmatic coverage is needed to
reach children who are missed by childhood immunizations in rural Indonesia, as missed chil-
dren are at higher risk of morbidity and mortality.
could be prevented through optimal use and
wider coverage of currently existing vaccines
(Jones et al, 2003; WHO/UNICEF, 2005; CDC,
2006). In many developing countries, immu-
nization coverage has increased only margin-
ally since the early 1990s, and an estimated
27 million infants were not immunized in 2003
(WHO/UNICEF, 2005). Child survival interven-
tions, such as basic childhood immunizations,
may not be reaching the children who need
them the most (Bryce et al 2003).
In 2005, the Global Immunization Vision
and Strategy (GIVS) was jointly developed by
the WHO, the United Nations Children’s Fund
(UNICEF), and global partners in order to es-
tablish goals for 2006-2015 that included pro-
tecting more people against disease by sus-
CHILDREN MISSED BY IMMUNIZATION PROGRAMS
Vol 38 No. 1 January 2007 121
taining current levels of vaccine coverage and
by extending immunization services to those
who are currently unreached (WHO/UNICEF,
2005). The GIVS recommends that strength-
ened surveillance, monitoring, and evaluation
will be needed in order to reach these goals
(WHO/UNICEF, 2005). The GIVS will be criti-
cal to achieving the Millennium Development
Goals of reducing child mortality by two-thirds
between 1990 and 2015 (WHO/UNICEF,
2005).
The Expanded Program on Immunization
(EPI) of the WHO was launched in 1974 and
included an immunization schedule in which
infants receive diphtheria-pertussis-tetanus
vaccine (DPT) and oral poliovirus vaccine
(OPV) at 6, 10, and 14 weeks, and measles
vaccine at 9 months of age (Kim-Farley et al,
1987). The overall coverage rates for the EPI
in Indonesia in 2003 were 70% for OPV and
DPT and 72% for measles (WHO, 2004), and
these rates of immunization coverage are con-
sistent with overall rates of coverage for three
doses of DTP of 69% reported in the South-
east Asian region in 2004 (CDC, 2006).
The effectiveness of a vaccine program
depends in part upon the proportion of indi-
viduals who are covered by the immunization
schedule, and the characteristics of children
who are missed by immunizations and their
families in developing countries are not well
known. We hypothesized that children who are
missed by childhood immunizations are more
likely to be malnourished, anemic, with higher
infectious morbidity, and to come from fami-
lies with higher infant and under five child
mortality. In order to address these hypothe-
ses, we investigated childhood immunization
coverage in a large nutritional surveillance pro-
gram in Indonesia from 2000 through 2003.
MATERIALS AND METHODS
The study subjects consisted of children
from families that participated in a major nu-
tritional surveillance system (NSS) in Indone-
sia that was established by the Ministry of
Health, Government of Indonesia and Helen
Keller International (HKI) in 1995 (de Pee et
al, 2002). The NSS was conducted in the prov-
inces of Lampung, Banten, West Java, Cen-
tral Java, East Java, Lombok, and South
Sulawesi. The subjects included in this analy-
sis were surveyed between January 1, 2000
through September 27, 2003. The NSS was
based upon UNICEF’s conceptual framework
on the causes of malnutrition (de Pee and
Bloem, 2001) with the underlying principle to
monitor public health problems and guide
policy decisions (Mason et al, 1984). The NSS
was based upon multistage cluster sampling
of households in rural villages and in slum
areas of large cities (de Pee et al, 2002).
The NSS in Indonesia involved the col-
lection of data from approximately 40,000 ran-
domly selected rural households every quar-
ter. New households were selected every
round. Data were collected by two to four-
person field teams. A structured coded ques-
tionnaire was used to record data on children
aged 0-59 months, including anthropometric
measurements, date of birth, and sex. The
mother of the child or other adult member of
the household was asked to provide informa-
tion on the household’s composition, paren-
tal education, and weekly household expen-
ditures, along with other socioeconomic, en-
vironmental sanitation, health indicators, and
attendance at the local integrated health post
(posyandu) where childhood immunizations
are administered. For each child, the mother,
father, or guardian was asked whether the
child received diphtheria-pertussis-tetanus
(DPT) vaccine (DPT-1, DPT-2, DPT-3), oral
poliovirus vaccine (OPV) (OPV-1, OPV-2, OPV-
3), and measles vaccine. The questionnaire did
not include OPV-0 (at birth). The interviewer
asked to review the child immunization card
in order to verify the responses. A child was
considered to have received a vaccine if the
SOUTHEAST ASIAN J TROP MED PUBLIC HEALTH
122
Vol 38 No. 1 January 2007
response was “yes” in the absence of an im-
munization card or “yes” as verified as re-
corded on the immunization card. A child was
considered to have missed a vaccine if the
response was “no” in the absence of an im-
munization card or verified as not recorded on
the immunization card. The NSS included
questions regarding vaccination status begin-
ning in 2000. Axillary temperature was re-
corded. Hemoglobin was measured using a
HemoCue© instrument (HemoCue AB,
Angelholm, Sweden). Morbidity histories were
obtained for each child, including history of
diarrhea in the previous week and current di-
arrhea. Data was collected on the history of
any infant dying in the family before one month
of age, any infant dying before 12 months of
age, and any child deaths in the family before
5 years of age.
The field teams measured and recorded
the weight of each child age 0-59 months to
the nearest 0.1 kg and the length/height to
the nearest 0.1 cm. Birth dates of the chil-
dren were obtained from the birth certificate
or other records. When not available, the birth
dates were estimated using a calendar of lo-
cal and national events and converted to the
Gregorian calendar. Z-scores of weight-for-
height (wasting), weight-for-age (underweight),
and height-for-age (stunting) were calculated
using EpiInfo software (Centers for Disease
Control and Prevention, Atlanta, GA), which
uses the reference population of the US Na-
tional Center for Health Statistics. Children
with Z-scores < -2 standard deviations (SD)
for weight-for-height, weight-for-age, or
height-for-age were considered wasted, un-
derweight, or stunted (de Onis, 2001). Severe
wasting, underweight, and stunting were de-
fined by respective Z scores < -3 SD. Chil-
dren who had a mid-upper arm circumference
<125 mm were considered at high risk of
malnutrition (Dramaix et al, 1993). HKI pro-
vided training to new field teams, field super-
visors, and assistant field officers, and re-
fresher training prior to each new round of data
collection. During each round, a monitoring
team from HKI visited all field sites to check
and calibrate the equipment and supervise
data collection. A quality control team from
HKI revisited 10% of households without prior
warning within two days of data collection by
the field teams and recollected data on se-
lected indicators, including anthropometric
measurements. Data collected by these qual-
ity control teams were later compared with the
data collected by the field teams to check the
accuracy of the data collection.
The study protocol complied with the
principles set out in the Helsinki Declaration
(World Medical Association, 2001). The field
teams were instructed to explain the purpose
of the NSS and data collection to each child’s
mother or caretaker, and, if present, the fa-
ther and/or household head; data collection
and phlebotomy proceeded only after written
informed consent. Participation was voluntary
and all subjects were free to withdraw at any
stage of the interview. The protocol for the
NSS was approved by the Medical Ethical
Committee of the Ministry of Health, Govern-
ment of Indonesia. The plan for secondary
data analysis by Johns Hopkins investigators
was reviewed by the Johns Hopkins School
of Medicine Institutional Review Board and
granted an exemption on July 14, 2006 un-
der Department of Health and Human Services
45, Code of Federal Regulations 46.404.
Data analyses were restricted to children
who were 12-59 months of age because chil-
dren are expected to have completed the DPT,
OPV, and measles vaccine series by 12
months of age. The youngest child 12-59
months of age was selected to represent each
family for families with more than one child in
the 12-59 month age range. Children were
classified as having received complete immu-
nizations if they reportedly received all seven
immunizations (three DPT immunizations,
three OPV immunizations, and measles), or
CHILDREN MISSED BY IMMUNIZATION PROGRAMS
Vol 38 No. 1 January 2007 123
partial immunizations if they reportedly re-
ceived one to six of the seven immunizations,
and no immunizations if they reportedly re-
ceived none of the seven immunizations. Con-
tinuous variables were compared using
Student’s t-test or ANOVA. Distance to the
health post (posyandu) and time needed to
walk to the health post were transformed us-
ing log
e
in order to normalize the data. Cat-
egorical variables were compared using chi-
square tests. Anemia was defined as a hemo-
globin <11 g/dl, according to World Health Or-
ganization criteria (WHO, 1968). Multivariate
logistic regression models were used to ex-
amine the relationship between not receiving
any vaccines and different risk factors. Popu-
lation-based weighting was used to account
for differences in population size in the vari-
ous provinces.
RESULTS
During the period of the study from 2000
through 2003, of 336,724 families with at least
one child age 12-59 months immunization his-
tories were obtained for 290,422 (86.2%) chil-
dren. The proportion of children who received
a DPT, OPV, and measles vaccines is shown
in Table 1. The proportion of children who did
not receive a DPT vaccine increased from
12.9% with the first immunization to 19.5%
for the third immunization, and the proportion
of children who did not receive an OPV vac-
cine increased from 11.3% for the first immu-
nization to 17.5% for the third immunization.
The proportion of children who missed the
measles vaccine was 20.2%.
Demographic, nutritional, and morbidity
characteristics of 286,500 children who re-
ceived complete immunizations, partial immu-
nizations, or no immunizations are shown in
Table 2. There were 3,922 children (1.4%) for
whom the parent or guardian answered “don’t
know” in response to receipt of all seven vac-
cinations, and these children are excluded
from Table 2. Children who received partial or
Vaccine No. %
DPT vaccine dose 1
Not received 37,425 12.9
Received, with record 147,283 50.7
Received, no record 99,692 34.3
Doesn’t know 6,023 2.1
DPT vaccine dose 2
Not received 48,173 16.6
Received, with record 141,605 48.8
Received, no record 94,339 32.5
Doesn’t know 6,308 2.2
DPT vaccine dose 3
Not received 56,742 19.5
Received, with record 136,483 47.0
Received, no record 90,425 31.1
Doesn’t know 6,677 2.3
DPT vaccine series – total
No vaccines received 36,556 12.6
Partial (received 1 or 2 vaccines) 21,824 7.5
Complete (received all 3 vaccines) 226,029 77.9
Doesn’t know 5,920 2.0
OPV vaccine dose 1
Not received 32,768 11.3
Received, with record 149,652 51.5
Received, no record 102,098 35.2
Doesn’t know 7,914 2.0
OPV vaccine dose 2
Not received 41,419 14.3
Received, with record 145,430 50.1
Received, no record 97,394 33.5
Doesn’t know 6,182 2.2
OPV vaccine dose 3
Not received 50,750 17.5
Received, with record 140,804 48.5
Received, no record 92,300 31.8
Doesn’t know 6,518 2.2
OPV vaccine series – total
No vaccines received 31,954 11.0
Partial (received 1 or 2 vaccines) 20,131 6.9
Complete (received all 3 vaccines) 232,392 80.0
Doesn’t know 5,843 2.0
Measles
Not received 58,775 20.2
Received, with record 132,647 45.7
Received, no record 93,771 32.0
Doesn’t know 6,143 2.1
Table 1
Immunization coverage among children
(N = 290,422), 12-59 months of age, in
rural Indonesia, 2000-2003.
SOUTHEAST ASIAN J TROP MED PUBLIC HEALTH
124
Vol 38 No. 1 January 2007
Characteristic p-value
No. % No. % No. %
Child age in months (%)
12-23.9 79,368 37.5 23,470 48.8 10,943 40.9 0.0001
24-35.9 61,638 29.1 12,610 26.2 7,556 28.3
36-47.9 43,740 20.8 7,763 16.2 5,134 19.2
48-59.9 26,947 12.7 4,224 8.8 3,107 11.6
Gender (% Male) 107,241 50.7 24,809 51.6 13,471 50.8 0.0001
Maternal age in years (%)
≤24 57,823 27.3 15,608 32.5 8,782 32.9 0.0001
25-28.9 53,972 25.5 11,550 24.0 6,545 24.5
29-32.9 49,341 23.3 9,538 19.9 5,015 18.8
33+ 50,392 23.8 11,331 23.6 6,380 9.4
Maternal education in years (%)
0-6.9 116,097 55.1 34,621 73.1 22,663 88.8 0.0001
7-9.9 46,739 22.2 7,760 16.4 1,968 7.7
≥10 57,949 22.7 4,960 10.5 877 3.4
Paternal education in years (%)
0-6.9 99,891 48.8 28,261 63.7 18,582 80.6 0.0001
7-9.9 40,591 19.8 7,881 17.8 2,593 11.2
≥10 64,237 31.4 8,242 18.6 1,888 8.2
Number of children <5 years in family
1 167,335 79.2 35,850 74.7 18,390 68.8 0.0001
2 40,449 19.1 10,927 22.8 7,238 27.1
3 3,253 1.5 1,061 2.2 977 3.7
4+ 350 0.2 138 0.3 109 0.4
Year in which interview was conducted
2000 55,445 26.2 11,371 23.7 6,707 25.1 0.0001
2001 52,054 24.6 11,202 23.3 6,466 24.2
2002 62,384 29.5 14,744 30.7 8,571 32.1
2003 41,811 19.8 10,750 22.4 4,995 18.7
Weight-for-age Z (WAZ) score (%)
WAZ < -2 74,452 35.3 21,879 45.7 13,286 49.8 0.0001
WAZ < -3 11,349 5.4 4,721 9.9 3,373 12.6 0.0001
Height-for-age Z (HAZ) score (%)
HAZ < -2 78,448 37.3 22,420 47.3 14,200 53.8 0.0001
HAZ < -3 21,457 10.2 7,668 16.2 5,662 21.5 0.0001
Weight-for-height Z (WHZ) score (%)
WHZ < -2 13,629 6.5 3,945 8.3 2,295 8.6 0.0001
WHZ < -3 1,082 0.5 316 0.7 219 0.8 0.0001
MUAC <125 mm (%) 4,661 2.2 1,861 3.9 1,065 4.0 0.0001
Diarrhea today (%) 7,946 3.8 3,525 7.3 2,301 8.6 0.0001
Fever today (%) 2,535 1.3 857 1.9 430 1.7 0.0001
Diarrhea last week (%) 12,443 5.9 4,757 9.9 2,649 9.3 0.0001
Anemic (%) 21,610 47.9 5,772 57.5 3,247 58.4 0.0001
Weekly per capita household 162,588 1.81 37,228 1.71 20,425 1.46 0.0001
expenditure (US$)
2
(1.80-1.81) (1.69-1.73) (1.44-1.48)
Distance to health post (posyandu)
In meters
2
203,130 103.8 44,437 111.2 19,546 198.3 0.0001
(103.1-104.6) (109.6-113.0) (193.2-203.5)
In minutes
2
202,292 5.11 44,269 5.55 18,516 7.26 0.0001
(5.09-5.14) (5.49-5.60) (7.15-7.38)
Table 2
Demographic and morbidity characteristics of children (N = 286,500) by vaccine receipt
status in rural Indonesia.
1
Complete defined as receiving OPV-1, OPV-2, OPV-3, DPT-1, DPT-2, DPT-3, and measles vaccines; partial defined as
receiving at least one of the seven vaccine doses, and no receipt as receiving none of the seven vaccine doses.
2
Geometric mean (95% CI).
Complete
1
Partial
1
No. receipt
1
CHILDREN MISSED BY IMMUNIZATION PROGRAMS
Vol 38 No. 1 January 2007 125
no immunizations were younger, had younger
mothers, had lower levels of maternal and
paternal education, and had more children in
the family. There were slightly more males
among children who received partial or no
immunizations.
The proportion of children who were un-
derweight or had stunting, wasting, or MUAC
<125 mm was significantly higher among chil-
dren who had partial or no immunizations
compared with children who had complete
immunizations. The proportion of children with
severe underweight, stunting, or wasting (WAZ
< -3, HAZ <-3, or WHZ <-3, respectively) was
significantly higher among children who had
partial or no immunizations compared with
children who had complete immunizations.
Children who had partial or no immunizations
were more likely to have current diarrhea or
fever or diarrhea in the previous week, and
they were also more likely to be anemic com-
pared with children who received complete
immunizations. The distance to the health post
(posyandu), whether reported in meters or in
minutes walking, was significantly higher for
children with partial or no immunizations com-
pared with children who received complete
immunizations.
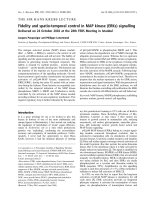
The history of infant deaths and deaths
of children under five years of age was com-
pared between families where the child had
complete, partial, or no immunizations (Fig 1).
In families where the child had complete, par-
tial, or no immunizations, a history of infant
mortality was 6.4, 11.4, and 16.5%, and un-
der-five child mortality was 7.3, 13.4, and
19.2%, respectively (both p <0.0001). The pro-
portion of families in which there was at least
one infant death under one month of age was
also significantly higher for children who re-
ceived no immunizations and was lowest
among those who had complete immuniza-
tions.
Multivariate logistic regression models
were used to characterize risk factors for not
receiving any immunizations (Table 3). In a
model adjusting for child age, gender, mater-
nal age, and per capita weekly household ex-
penditure, low maternal education of 0 through
6 years was a strong risk factor for the child
receiving no immunizations (OR 8.39, 95% CI
8.08-9.11). In a second model adjusting for
the above factors and distance to the local
health post (posyandu), low maternal educa-
tion of 0 through 6 years remained a strong
risk factor for the child receiving no immuni-
zations (OR 7.29, 95% CI 6.61-8.04). Lower
maternal age was also significantly related to
the child receiving no immunizations in the
second model.
The general reasons given for not visiting
the local health post (posyandu) are shown in
Table 4. The five leading specific reasons that
were given for not attending the posyandu
were that the health post was not active, the
child was already old, immunizations were
complete, the child was usually brought to
other health services, and the health post was
too far.
DISCUSSION
This study shows that over 9% of chil-
dren did not receive any of the seven immuni-
0
5
10
15
20
25
Infant died <1 month Infant died <12
months
Child died <5 years
Complete immunizations
Partial immunizations
No immunizations
Fig 1–History of infant and child under five deaths
in the family by immunization status.
a
a
a
a
p<0.0001 by Mantel-Haenszel chi-square.
SOUTHEAST ASIAN J TROP MED PUBLIC HEALTH
126
Vol 38 No. 1 January 2007
Variable OR 95% CI p-value
Model 1
Child age (per month) 0.998 0.996-0.999 0.001
Child gender (boy) 1.003 0.97-1.03 0.87
Maternal age (years)
<24 1.30 1.24-1.35 0.0001
24-28.9 1.10 1.05-1.14 0.0001
29-32.9 0.94 0.89-0.99 0.013
33+ 1.00 - -
Maternal education (years)
0-6.9 8.39 8.08-9.11 0.0001
7-9.9 2.00 1.81-2.21 0.0001
10+ 1.00 - -
Weekly household per capita expenditure (per US$) 0.949 0.942-0.957 0.0001
Model 2
Child age (per month) 1.00 0.998-1.001 0.89
Child gender (boy) 0.99 0.96-1.03 0.77
Maternal age (years)
<24 1.26 1.20-1.33 0.0001
24-28.9 1.07 1.02-1.13 0.01
29-32.9 0.92 0.87-0.97 0.003
33+ 1.00 - -
Maternal education (years)
0-6.9 7.29 6.61-8.04 0.0001
7-9.9 1.95 1.73-2.19 0.0001
10+ 1.00 - -
Weekly household per capita expenditure (per US$) 0.98 0.97-0.99 0.0001
Log
e
distance to health post (posyandu) (per minute walking) 1.36 1.33-1.38 0.0001
Table 3
Multivariate logistic regression models of risk factors for child receiving no immunizations.
Table 4
Reasons for not taking child to health post (posyandu) in children who had partial or no
immunizations.
Reason N %
Health post not active 11,285 26.7
Child is already old 4,890 11.6
Immunizations are complete 4,052 9.6
Usually bring child to other health services 3,148 7.4
Health post too far 2,949 7.0
Mother is too busy 2,713 6.4
Child afraid of weighing 2,018 4.8
Doesn’t know schedule 1,444 3.4
Just moved to survey area 994 2.3
There is no food supplementation program 165 0.4
Need to pay 157 0.4
Other reasons 8,491 20.1
CHILDREN MISSED BY IMMUNIZATION PROGRAMS
Vol 38 No. 1 January 2007 127
zations, and over 20% of children missed
measles immunization in rural Indonesia. Chil-
dren who missed their childhood immuniza-
tions were more likely to be malnourished and
anemic, have higher infectious disease mor-
bidity, and were more likely to come from a
family in which there was already a higher rate
of infant and under-five child mortality. In ad-
dition, children missed by childhood immuni-
zations had higher rates of severe malnutri-
tion, as indicated by weight-for-height, height-
for-age, and weight-for-age Z scores <-3.
These findings suggest that children who miss
DPT, OPV, and measles immunizations are at
a much higher risk of mortality, not only from
missing the vaccines and having less protec-
tion against vaccine-preventable diseases, but
from having a higher prevalence of malnutri-
tion and morbidity. These findings support the
idea that child survival interventions are not
reaching the children who may need them the
most (Bryce et al, 2003).
Risk factors that have been associated
with lack of childhood immunizations in de-
veloping countries include low socioeconomic
status and low level of maternal education
(Streatfield et al, 1990; Perry et al, 1998; Wa-
ters et al, 2004). In the present study, low
maternal education was a strong risk factor
for lack of child immunizations in multivariate
models that adjusted for distance to the health
post and other factors. The level of formal
education of women is strongly associated
with child mortality and other determinants,
such as health care utilization (Basu and
Stephenson, 2005). It is not completely clear
why women who have a higher level of formal
education have lower morbidity and mortality
among their children, and it does not appear
to be correlated with income or heightened
knowledge of disease etiology (Basu and
Stephenson, 2005). Factors that have been
implicated include a better ability to under-
stand decontextualized information from mass
media and health workers, greater autonomy
and empowerment of women, respect for au-
thority, and ability to follow a time table of rou-
tine (Basu and Stephenson, 2005). For immu-
nization programs, the implications of higher
maternal education may be an enhanced ca-
pability of women to understand health mes-
sages regarding immunizations, to follow the
recommendations of health care workers from
the local health post, and to adhere to the tim-
ing of the immunization schedule.
The present study also shows that fami-
lies with lower incomes and families living at a
greater distance from the health post are at
higher risk of having low immunization cover-
age among their children. There is an appar-
ent inequity in coverage by the childhood im-
munization program, and potential solutions
may include encouraging health workers to go
the extra kilometer, literally, to reach the poor-
est of the poor and the families most remote
from the health post.
Children who received no immunizations
came from families in which the risk of
underfive child mortality was about 2.6 times
higher than that for families in which children
received complete immunizations. Likewise,
the risk of infant mortality was about 2.6 times
higher for families in which children received
no immunizations compared to families in
which children received complete immuniza-
tions. The causes for the increased infant and
under five child mortality in families in which
the child received no immunizations cannot
be determined from this study, but there are
several possibilities, including previous siblings
not receiving vaccines and higher rates of
malnutrition and infectious disease morbidity
clustered in the same families. Further stud-
ies will be needed to examine these issues.
Despite the successes of childhood im-
munization programs in many regions world-
wide, existing vaccines are not being used to
their fullest potential (CDC, 2006). For ex-
ample, of the 2.5 million child deaths due to
vaccine-preventable diseases in 2002, 4,000
SOUTHEAST ASIAN J TROP MED PUBLIC HEALTH
128
Vol 38 No. 1 January 2007
children died from diphtheria, 198,000 children
died from tetanus, and 540,000 died from
measles (CDC, 2006). Rates of diphtheria-
pertussis-tetanus immunization coverage have
actually declined in both sub-Saharan Africa
and South Asia since 1995 (Bryce et al, 2003).
In the present study, the main reasons
cited by the mother, father, or guardian for not
taking their child to the health post (posyandu)
were that the health post was no longer ac-
tive, or that they thought the child was too
old, or that the child already had received im-
munizations. A limitation of the present study
was the surveillance teams did not determine
whether the closest health post was no longer
active, thus, it was not possible to verify
whether the health post was actually closed.
The study suggests that in these rural com-
munities there may be insufficient knowledge
of the schedule of childhood immunizations.
The strategies of the GIVS for increasing
immunization coverage include regular analy-
sis to document success and failure of immu-
nization activities and monitoring of coverage
at local levels (WHO/UNICEF, 2005). The
present study shows that large nutritional sur-
veillance systems, as used in Indonesia and
Bangladesh, can be used to provide ongoing
surveillance of immunization coverage and
other activities aimed at child survival. The
nutritional surveillance system in Indonesia
was discontinued in 2003, but the nutritional
surveillance system in Bangladesh has been
ongoing since 1990 (de Pee et al, 2002).
Whether the findings from the present
study in Indonesia can be generalized to other
countries in Southeast Asia or elsewhere in
developing countries will need further investi-
gation. The strength of the present study was
that it was a population-based sample of over
a quarter of a million children in rural Indone-
sia. There are important implications, since
Indonesia is the largest country in Southeast
Asia with a total population over 220 million
and over 21 million children under age five
years (UNICEF, 2006).
Achieving the Millenium Development
Goals of increasing child survival will depend
upon delivering effective and sustainable in-
terventions for children who would benefit the
most. The Expanded Program on Immuniza-
tion is one of the strongest interventions to
improve child survival, and higher and more
equitable coverage will be needed. As recently
emphasized, “we must do better” to expand
coverage with existing interventions, as the
goal for reducing child survival will only be
achieved if public health can deliver (Bryce et
al, 2003).
ACKNOWLEDGEMENTS
This work was supported by a Lew R
Wasserman Merit Award from Research to
Prevent Blindness to Dr Semba.
REFERENCES
Basu AM, Stephenson R. Low levels of maternal
education and the proximate determinants of
childhood mortality: a little learning is not a
dangerous thing. Soc Sci Med 2005; 60:
2011-23.
Black RE, Morris SS, Bryce J. Where and why are
10 million children dying every year? Lancet
2003; 361: 2226-34.
Bryce J, el Arifeen S, Pariyo G, et al. Reducing child
mortality: can public health deliver? Lancet
2003; 362: 159-64.
Centers for Disease Control. Vaccine preventable
deaths and the Global Immunization Vision
and Strategy, 2006-2015. MMWR Morb Mor-
tal Wkly Rep 2006; 55: 511-5.
de Onis M. Child growth and development. In:
Semba RD, Bloem MW, eds. Nutrition and
health in developing countries. Totowa, NJ:
Humana Press, 2001: 71-91.
de Pee S, Bloem MW. Assessing and communicat-
ing impact of nutrition and health programs. In:
Semba RD, Bloem MW, eds. Nutrition and
health in developing countries. Totowa, NJ:
CHILDREN MISSED BY IMMUNIZATION PROGRAMS
Vol 38 No. 1 January 2007 129
Humana Press, 2001: 483-506.
de Pee S, Bloem MW, Sari M, Kiess L, Yip R, Kosen
S. High prevalence of low hemoglobin concen-
tration among Indonesian infants aged 3-5
months is related to maternal anemia. J Nutr
2002; 132: 2115-21.
Dramaix M, Hennart P, Brasseur D, et al. Serum
albumin concentrations, arm circumference,
and oedema and subsequent risk of dying in
children in central Africa. BMJ 1993; 307: 710-
3.
Jones G, Steketee RW, Black RE, Bhutta ZA, Mor-
ris SS, Bellagio Child Survival Study Group.
How many child deaths can we prevent this
year? Lancet 2003; 362: 65-71.
Kim-Farley R, Soewarso TI, Karyadi A, Adhyatma M.
Assessing the impact of the Expanded
Programme on Immunization: the example of
Indonesia. Bull World Health Organ 1987; 65:
203-6.
Mason JB, Habicht JP, Tabatabai H, Valverde V.
Nutritional surveillance. Geneva: World Health
Organization, 1984.
Perry H, Weierbach R, Hossain I, Islam R. Child-
hood immunization coverage in zone 3 of
Dhaka City: the challenge of reaching impov-
erished households in urban Bangladesh. Bull
World Health Organ 1998; 76: 565-73.
Streatfield K, Singarimbun M, Diamond I. Maternal
education and child immunization. Demogra-
phy 1990; 27: 447-55.
United Nations Children’s Fund. The state of the
world’s children, 2006. New York: UNICEF,
2006.
Waters HR, Dougherty L, Tegang SP, et al. Cover-
age and costs of childhood immunizations in
Cameroon. Bull World Health Organ 2004; 82:
668-75.
World Health Organization. Nutritional anemia: re-
port of a WHO Scientific Group. Geneva:
World Health Organization, 1968.
World Health Organization. Indonesia EPI Fact
Sheet, 2004. [Cited 2006 Oct 7]. Available
from: URL: />LinkFiles/epi2004/Indonesia04.pdf] accessed
05/29/06
World Health Organization and United Nations
Children’s Fund. Global Immunization Vision
and Strategy, 2006-2015. Geneva: World
Health Organization and United Nations
Children’s Fund, 2005. [Cited 2006 Jul 7].
Available from: URL: />cines/GIVS/english/GIVS_Final_17Oct.pdf
World Medical Association. World Medical Associa-
tion Declaration of Helsinki: ethical principles
for medical research involving human sub-
jects. Bull World Health Organ 2001, 79: 373-
4.