Effectiveness of PRECEDE model for health education on changes and level of control of HbA1c, blood pressure, lipids, and body mass index in patients with type 2 diabetes mellitus docx
Bạn đang xem bản rút gọn của tài liệu. Xem và tải ngay bản đầy đủ của tài liệu tại đây (256.81 KB, 9 trang )
RESEARCH ARTICLE Open Access
Effectiveness of PRECEDE model for health
education on changes and level of control of
HbA1c, blood pressure, lipids, and body mass
index in patients with type 2 diabetes mellitus
Miguel A Salinero-Fort
1*†
, Enrique Carrillo-de Santa Pau
3†
, Francisco J Arrieta-Blanco
2
, Juan C Abanades-Herranz
3
,
Carmen Martín-Madrazo
3
, Berta Rodés-Soldevila
1
and Carmen de Burgos-Lunar
4
Abstract
Background: Individual health education is considered to be essential in the overall care of patients with type 2
diabetes (DM2), although there is some uncertainty regarding its metabolic control benefits. There have been very few
randomized studies on the effects of individual education on normal care in DM2 patients with a control group, and
none of these have assessed the long-term results. Therefore, this study aims to use this design to assess the effectiveness
of the PRECEDE (Predisposing, Reinforcing, Enabling, Causes in Educational Diagnosis, and Evaluation) education model in
the metabolic control and the reduction of cardiovascular risk factors, in patients with type 2 diabetes.
Methods: An open community effectiveness study was carried out in 8 urban community health centers in the
North-East Madrid Urban Area (Spain). Six hundred patients with DM2 were randomized in two groups: PRECEDE
or conventional model for health promotion education. The main outcome measures were glycated hemoglobin
A1c, body mass index (BMI), blood pressure, lipids and control criteria during the 2-year follow-up period.
Results: Glycated hemoglobin A1c and systolic blood pressure (SBP) levels decreased significantly in the PRECEDE
group (multivariate analysis of covariance, with baseline glycated hemoglobin A1c, SBP, and variables showing
statistically significant differences between groups at baseline visits). The decrease levels in diast olic blood pressure
(DBP), triglycerides and LDL cholesterol were nonsignificant. PRECEDE increased compliance in all control criteria,
except for LDL cholesterol. BMI did not change during the study in either of the two models analyzed.
Conclusions: PRECEDE health education model is a useful method in the overall treatment in patients with type 2
diabetes, which contributes to decrease glycated hemoglobin A1c and SBP levels and increase the compliance in
all the control criteri a, except for LDL cholesterol.
Trial registration number: ClinicalTrials.gov NCT01316367
Background
Type 2 diabetes mellitus (DM2) is one o f the chronic
diseases that have increased in prevalence and inci-
dence rates in recent years [1], and some authors con-
sider it as the epidemic of the 21st century [2]. It is
also associated with premature morbidity and
mortality [3,4] as well as with an increase in health-
care costs [5].
Individual health education is considered to be essen-
tial in the overall care of patients with DM2, although
there is some uncertainty regarding its metabolic control
benefits. The PRECEDE (Pr edisposing, Reinforcing,
Enabling, Causes in Educational Diagnosis, and Evalua-
tion) model developed by Green and Kreuter [6] is one
of the different educational models that focus on factors
influencing health-related behavior, based on the rela-
tionship between the health professional and the patient,
* Correspondence:
† Contributed equally
1
Fundación Investigación Biomédica. Hospital Carlos III. SERMAS. Madrid.
Spain
Full list of author information is available at the end of the article
Salinero-Fort et al. BMC Public Health 2011, 11:267
/>© 2011 Salinero-Fort et al; licensee BioMed Central Ltd. This is an Open Access article distributed u nder the terms of the Creative
Commons At tribution License (http://cre ativecommons.org/licenses/by/2.0), which permits unrestricted use, distribution, and
reproduction in any medium, provided the original w ork is properly cited.
and is particularly appropriate for application in chronic
diseases.
The efficiency of the PRECEDE model has been pro-
ven in different studies in the health enviroment, such
as improving care habits among asthmatic children and
improving medication adherence in patients with a
chronic disease [7,8]; however, it has rarely been used in
DM2.
There have been very few long-term studies, with ran-
domized controls, on the effects of individual education
in normal care in DM2 [9]. Therefore, the aim of this
study was to assess the effectiveness of the PRECEDE
education model on the changes in HbA1c, blood pres-
sure (BP), lipids, and body mass index (BMI) in patients
with DM2 over the long-term (2 years).
Methods
Patients
We conducted an open community effectiveness s tudy
in which 21 Primary Care Cent ers (PCC), in the North-
East Madrid Urban Area (Spain), were invited to partici-
pate; 13 refused, a nd 8 PCC were randomized in two
arms: Precede Health Promotion Education (PHPE) and
Conventional Health Promotion Education (CHPE). The
participants at each PCC were randomized by selection
from lists of patients with previously diagnosed DM2.
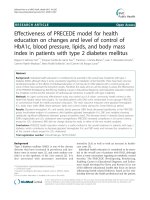
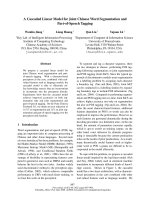
Figure 1 shows the patient recruitment process. The
research group was comprised of 33 persons: 30 nurses
(15 in each group) and 3 scientif ic researches (technical
group). A member of the clinical assistance team at
each PCC was appointed as liaison officer between the
PCC and the technical group. The study was approved
by the ethics committee of the Hospital Ramón y Cajal.
Eligibility criteria for patients were: older than 30 years,
with previously diagnosed DM2 (cardinal clinical, plus
random blood glucose >200 mg/dl or oral glucose of >200
mg/dl at 2 h, twice, or plasma fasting glucose of >126 mg/
dl on two occasions or being diagnosed previously,
received specific treatment for DM2) and the exclusion
criteria were: gestational diabetes, patients involved in clin-
ical trials, patients with life expectancy less than 1 year
(according to clinical judgment), pat ients who refused to
participate, homebound patients. Patients meeting criteria
for inclusion and not meeting any exclusion criteria were
invited to participate, and were included after acce pting
and signing an informed consent form.
Methods
Visits in both groups included the usual care and indivi-
dual counseling, based on t he CHPE or PHPE models,
respectively.
The CHPE model was defined according to the
recommendations of the Spanish Ministry of Health
National Conference on Diabetes Mellitus [10], which
was complemented by criteria for good care of the
Madrid Primary Healthc are Service for the promotion of
healthy lifestyles among adults (2004-2007). The model
was based on the following aspects: self-monitoring of
glycaemic control (patients were encouraged to monitor
their blood glucose levels, to record these val ues and
bring a record book to all subsequent appointments);
physical exercise (this involved initiation of an exercise
plan that could be incorporat ed into the patient’sdaily
schedule, after taking into consideration their level of
fitness, e.g. 1-h walk daily); diet (the patient was assisted
with the identification of dietary behaviour that
adversely influences blood glucose control, lipid levels,
weight management, and times of the day when the
patient was most vulnerable to overeating, and given
improved understanding of the relative effects of certain
food choices on blood glucose control); medication
adherence; and smoking cessation (patients were
encoura ged to stop smoking by advising them about the
danger of smoking to health, with emphasis on the
increased dangers of smoking in diabetic patients).
The PRECEDE HPE model is a diagnostic t ool beha-
vior and therefore the first step in its implementation is
to identify the behavior to be analyzed . The model con-
siders the influence of the following three factors on
health-related behavior:
-Predisposing: factors influencing the patient’s motiva-
tion to undertake the behavior to be analyzed or
encouraged.
-Facilitators: factors influencing the level of easiness or
difficulty the patient and his/her family have in under-
taking a given behavior.
-Reinforcing : fac tors arising after the pa tient has
undertaken the behavior, and which reward or punish it.
Nurses in the experimental group had to answer the
following question: What does the patient need to
change behavior? (increasing physical activ ity, reducing
the daily intake of bread, eat fewer times a day, medica-
tion adherence improvement, self-monitoring of blood
glucose, improving s kills for insulin treatment). After,
two behaviors were selected for each patient. The nurses
research-practitioners first lo oked at Predisp osing fac-
tors that influence the analyzed behavior. Patient’s
responses and comments were written in two parallel
lists: positive (+) and negative (-) factors in patients
behaviors that need improvement. Predisposing factors
are subjective (beliefs, opinions, values, thou ghts, knowl-
edge). Subsequently, factors that facilitate the studied
behavior were analy zed. These are objective factors such
as patient’ s skills or availability of resources. Finally,
subjective Reinforcing factors (what the patient says
after his/her behavior) and objectives (response to social
and family environment, physical, emotional, and eco-
nomic consequences).
Salinero-Fort et al. BMC Public Health 2011, 11:267
/>Page 2 of 9
Researchers in the experimental group received train-
ing in the PRECEDE model before patients were
included in the study. This specific training involved
two steps: first they were instructed about the basic, the-
oretical, and practical concepts involved in the applica-
tion of the model. Second, they participated in a course
on clinical interviews to improve their skills when deal-
ing with patients.
Researchers in both groups were subse quently trained
in the procedure to be used in the study in three ses-
sions. These covered the criteria for including/ excluding
patients, collecting variables, collecting biochemical/
21 Primary Care Centers (PCC)
[80 Nurses]
invited to participate
Patients Excluded (n=292)
i Not meeting inclusion criteria (n=118)
i Declined to participate (n=174)
i Too busy with work (n=59)
i Unspecified reason (n=102)
i Frequent Travel (n=13)
Randomization HPE by
PCC
(n=608 patients)
Allocated to PRECEDE HPE [15 Nurses from 5
PCC] (n=304 patients)
i Received allocated intervention (n=302)
i Did not receive allocated intervention (travel)
(
n=2
)
Allocated to Conventional HPE [15 Nurses
from 3 PCC] (n=304 patients)
i Received allocated intervention (n=303)
i Did not receive allocated intervention (travel)
(
n=1
)
Lost to follow-up (moved out of area) (n=1)
Discontinued intervention (died) (n=1)
Lost to follow-up (moved out of area) (n=1)
Discontinued intervention (died) (n=2)
Ǧ
Analysed (n=300)
i Excluded from analysis (n=0 )
Analysed (n=300)
i Excluded from analysis (n=0)
13 PCC refused to participate
8 PCC consented to participate
[30 Nurses; 1.600 patients with type 2 DM,
p
otentiall
y
eli
g
ible
]
Figure 1 Flow Diagram of participants. HPE: Health Promotion Education.
Salinero-Fort et al. BMC Public Health 2011, 11:267
/>Page 3 of 9
biologica l parameters, resolv ing doubts, and piloting the
data collection process with the first histories.
The study was carried out during a 2-year follow-up
period (2003-2005) and the number of visits was identi-
cal for both groups: 10 visits (0 and 1 at month 1, were
baseline visits; and 2 to 9, were follow-up visits, every 3
months).
Baseline data were collected during visits 0 and 1, and
during visits 2 to 9 assigned models were applied and
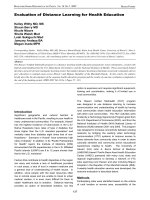
the data collected. The PRECEDE model application for
each behavior analyzed took 4 visits (sessions), as shown
in Figure 2. Nurses attended each patient with an aver-
age time of 40 minutes per session. Usual proceedings
took an extra 20 minutes. Each nurse attended an aver-
age of 20 patients during the follow-up period.
Thedatagatheredweresociodemographicvariables
(age, gender), hygienic and dietary habits, female meno-
pause, tobacco consumption (cigarettes/day), alcohol
consumption (alcohol units/week), physical activity prac-
tice (measured in hours per week considering any exer-
cise or activity outside the regular job), self-monitoring
of capillary glycemia, foot self-care, medication adher-
ence (was measured using Haynes-Sackett test [11]:
‘ Most patients have difficulty taking tablets. Do you
haveanydifficultytakingyours?’ whose response was
collected on a 5-point Likert scale (5, never; 4, seldom;
3, half of the time; 2, mostly; and 1, always. Values 4
and 5 were considered as medication adherence), asso-
ciated morbidity (arterial hypertension, dyslipidemia,
obesity, ischemic cardiopathies such as angina, acute
myocardial infarction (AMI), and cerebrovascular acci-
dent (CVA), diabetes mellitus complications (microvas-
cular, macrovascular, neuropathy), and the type of
treatment prescribed (pharmacological and dietary). In
follow-up visits data were collected on various biochem-
ical-biological parameters (BMI, systolic blood p ressure
(SBP), and diastolic blood pressure (DBP), total choles-
terol, high-density lipoprotein (HDL) cholesterol, low-
density lipoprotein (LDL) cholesterol, triglycerides, and
HbA1c). Blood pressure was measur ed according to the
recommendations of the SeventhReportoftheJoint
National Committee on Prevention, Detection, Evalua-
tion, and Treatment of High Blood Pressure (2003) [12].
The primary outcome was HbA1c, lipid levels, blood
pressure, BMI after 24 months of follow-up.
Sample size
For an alpha of 0.05, a power of 80%, and in order to
detect an reduction of HbA1c of 0.3 percentage units,
with a common standard deviation (SD) of 1.15, in the
PRECEDE group, the overall sample size r equired was
462 patients (231 in each arm of the study). Since ran-
domization was by PCC, the sample size had to be lar-
ger than if simple randomiza tion had been performed,
in order to consider the design effect (DE). The DE was
calculated as follows: DE = 1 + (nc - 1) * ICC (where nc
is the mean number of individuals in the cluster, and
ICC the intracluster correlation coefficient). The ICC in
the present work was deemed to be 0.01. The mean
cluster size was assumed to be 30 patients. Given these
assumptions, the final sample size required was 596
patients (298 in each arm).
Statistical analysis
First, a descriptive analysis was carried out for each vari-
able included in this study, involving the mean and SD
for the quantitative variables and frequencies with confi-
dence intervals of 95% (95% CI) for the qualitative
Session 3
(Visits 4 or 8)
Session 4
(Visits 5 or 9)
Session 2
(Visits 3 or 7)
Session 1
(Visits 2 or 6)
Identification of behaviors associated with better diabetes control to be analyzed; for
example, to increase physical activity
x Predisposing factors: the patient’s knowledge and beliefs about healthy
behaviors that wanted to assimilate
Final task: To create a list in favour and against to carry out the behavior
x
Enabling factors: Once the patient is motivated explore facilities that have to
carry out in the new behavior.
x
Skills and abilities
x
Factors that facilitate the carrying out of behavior
Final task: To create a list of skills and instruments in favour and against to the
behavior change
x Reinforcing factors: The patient has to discover: the response of key people in
their enviroment, the response of himself: pleased with the change, the physical
benefits, tangible rewards (economic, emotional, aesthetic).
Final task: To create a list of benefits and tangible rewards
x
Review of the three factors. To remind and reinforce the reasons, look for new
opportunities to facilitate adherence to healthy behaviors, and identify to reward
success.
Figure 2 Contents of the PRECEDE health promotion education model.
Salinero-Fort et al. BMC Public Health 2011, 11:267
/>Page 4 of 9
variables. The Student’ s t-test or its nonparametric
equivalent was used for paired data (Wilcoxon test).
Furthermore, Pearson c
2
test was used for the qualita-
tive variables, and McNemar’s test was used for paired
data.
The change (mean end - mean start valu e) was calcu-
lated in both diabetological education models, for the
following variables: total cholesterol, LDL cholesterol,
HDLcholesterol,HbA1c,SBP,andDBP.Theeffectof
the PRECEDE HPE was determined for th ese variables
using the formula: mean value of the change in HPE
PRECEDE - mean value of the change in conventional
HPE. The covariance analysis methodology (ANCOVA)
proposed by Vickers was used to determine the adjusted
effect of PRECEDE [13]. The adjustment variables were:
initial value and variables with statistically significant
difference between groups at baseline visits (adherence
to diet, adherence to medication, and type of treatment).
In all instances, the accepted level of significance was
0.05 or less, with 9 5% CI. All the analyses were carried
out using the intention-to-treat principle. Statistical ana-
lysis of the data was carried out with SPSS 15.0 (SPSS,
Inc., Chicago, Illinois).
Results
A total of 608 patients were included, of which 51.6%
were women, with a mean age of 66.7 years (SD: 14.5),
and a natural history of disease mean of 9.1 years (SD:
8.3). A tot al of 304 patients were assigned to the con-
ventional model and 304 to the PRECEDE model. The
two groups studied according to the type of health pro-
motion model were observed to be homogeneous in
terms of gender, age, and DM2 evolution time. The
baseline clinical characteristics of the two g roups, the
distribution of morbidity, and chro nic complications are
shown in Table 1.
The PRECEDE mode l led to a favorable variation in
all parameters studied, while the conventional model
group failed to achieve an improvement in HbA1c, tri-
glycerides, or SBP, which showed a slight increase
(Table 2).
The non-adjusted effect of PRECEDE on the change in
parameters was greater for HbA1c, triglycerides, DBP,
and SBP, and was only significant in SBP. After adjusted
analysis, the HbA1c levels decreased significantly
(-0.18%; p = 0.01) in the PRECED E model. Furthermore,
SBP decreased by 3 mmHg (p < 0.01), and the decrease
in DBP, triglycerides, and LDL cholesterol was nonsigni-
ficant. Furthermore, the total cholesterol remained
unchanged (Table 2).
TheBMIofthepatientsdidnotchangeduringthe
study in either of the two models analyzed, and the
adjusted effect of PRECEDE was close to zero (Table
2). In both models, the level of exercise decreased
slightly and was not significant (5 min/week in the
PRECEDE model and 22 min/week in the conventional
model).
However, the PRECEDE model was better than the
conventional model in percentage of subjects on-target
for cardiovascular risk factors, after 2 years of follow-up:
HbA1c <7% ( p < 0.01), metabolic control (HbA1c <7%
and LDL cholesterol <100 m g/dl) (p = 0.02), SBP <130
mmHg (p = 0.02), DBP <80 mmHg (p=0.01), BP con-
trol (<130/80 mmHg) (p < 0.01), and global control
(metabolic and BP) (p = 0.02). Nevertheless, it was not
significant for the criterion LDL <100 mg/dl and BMI
<25 Kg/m
2
(Table 3).
Discussion
There are currently very few studies on the efficacy of
the PRECEDE model in patients with DM2. The study
by Samaras et al [14], which aimed to increase physical
exercise and the level of metabolic control i n patients
with DM2, observed an increase of 0.86% in HbA1c
over 12 months in both the PRECEDE model and the
conventional model, in contrast to the improvement in
HbA1c levels observed in our study. The results of
Samaras et al [14] might be owing to the limited inter-
vention that lasted for 6 months and the PRECEDE
group s tarted with low levels of HbA1c (5.6%), leaving
little room for improvement.
The reduction in HbA1c levels observed in our study
is similar to that achieved by other health education
strategies. The systematic review carried out by Duke et
al [9] on the efficiency of individu al health education in
patients with DM2 showed a mean reduction in HbA1c
of -0.23% after 6-9 months and -0.08% between 12 and
18 months.
Furthermore, the meta-analysis by Norris et al [15],
which included eight clinical trials of self-management
education for adults with DM2, showed a decreased
HbA1c from baseline of -0.26% (95% CI -0,73 to
+0.21%) at 1-3 months follow up, and of -0.26% (95% CI
-0.05 to -0.48) at ≥ 4 months.
Finally, the DESMOND study [16] that assessed the
effectiveness of a stru ctured group educational program
in patients recently diagnosed with DM2 obtained a
nonsignificant adjusted result for the change in HbA1 c
of +0.05 after a follow-up period of 12 mon ths, which is
worse than that obtained in our s tudy. In addition, the
initial levels were worse than ours and the patients were
“naive” in terms of health education.
In different pharmacological intervention studies, a
decrease in HbA1c levels has shown a reduction in
microvas cular [17,18] and macrovascular [18] complica-
tions aft er long-term follow-up. These results as well as
those obtained in our study suggest that pharmacologi-
cal treatments need to be complemented with li festyle-
Salinero-Fort et al. BMC Public Health 2011, 11:267
/>Page 5 of 9
Table 1 Baseline characteristics of participants by HPE Assignment.
PRECEDE
n=300
CONTROL
n=300
p value
Female gender % (95% CI) 53.8 (50.6-57) 49.3 (46.1-52.5) 0.27
Age (years) 66.06 (8) 67.28 (19) 0.3
DM duration (years) 8.80 (8) 9.49 (8) 0.29
Current Smoker % (95% CI) 9.5 (6.3-12.7) 15.1 (4.6-25.6) 0.36
No. of cigarettes/day 11.88 (10) 12.36 (9) 0.84
Alcohol/week (units) 3.11 (8) 5.08 (30) 0.27
Exercise (hours/week) 7.55 (4) 7.98 (5) 0.25
Self-control % (95% CI) 67.9 (62.8-73) 64.2 (58.8-69.6) 0.33
Self-management feet % (95% CI) 65.7 (60.5-70.9) 93.6 (90.8-96.4) <0.01
Compliance with diet % (95% CI) 55.7 (50.2-61.2) 74.2 (69.3-79.2) <0.01
Therapeutic compliance % (95% CI) Always/Almost always 81.3 (77-85.6) 93.9 (91.2-96.6) <0.01
Medication profile % (95% CI)
Diet 79.5 (75.1-83.9) 72.8 (67.8-77.8) 0.05
Sulfonylureas 42.3 (36.9-47.7) 44.5 (38.9-50.1) 0.58
Meglitinide 4.1 (1.9-6.3) 1.3 (0-2.6) 0.03
Biguanides 25.6 (20.8-30.4) 19.7 (15.2-24.2) 0.08
Thiazolidinediones 0.3 (0.3-0.9) 1 (0-2.1) 0.29
Alpha glucosidase inhibitors 11 (7.6-14.4) 9 (5.8-12.2) 0.41
Insulin 14.2 (10.4-18) 14.4 (10.4-18.4) 0.94
Diuretics 27.4 (22.5-32.3) 23.1 (18.3-27.9) 0.23
Beta blockers 12.9 (9.2-16.6) 9.7 (6.4-13.1) 0.22
ACE inhibitors 30.6 (25.5-35.7) 29.1 (24-34.2) 0.68
ARB 14.5 (10.6-18.4) 12.4 (8.7-16.1) 0.47
Hypolipidemic 35.3 (30.1-40.6) 30.4 (25.2-35.6) 0.2
Calcium antagonist 15.1% (11.2-19) 19.1 (14.7-23.6) 0.19
Antiplatelet 22.4 (17.8-27) 17.7 (13.4-22) 0.15
Anticoagulants 3.2 (1.3-5.1) 3.7 (1.6-5.8) 0.74
History of % (95% CI)
Hypertension 69.7 (64.6-74.7) 63.5 (58.1-69) 0.1
Dyslipidemia 48.7 (43.2-54.2) 44.8 (39.2-50.4) 0.33
CHD Angina 12.9 (9.2-16.6) 7 (4.1-9.9) 0.01
AMI 9.1 (5.9-12.3) 7 (4.1-9.9) 0.34
Stroke 3.2 (1.3-5.1) 6 (3.3-8.7) 0.1
Retinopathy 10.5 (7.1-13.9) 6.5 (3.7-9.3) 0.08
Nephropathy 5 (2.6-7.4) 4.1 (1.9-6.3) 0.6
Neuropathy 6 (3.4-8.6) 2.4 (0.7-4.1) 0.03
Biochemical and biological parameters
Total Cholesterol (mg/dl) 203 (33) 205 (33) 0.45
HDL Cholesterol (mg/dl) 51 (14) 47 (11) <0.01
LDL Cholesterol (mg/dl) 125 (29) 129 (28) 0.09
Triglycerides (mg/dl) 134 (70) 133 (76) 0.87
HbA1c (%) 7.05 (1.3) 7.36 (1.2) <0.01
Body Mass Index (Kg/m
2
) 29.58 (4.58) 30.54 (5.16) 0.02
Systolic Blood Pressure (mmHg) 137 (165 134 (15) 0.02
Diastolic Blood Pressure (mmHg) 80 (8) 77 (8) <0.01
Values are given as mean (SD) unless otherwise specified.
CI: Confidence Interval; ACE: Inhibitors of angiotensin converting enzyme; ARB: Inhibitors of the Renin Angiotensin II receptor; CHD: Coronary Heart Disease; AMI:
Acute myocardial infarction.
Salinero-Fort et al. BMC Public Health 2011, 11:267
/>Page 6 of 9
modifying strategies, such as the one proposed in t he
PRECEDE model.
The reduction in SBP obtained is observed to be
greater than that found in studies carried out by Hiss
et al [19], Ko et al [20], and Shibayama et al [21],
which were included in the meta-analysis carried out
by Duke et al [9]. In the latter study, the mean
adjusted reduction, when compared with the usual
management, was 1.86 mmHg, 12-18 months after the
beginning of indiv idual education. The decrease in our
SBP levels is found to be relevant, as highlighted in
the meta-analysis of 61 prospective and observational
studies involving a million adults, carried out by
Lewington et al [22]. The study showed a reduction of
7% in the risk of mortality owing to cardiovascular dis-
ease, and 10% in the risk of mortality owing to ictus
with every 2 mmHg decrease in SBP.
The slight decrease in the lipid profile of total choles-
terol, LDL cholesterol, triglycerides, and the slight
increase in HDL cholesterol are found to be consistent
with the findings observed previously by Samaras et al
[14] and Gary et al [23]. The latter, in which the PRE-
CEDE model was used to promote self-managem ent in
Afro-American DM2 patients, measured the effective-
ness of four healthcare interventions based on primary
healthcare and community services.
Table 2 Mean values (SD) and changes of basal and final parameters in both groups.
PRECEDE
(n: 300)
CONTROL
(n: 300)
Unadjusted PRECEDE effect
(95% CI)
Adjusted PRECEDE effect
(95% CI)
Total Cholesterol (mg/dl)
Basal 203 (33) 205 (33)
Final 194 (34) 194 (33)
Change -9.36 (33) -10.88 (31) 1.51 (-3.6 to 6.6) -0.10 (-4.8 to 4.56)
p value 0.67 0.88 0.56 0.97
LDL Cholesterol (mg/dl)
Basal 125 (29) 129 (28)
Final 118 (30) 122 (28)
Change -7.25 (30) -7.27 (28) 0.02 (-4.6 to 4.7) -2.64 (-6.9 to 1.6)
p value 0.1 0.11 0.99 0.22
HDL Cholesterol (mg/dl)
Basal 51 (14) 47 (11)
Final 52 (14) 51 (14)
Change 0.8 (13) 3.7 (8) -2.87 (-1.1 to -4.6) -1.70 (-3.3 to -0.1)
p value <0.01 0.51 <0.01 0.03
HbA1c (%)
Basal 7.05 (1.3) 7.36 (1.2)
Final 7.02 (1.2) 7.38 (1.1)
Change -0.03 (0.9) 0.04 (1) -0.07 (0.2 to 0.1) -0.18 (-0.3 to -0.04)
p value <0.01 <0.01 0.40 0.01
SBP (mmHg)
Basal 137 (15) 134 (15)
Final 133 (13) 135 (16)
Change -4.22 (14) 0.18 (16) -4.40 (-2 to -6.8) -3.09 (-1.1 to -5.1)
p value 0.05 0.08 <0.01 <0.01
DBP (mmHg)
Basal 80 (8) 77 (8)
Final 77 (8) 76 (8.7)
Change -2.76 (8.9) -0.75 (8.9) -2.01 (-0.6 to 3.4) -0.64 (-1.9 to 0.6)
p value <0.01 0.27 0.40 0.32
BMI (Kg/m2)
Basal 29,63 (4,50) 30,54 (5,16)
Final 29,58 (4,58) 30,43 (5,19)
Change -0,05 (1,53) -0,11 (1,58) 0,06 (0,30 a -0,19) -0,03 (-0,29 a 0,24)
p value 0,56 0,24 0,64 0,85
HbA1C: Glycated hemoglobin; SBP: Systolic blood pressure; DBP: Diastolic blood pressure; BMI: Body Mass Index.
Salinero-Fort et al. BMC Public Health 2011, 11:267
/>Page 7 of 9
The difficulty that we faced in reducing the BMI may
be partially explained by th e similarity in the time spent
on physical exercise in both groups, which did not
improve during the follow-up.
Furthermore, a difficulty in reducing the BMI was men-
tioned in the meta-an alysis by Boulé et al [24] and in
other studies [15]. Finally, the work carried out by Scain
et al [25], based on a group educational program focusing
on self-management, also showed no differences when
compared with normal care, although the BMI did
decrease significantly when compared with the baseline.
We found no randomized studies with a control
group, which evaluated the effect of educational models
on metabolic control objectives (HbA1c <7% and LDL
cholesterol <100), BP control (SBP <130 and DBP <80),
or overall c ontrol (metabolic and BP <130/80 mmHg),
indicating that our results cannot be compared.
However, on comparing the increase in the proportion
of patients with metabolic control in the PRECEDE model
obtained in our study with those of transversal studies car-
ried out in primary healthcare, such as the one by Spann
et al [26], we were able to find values that are similar, but
lower than those found by Jackson et al [27] in a transver-
sal study of 80,20 7 diabetic American veterans, of whom
38.9% achieved metabolic control, which can be partly
explained by LDL levels (LDL = 109 mg/dl) that are sub-
stantially lower than those observed in our study.
The increase obtained in the proportion of patients
with metabolic, blood pressure, and overall control after
the application of PRECEDE mo del is relevant and
suggests that there is a need to complement pharmaco-
logical treatments with lifestyle modification strategies
like the one proposed by the PRECEDE model.
The most important limitation of this work is the nature
of non-blind experimental studies, with the possibil ity of
bias during response measurement, as researchers know
which patients are members of the experimental group.
Although, this bias is improbable because measurement of
responses was objective, as it was based on results of ana-
lytical determinations. However, we believe that there
coul d have been a possi ble Hawthorne bias effect, wit h a
change in the behavior of the subjects owing to the knowl-
edge that they are being studied. This would have had the
same effect on both the groups, b ecause the follow-up of
the patients was stricter tha n normal in the two HPE
arms, and they were all well aware of their participation in
an experimental study when they signed the consent. A
virtue of the study was that there were few losses, indicat-
ing that there was no selection bias owing to selective
losses and that the analyses were carried out according to
the intention-to-treat principle.
Conclusions
As a result of all the above-mentioned factors, it can be
concluded that the PRECEDE health promotion model is
a useful method in the overall treatment of DM2 patients,
because it contributes to significant decrease in HbA1c
and SBP levels, as well as helps in increasing the comp li-
ance with all the control criteria, except for LDL choles-
terol. Our findings indicate that further studies are
Table 3 Percentage of Subjects On-Target for Cardiovascular Risk Factors at Baseline and at the End of the 24-Month
Study Period, stratified by HPE.
Target HPE Baseline (%) 24 Months (%) p value Change (%) p value
HbA1C (<7%) Control
PRECEDE
40.7
53.5
39
56
0.61
0.42
-1.7
+2.5
<0.01
LDL (<100 mg/dl) Control
PRECEDE
15.7
19.5
22
27
0.02
<0.01
+6.3
+7.5
0.55
Metabolic control
1
Control
PRECEDE
5.7
9.4
9
16.7
0.06
<0.01
+3.3
+7.1
0.02
BMI (<25 Kg/m
2
) Control
PRECEDE
12.7
12.3
12.5
12.3
0.90
1
-0.2
0
0.85
SBP (<130 mmHg) Control
PRECEDE
28.7
24.8
29.3
28
0.91
0.29
+0.6
+3.2
0.02
DBP (<80 mmHg) Control
PRECEDE
49
34
52.7
42.5
0.32
<0.01
+3.7
+8.5
0.01
BP control
2
Control
PRECEDE
21.3
15.4
21.7
18.9
1
0.21
+0.4
+3.3
<0.01
Global Control
3
Control
PRECEDE
0.7
1.9
1
4.4
1
0.06
+0.3
+2.5
0.02
1. HbA1c <7% and LDL cholesterol <100 mg/dl.
2. SBP <130 mmHg and DBP <80 mmHg.
3. Metabolic control and BP control.
HPE: Health Promotion Education; SBP: Systolic blood pressure; BMI: Body Mass Index; DBP: Diastolic blood pressure; BP: Blood pressure; HbA1C: Glycated
hemoglobin.
Salinero-Fort et al. BMC Public Health 2011, 11:267
/>Page 8 of 9
necessary to substantiate these benefits. If they are con-
firmed, then the impact of the PRECEDE model should be
evaluated in terms of cardiovascular morbimortality.
Acknowledgements
We thank the primary healthcare nurses who took part in this study (C
Rodriguez, M Torre, V López, MJ Iglesias, M Garrido, N Manzano, RM
Martínez, G Moreno, L Redondo, MJ Colino, MI Luis, MI Lorenzo, C Antelo, Y
Lozano, R González, A Quintano, P Rabadán, E Polo, B Álvarez, S de la Plaza,
M Camarero, J Garrido, Y Vázquez, I Parra, R Roda, C Lobo, MJ Casares, M
Rodríguez) and Inés Maria Barrio Cantalejo for technical assistance. Funding
for the study was supplied by the Instituto de la Salud Carlos III (PI02/0567).
Author details
1
Fundación Investigación Biomédica. Hospital Carlos III. SERMAS. Madrid.
Spain.
2
Unidad de Nutrición. Hospital Ramón y Cajal. SERMAS. Madrid. Spain.
3
Unidad de Formación e Investigación. Área 4 de Atención Primaria. Madrid.
Spain.
4
Unidad de Epidemiología Clínica. Hospital Carlos III. SERMAS. Madrid.
Spain.
Authors’ contributions
MASF conceived of the study and participated in its design and perfomed
the statistical analysis and drafted the manuscript. FJAB, JCAH, CBL drafted
the manuscript and made substantial contributions to the analysis and
interpretation. CMM participated in the design and coordinated the research
group. ECSP, BRS helped in the statistical analysis and drafted the
manuscript. All authors read and approved the final manuscript.
Competing interests
The authors declare that they have no competing interests.
Received: 5 August 2010 Accepted: 28 April 2011
Published: 28 April 2011
References
1. González EL, Johansson S, Wallander MA, Rodríguez LA: Trends in the
prevalence and incidence of diabetes in the UK: 1996-2005. J Epidemiol
Community Health 2009, 63:332-6.
2. Valdés S, Rojo-Martínez G, Soriguer F: Evolution of prevalence of type 2
diabetes in adult Spanish population. Med Clin (Barc) 2007, 129:352-5.
3. Roper NA, Bilous RW, Kelly WF, Unwin NC, Connoly VM: Excess mortality in
a population with diabetes and the impact of material deprivation:
longitudinal, population based study. BMJ 2001, 11:122-39.
4. Bianchi C, Miccoli R, Penno G, Del Prato S: Primary prevention of
cardiovascular disease in people with dysglycemia. Diabetes Care 2008,
31(suppl 2):S208-14.
5. American Diabetes Association: Economic costs of diabetes in the U.S. In
2007. Diabetes Care 2008, 31:596-615.
6. Green LW, Kreuter MW: Health Program Planning: An Educational and
Ecological Approach. 4 edition. New York: McGraw-Hill Higher Education;
2005.
7. Chiang LC, Huang JL, Lu CM: Educational diagnosis of self-management
behaviours of parents with asthmatic children by triangulation based on
PRECEDE-PROCEED model in Taiwan. Patient Education and Counselling
2003, 49:19-25.
8. Sjöström M, Karlsson AB, Kaati G, Yngve A, Green LW, Bygren LO: A four
week residential program for primary health care patients to control
obesity and related heart risk factors: effective application of principles
of learning and lifestyle change. Eur J Clin Nutr 1999, 53(Suppl 2):S72-7.
9. Duke SA, Colagiuri S, Colagiuri R: Individual patient education for people
with type 2 diabetes mellitus. Cochrane Database Syst Rev 2009, , 1:
CD005268.
10. Conferencia Nacional de Diabetes Mellitus: Ministerio de Sanidad y Consumo
Madrid 1994.
11. Haynes RB, Sackett DL, Snow JC, Sackett DL: Annotated and indexed
bibliography on compliance with therapeutic and preventive regimens.
In Compliance in health care. Edited by: Haynes RB, Taylor DW, Sackett DL.
Baltimore (MD): Johns Hopkins University Press; 1979:337-42.
12. Chobanian AV, Bakris GL, Black HR, Cushman WC, Green LA, Izzo JL,
Jones DW, Materson BJ, Oparil S, Wright JT Jr, Roccella EJ, the National High
Blood Pressure Education Program Coordinating Committee: Seventh
Report of the Joint National Committee on Prevention, Detection,
Evaluation, and Treatment of High Blood Pressure. Hypertension 2003,
42:1206-52.
13. Vickers AJ, Altman DG: Analysing controlled trials with baseline and
follow up measurements. BMJ 2001, 323:1123-24.
14. Samaras K, Ashwell S, Mackintosh AM, Fleury AC, Campbell LV, Chisholm DJ:
Will older sedentary people with non-insulin-dependent diabetes
mellitus start exercising? A health promotion model. Diabetes Res Clin
Pract 1997, 37:121-8.
15. Norris SL, Lau J, Smith SJ, Schmid CH, Engelgau MM: Self-management
education for adults with type 2 diabetes: a meta-analysis of the effect
on glycemic control. Diabetes Care 2002, 25
:1159-71.
16. Davies MJ, Heller S, Skinner TC, Campbell MJ, Carey ME, Cradock S,
Dallosso HM, Daly H, Doherty Y, Eaton S, Fox C, Oliver L, Rantell K,
Rayman G, Khunti K, Diabetes Education and Self Management for Ongoing
and Newly Diagnosed Collaborative: Effectiveness of the diabetes
education and self management for ongoing and newly diagnosed
(DESMOND) programme for people with newly diagnosed type 2
diabetes: cluster randomised controlled trial. BMJ 2008, 336:491-5.
17. UK Prospective Diabetes Study (UKPDS) Group: Intensive blood-glucose
control with sulphonylureas or insulin compared with conventional
treatment and risk of complications in patients with type 2 diabetes
(UKPDS 33). Lancet 1998, 352:837-53.
18. The ADVANCE Collaborative Group: Intensive blood glucose control and
vascular outcomes in patients with type 2 diabetes. N Engl J Med 2008,
358:2560-72.
19. Hiss RG, Gillard ML, Armbruster BA, McClure LA: Comprehensive evaluation
of community-based diabetic patients: effect of feedback to patients
and their physicians: a randomized controlled trial. Diabetes Care 2001,
24:690-4.
20. Ko GT, Li JK, Kan EC, Lo MK: Effects of a structured health education
programme by a diabetic education nurse on cardiovascular risk factors
in Chinese Type 2 diabetic patients: a 1-year prospective randomized
study. Diabet Med 2004, 21:1274-9.
21. Shibayama T, Kobayashi K, Takano A, Kadowaki T, Kazuma K: Effectiveness
of lifestyle counseling by certified expert nurse of Japan for non-insulin-
treated diabetic outpatients: a 1-year randomized controlled trial.
Diabetes Res Clin Pract 2007, 76:265-8.
22. Lewington S, Clarke R, Qizilbash N, Peto R, Collins R: Age-specific relevance
of usual blood pressure to vascular mortality: a meta-analysis of
individual data for one million adults in 61 prospective studies. Lancet
2002, 360:1903-13.
23. Gary TL, Bone LR, Hill MN, Levine DM, McGuire M, Saudek C, Brancati FL:
Randomized controlled trial of the effects of nurse case manager and
community health worker interventions on risk factors for diabetes-
related complications in urban African Americans. Prev Med 2003,
37:23-32.
24. Boulé NG, Haddad E, Kenny GP, Wells GA, Sigal RJ: Effects of exercise on
glycemic control and body mass in type 2 diabetes mellitus: a meta-
analysis of controlled clinical trials. JAMA 2001, 286:1218-27.
25. Scain SF, Friedman R, Gross JL: A structured educational program
improves metabolic control in patients with type 2 diabetes: a
randomized controlled trial. Diabetes Educ 2009, 35:603-11.
26. Spann SJ, Nutting PA, Galliher JM, Peterson KA, Pavlik VN, Dickinson LM,
Volk RJ: Management of type 2 diabetes in the primary care setting: a
practice-based research network study. Ann Fam Med 2006, 4:23-31.
27. Jackson GL, Edelman D, Weinberger M: Simultaneous control of
intermediate diabetes outcomes among Veterans Affairs primary care
patients. J Gen Intern Med 2006, 21:1050-6.
Pre-publication history
The pre-publication history for this paper can be accessed here:
/>doi:10.1186/1471-2458-11-267
Cite this article as: Salinero-Fort et al.: Effectiveness of PRECEDE model
for health education on changes and level of control of HbA1c, blood
pressure, lipids, and body mass index in patients with type 2 diabetes
mellitus. BMC Public Health 2011 11:267.
Salinero-Fort et al. BMC Public Health 2011, 11:267
/>Page 9 of 9