Báo cáo khoa học: Enhancing the protein production levels in Escherichia coli with a strong promoter potx
Bạn đang xem bản rút gọn của tài liệu. Xem và tải ngay bản đầy đủ của tài liệu tại đây (229.54 KB, 11 trang )
Enhancing the protein production levels in Escherichia coli
with a strong promoter
Hanna Tegel, Jenny Ottosson and Sophia Hober
School of Biotechnology, Department of Proteomics, Royal Institute of Technology, AlbaNova University Center, Stockholm, Sweden
Introduction
Recombinant protein production in bacteria represents
a common strategy for obtaining large amounts of a
protein of interest. Although the use of Escherichia coli
has a long tradition in biotechnology, it is still not a
trivial task to determine the optimal production condi-
tions for all proteins. A system that is optimal for the
production of one protein might be nonfunctional for
another. Apart from the conditions of temperature
and induction, the choice of promoter, bacterial strain
and the solubility of the target protein are other
parameters that affect total protein production, as well
as the amount of soluble protein.
Commonly used promoters in E. coli include the T7
promoter, which originates from bacteriophage T7 [1]
and the E. coli lac promoter [2], as well as its modified
form lacUV5 [3]. The synthetic trc promoter [4],
derived from the E. coli trp and lacUV5 promoters, is
also commonly used. The strength of the different
promoters is determined by the relative frequency of
transcription initiation. This is mainly affected by the
affinity of the promoter sequence for RNA polymer-
ase. T7 RNA polymerase is very selective and efficient,
resulting both in a high frequency of transcription ini-
tiation and effective elongation. These features result
Keywords
Escherichia coli; promoter; protein
production; transcription; translation
Correspondence
S. Hober, School of Biotechnology, Division
of Proteomics, Royal Institute of
Technology, AlbaNova University Center,
106 91 Stockholm, Sweden
Fax: +46 8 55378481
Tel: +46 8 55378330
E-mail:
(Received 2 July 2010, revised 5 December
2010, accepted 10 December 2010)
doi:10.1111/j.1742-4658.2010.07991.x
In biotechnology, the use of Escherichia coli for recombinant protein pro-
duction has a long tradition, although the optimal production conditions
for certain proteins are still not evident. The most favorable conditions for
protein production vary with the gene product. Temperature and induction
conditions represent parameters that affect total protein production, as well
as the amount of soluble protein. Furthermore, the choice of promoter and
bacterial strain will have large effects on the production of the target pro-
tein. In the present study, the effects of three different promoters (T7, trc
and lacUV5) on E. coli production of target proteins with different charac-
teristics are presented. The total amount of target protein as well as the
amount of soluble protein were analyzed, demonstrating the benefits of
using a strong promoter such as T7. To understand the underlying causes,
transcription levels have been correlated with the total amount of target
protein and protein solubility in vitro has been correlated with the amount
of soluble protein that is produced. In addition, the effects of two different
E. coli strains, BL21(DE3) and Rosetta(DE3), on the expression pattern
were analyzed. It is concluded that the regulation of protein production is
a combination of the transcription and translation efficiencies. Other
important parameters include the nucleotide-sequence itself and the
solubility of the target protein.
Abbreviations
ABP, albumin binding protein; eGFP, enhanced green fluorescent protein; His
6
, hexahistidyl tag; PrESTs, protein epitope signature tags;
SD, Shine–Dalgarno.
FEBS Journal 278 (2011) 729–739 ª 2011 The Authors Journal compilation ª 2011 FEBS 729
in an RNA elongation that is approximately five-fold
faster than for E. coli RNA polymerase; hence, the T7
promoter is a much stronger promoter than the E. coli
promoters [5]. The T7 system is also very tightly regu-
lated as a result of the two-step process: the gene
encoding the T7 RNA polymerase that is able to bind
and start transcription from the T7 promoter (the Ø10
promoter from Bacteriophage T7) is positioned in the
E. coli genome and governed by the lacUV5 promoter
[1].
Another important criterion when choosing a suit-
able promoter, apart from strength, is the level of
basal transcription. A tightly regulated promoter has a
minimal level of basal transcription, which is particu-
larly important if the protein of interest is toxic or
harmful for the host cell [6]. A drawback to the trc
promoter is the high basal level of transcription [7]. To
further reduce the basal level of the T7 system, differ-
ent approaches could be used. For example, a lac
operator could be added downstream of the T7 pro-
moter region [8]. Another means of regulating the total
mRNA production is via the number of DNA-
copies ⁄ plasmids available for transcription. To direct
this, different origins of replication [7] are used.
The choice of bacterial strain also affects protein
production. An E. coli strain frequently used for rou-
tine protein production is BL21 [7]. To overcome
problems related to recombinant protein production,
this strain has been modified for different purposes.
Derivatives of BL21 include strains that decrease the
protease activity and enhance cytoplasmic disulfide
bond formation, as well as strains with a more efficient
protein folding [9]. One commonly used BL21 strain is
BL21(DE3). This strain has an insert on the chromo-
some encoding the T7 RNA polymerase controlled by
a lacUV5 promoter. This feature allows the use of the
T7 promoter. Another problem when producing
human proteins in E. coli relates to differences in
codon usage between the two organisms. This differ-
ence can lead to translational errors and reduced
production levels of recombinant protein [9]. To
overcome the codon bias, genes encoding rare tRNAs
can be co-expressed, as in the case of Rosetta(DE3)
(Novagen, Merck, Darmstadt, Germany).
The solubility of a protein is often of interest in pro-
tein science, especially in structural genomics where
soluble proteins are a requirement for obtaining infor-
mation about the 3D structure [10]. Several inherent
parameters affect the solubility of a protein, such as
folding velocity and hydrophobicity. When proteins
are produced, the synthesis rate of the protein may
affect the proportion of soluble protein. Previously, it
was reported that a decreased protein synthesis rate
(e.g. by using a weaker promoter) gives a higher yield
of soluble and correctly folded protein [7].
Great efforts have been made with respect to the
development of high throughput methods for the pro-
duction and purification of recombinantly produced
proteins. Different methods for cloning, production
and analyses have been developed [11–16]. Moreover,
purification tags, their positions in relation to the tar-
get protein and their effect on productivity and solubil-
ity have been evaluated [17]. In the present study, the
effects of three different promoters (T7, trc and
lacUV5) on E. coli production of target proteins with
different characteristics are presented. Protein frag-
ments fused to a hexahistidyl tag (His
6
) and an albu-
min binding protein (ABP) were produced, both alone
and fused to enhanced green fluorescent protein
(eGFP), under the control of the three different pro-
moters. The total amount of target protein as well as
the amount of soluble protein was analyzed, demon-
strating the benefits of using a strong promoter such
as T7. To understand the underlying causes, transcrip-
tion levels have been correlated with the total amount
of target protein and protein solubility in vitro has
been correlated with the amount of soluble protein
that is produced. In addition, the effects of two differ-
ent E. coli strains, BL21(DE3) and Rosetta(DE3), on
the expression pattern were analyzed.
Results
To investigate how different promoters affect protein
production and the solubility of the target protein, a
set of 16 protein epitope signature tags (PrESTs) was
chosen (Table 1 and Doc. S1). PrESTs are short
regions of human proteins with low similarity to all
other human proteins, without transmembrane regions
and signal peptides [18]. These protein tags are used
for immunization aiming to acquire antibodies directed
to the human full-length protein. Produced and
purified antibodies are used for annotation of the
human proteome (relevant data are available at:
http: ⁄⁄www.proteinatlas.org). The PrESTs were fused
with eGFP into vectors with three different promoters;
T7, trc and lacUV5 (Doc. S2). Upstream of the
PrEST, all proteins contained a His
6
-tag followed by
ABP. All constructs were transformed into E. coli
BL21(DE3) and fifteen of the constructs also into
E. coli Rosetta(DE3). Protein production in shake
flasks was performed to assess the different expression
patterns. It was not necessary to use BL21(DE3)-based
strains when proteins were produced under the control
of the trc and lacUV5 promoters because the main
purpose of the strain modifications was to create an
Protein production levels in E. coli H. Tegel et al.
730 FEBS Journal 278 (2011) 729–739 ª 2011 The Authors Journal compilation ª 2011 FEBS
inducible expression of T7 RNA polymerase. However,
to minimize the differences in behavior both during
cultivation and in the fluorescence activated cell sort-
ing measurements, the same strain was used for all
promoters. In addition to the direct induction of the
trc and lacUV5 promoters, expression of T7 RNA
polymerase is anticipated but, because T7 RNA poly-
merase by itself is not toxic to the E. coli cells and
only recognizes the T7 promoter, this should not inter-
fere with the transcription initiated by the trc and
lacUV5 promoters [1].
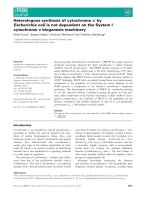
Analysis of the total amount of produced protein
For analysis of protein production, cells from the cul-
tures were disrupted and separated into a soluble and
an insoluble fraction by centrifugation. Both fractions
were analyzed by SDS ⁄ PAGE and western blotting
using quantityone software (Bio-Rad Laboratories,
Hercules, CA, USA) (Fig. 1A). The amount of target
protein was correlated with the amount of cells loaded
and to protein samples with a known concentration.
The relative amount of produced protein, normalized
according to cell density, is presented in Table 1. As
expected, the data show that protein production under
the control of the T7 promoter gives the largest total
amount of target protein, whereas lacUV5 gives the
lowest. A large difference between different proteins
produced under the control of the same promoter
could also be detected.
To determine whether the transcription rate is only
dependent on the three different promoters or whether
the transcription rate is also sequence-dependent, real-
time PCR was used to compare the number of mRNA
molecules before and after induction. Even more
importantly, the impact of mRNA levels on protein
production was investigated. Five His
6
-ABP-PrEST-
eGFP constructs (chosen to represent proteins with
different solubilities and production levels) under the
control of the three different promoters were produced
and samples were taken to determine the fold change
of mRNA caused by the induction. Figure 1B shows
that the fold change of mRNA after induction is corre-
lated with the amount of target protein that is pro-
duced. Again, all data were normalized according to
cell density. As seen in Fig. 1, the transcription levels
Table 1. Summary of the proteins, their characteristics and production levels in E. coli BL21(DE3). Proteins A–P correspond to the PrEST
part of the His
6
-ABP-PrEST-eGFP fusion protein. For the exact nucleotide and amino acid sequences of each PrEST, see Doc. S1. Solubility
class is defined as described in the Materials and methods, with group 1 as the most insoluble and group 5 as the most soluble. The sym-
bols shown are the same as those used in Figs 1 and 3. The amount of produced protein for 17 different fusion proteins under the control
of three different promoters is summarized. In addition, the amount of soluble target protein is shown. All values for the amount of protein
are adjusted to cell density and normalized to the highest production value (total amount for protein F under the control of the T7 promoter).
The fraction of soluble protein is shown on the right. The average error based on two separately cultured samples was 0.031 (T7), 0.011
(trc) and 0.084 · 10
)3
(lacUV5) for the total amount of protein; 0.0012 (T7), 0.00049 (trc) and 0.057 · 10
)3
(lacUV5) for the amount of soluble
protein; and 0.0075 (T7), 0.0034 (trc) and 0.027 (lacUV5) for the soluble fraction. NA, Not Applicable.
Protein
Accession
number
(Uniprot)
Gene
name
Solubility class
Symbol
Total (· 10
3
) Soluble (· 10
3
) Soluble fraction (%)
Without
eGFP
With
eGFP T7 trc lacUV5 T7 trc lacUV5 T7 trc lacUV5
A P00480 OTC 2 1
¤ 330 79 0.29 2.9 1.5 0.16 0.91 1.9 53
B P01033 TIMP1 3 3 j 3.6 0.46 0.43 0.21 0.10 0.26 6.2 23 65
C P78540 ARG2 1 2 NA 230 66 0.44 2.1 1.1 0.33 0.95 1.6 74
D B7Z3I5 EVL 5 3 NA 41 39 1.5 19 9.4 1.3 48 24 89
E P00441 SOD1 5 3 m 270 140 1.4 9.6 6.3 1.3 3.5 4.8 93
F B6ZDM2 C14orf135 1 2 NA 1000 340 1.2 8.6 3.2 0.83 0.85 0.95 72
G Q6PKC0 GMPR2 2 1 NA 280 72 0.20 3.2 1.9 0.15 1.1 2.6 76
H P10600 TGFB3 1 2 NA 290 55 0.46 5.2 1.7 0.41 1.8 2.9 87
I Q13023 AKAP6 1 3 NA 380 95 1.7 3.9 1.2 0.054 1.0 1.2 3.1
J Q99714 HSD17B10 3 3 – 470 160 0.81 4.5 1.4 0.64 1.0 0.90 79
K P00740 F9 4 2 NA 530 120 0.23 9.0 2.4 0.14 1.7 2.0 60
L P00740 F9 1 1 + 330 120 0.35 8.9 2.6 0.22 2.7 2.1 61
M Q9NSI8 SAMSN1 3 2 · 430 77 0.41 4.5 1.3 0.29 1.1 1.7 70
N P50990 CCT8 2 2 NA 390 88 0.30 3.1 1.0 0.21 0.80 1.1 70
O P01040 CSTA 5 3
• 640 210 1.5 9.4 4.4 1.3 1.5 2.1 89
P Q6ZNE5 KIAA0831 5 3 NA 390 110 0.48 14 4.6 0.40 3.7 4.0 83
Q His6ABP
eGFP
4 1 NA 660 160 1.8 51 15 1.6 7.7 9.5 91
H. Tegel et al. Protein production levels in E. coli
FEBS Journal 278 (2011) 729–739 ª 2011 The Authors Journal compilation ª 2011 FEBS 731
are dependent on the promoter used, and the relative
order of these appears as expected, with the lacUV5
promoter giving the lowest change of mRNA level and
the T7 promoter the highest. However, the differences
among the constructs including the T7 promoter are
larger than expected both with respect to changes in
mRNA levels and the correlation between the amount
of mRNA and protein. With respect to mRNA con-
centration, protein L under the control of the T7 pro-
moter showed a much higher fold change than the
other proteins. When repeated, the analyses resulted in
diverse data for this protein, although the average fold
change for protein L was clearly higher than for the
other proteins. One consideration worthy of note when
studying the result shown in Fig. 1B is the high level
of basal transcription (promoter leakage) caused by
the trc promoter. Because of this leakage, the analyzed
differences in mRNA levels most probably are a slight
misrepresentation of the total mRNA levels within the
cell at harvest.
One reason for the spread in the amount of protein
that is produced could be the number of rare codons,
which might stall the ribosome when translating the
mRNA to an amino acid sequence. Therefore, we also
analysed the codon composition of the different pro-
teins (Table 2). Both proteins J and O, which have a
higher relative amount of produced protein, have a
few rare codons, especially rare arginine codons.
Hence, the translation process in E. coli BL21(DE3) is
probably faster for these proteins than for proteins
containing a higher amount of rare codons.
Analysis of the amount of soluble produced
protein
Apart from the analyses aiming to determine whether
the total amount of produced protein is affected by
different promoters, the present study investigated how
different promoters affect the amount of soluble pro-
tein obtained. Therefore, the fraction of soluble pro-
tein was analyzed. Interestingly, the weakest promoter
generates the largest fraction of soluble protein and
vice versa and, generally, the fraction of soluble pro-
tein is very small when proteins are produced under
the control of T7 or trc (Table 1). However, three of
the proteins (B, D and I) differ from the rest regarding
these aspects. B and D both show a relatively large
fraction of soluble protein when produced under the
Insoluble fraction Soluble fraction
T7 trc lacUV5 T7 trc lacUV5
97.0
66.0
45.0
30.0
20.1
14.4
M1 M2
Target
protein
100
120
Fold change
Relative amount of produced protein
0
20
40
60
80
140
Relative amount of produced protein
0
2
4
6
8
10
12
14
Fold change
0.002 0.001 0.000 0.003
0.6 0.2 0.0 0.4 0.8 1.0 1.2
A
B
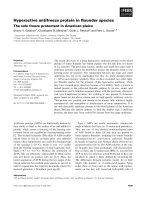
Fig. 1. Analysis of the total target protein production in E. coli
BL21(DE3), adjusted to cell density. The mean amount of produced
target protein was 6.6 mgÆ100 mL
)1
culture for T7;
2.3 mgÆ100 mL
)1
culture for trc; and 12 lgÆ100 mL
)1
culture for
lacUV5. For an explanation of protein symbols, see Table 1. (A) An
example of a representative SDS ⁄ PAGE for determination of pro-
tein production levels, western blotting (upper) and Coomassie
stain (lower) analysis. In each analysis, the insoluble and soluble
fractions of six cell samples were analyzed. For western blotting,
the insoluble T7 and trc fractions were diluted 1 : 1000 and the sol-
uble T7 and trc fractions were diluted 1 : 100. As a marker in the
western blotting, a protein of known concentration was used;
100 ng was loaded in the first marker lane and 10 ng in the second
marker lane. Low molecular weight markers were used to identify
protein sizes in the gel. The target protein is indicated by an arrow.
(B) The correlation between mRNA fold change and amount of pro-
duced protein, normalized to the highest value, for five proteins
under the control of the three promoters. The fold change was cal-
culated as the mean of three separate experiments in all cases but
one. For protein E under the control of lacUV5, an outlier by a fac-
tor of 7.8 was excluded. Light grey, black and grey represent the
T7, trc and lacUV5 promoters, respectively. Inset: magnification
showing data points representing the proteins that are produced
the under the control of the lacUV5 promoter.
Table 2. Summary of results from the codon analysis.
Protein
Number
of codons
Number
of rare
codons
Number of
AGG and
AGA codons
A 106 11 3
E 121 12 2
J 120 5 0
L 126 12 4
O80 70
Protein production levels in E. coli H. Tegel et al.
732 FEBS Journal 278 (2011) 729–739 ª 2011 The Authors Journal compilation ª 2011 FEBS
control of the stronger promoters. When the trc pro-
moter is used, these two proteins show equally large
fractions of soluble protein, whereas D is the only pro-
tein with a large soluble fraction under the control of
T7. On the other hand, protein I appears to be very
insoluble even under the control of lacUV5.
Although the fraction of soluble protein is very
interesting, it is still the amount of soluble protein that
is most important. Table 1 shows the relative amount
of soluble protein correlated with cell density. It is
clear that, even though lacUV5 gives the largest frac-
tion of soluble protein, T7 is the promoter that gives
the largest amount of soluble protein.
Impact of the solubility of the protein on the
amount of soluble produced protein
Because one aim of the present study was to assess
information about protein solubility during protein
production, the PrEST proteins used were chosen with
the aim of covering a large span of different protein
solubilities when produced as a fusion of His
6
-ABP-
PrEST. One method that we wanted to use for the
assessment of in vivo solubility was flow cytometric
analysis, which takes advantage of the solubility-
dependent fluorescence of GFP. Because eGFP was
fused to the C-terminus of the protein, it was of great
importance to determine whether eGFP affects the sol-
ubility of the different target proteins. The fusion pro-
teins were therefore produced with and without eGFP,
followed by immobilized metal ion affinity chromatog-
raphy purification to determine the solubility by using
an in vitro solubility test [19]. All proteins were graded
from 1 to 5. Class 1 constitutes the most insoluble pro-
teins and class 5 represents the most soluble proteins.
As shown in Table 1, eGFP generally decreases the
solubility of proteins belonging to classes with a high
solubility and increases the solubility of proteins
belonging to classes with a low solubility without
eGFP. In other words, eGFP appears to be a burden
for highly soluble proteins, whereas it can increase the
solubility of a poorly soluble protein.
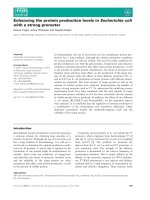
The correlation between the amount of soluble pro-
duced protein and in vitro solubility data was assessed
(Fig. 2). Data providing information about the amount
of soluble produced protein was obtained from the
SDS ⁄ PAGE and western blotting analyses and com-
pared with the data obtained when analyzing the same
protein in vitro. Because eGFP does affect the solubil-
ity, the solubility class used in this case is the one with
eGFP. As shown in Fig. 2, there is a slight positive
correlation between the relative amount of soluble
protein and solubility class in vitro. The proteins with
higher protein solubility class are more likely to yield a
higher amount of soluble protein. Interestingly, this
correlation is independent of the choice of promoter.
Comparison of protein production in E. coli
BL21(DE3) versus Rosetta(DE3)
Because the PrEST parts of the fusion proteins are
derived from the human genome and there is a codon
difference between human and E. coli, it is interesting
to determine whether the expression pattern differs
when the production is made in E. coli Rosetta(DE3),
a strain that, as a result of additional genetic informa-
tion, compensates for the tRNAs commonly used by
eukaryotes. Five of the fusion proteins, under the con-
trol of all three different promoters, were therefore
transformed into Rosetta(DE3) cells, produced and
analyzed. The total amount of produced protein was
analyzed and compared with the results obtained after
production in BL21(DE3) cells. As shown in Table 3,
the two strains give the same expression pattern when
comparing the different promoters with each other.
However, Rosetta(DE3) generates a larger amount of
produced protein irrespective of the promoter. In an
attempt to explain the increased production when
using Rosetta(DE3), the occurrence of rare codons
within each PrEST sequence was compared with the
amount of produced protein, although no obvious
correlation was found (data not shown).
The fraction of soluble protein after production in
Rosetta(DE3) was compared with the data obtained
with respect to production in BL21(DE3). As shown in
Table 3, independent of the strain, lacUV5 gives the
largest fraction of soluble protein; however, of even
more interest is a comparison of the amount of soluble
12345
Relative amount of soluble protein
Solubility class with eGFP
T7
trc
lacUV5
1.2
0.8
0.6
0.4
1.0
0.2
0.0
Fig. 2. The correlation between the relative amount of soluble
protein in E. coli BL21(DE3), normalized to the highest value, and
the in vitro solubility class with eGFP.
H. Tegel et al. Protein production levels in E. coli
FEBS Journal 278 (2011) 729–739 ª 2011 The Authors Journal compilation ª 2011 FEBS 733
protein after production in BL21(DE3) and Roset-
ta(DE3). From a comparison of the data provided in
Table 3, it is obvious that, even in this respect, it is
beneficial to use Rosetta(DE3) rather than BL21(DE3).
If the desired goal is the highest possible amount of
soluble protein, the strain Rosetta(DE3) is the best
choice. Possibly more interesting is the changed
expression pattern. As can be seen from Table 3, the
combination of the trc promoter and the Rosetta(DE3)
strain gives more soluble protein than T7 and
Rosetta(DE3) in three out of five cases.
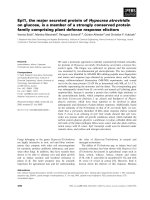
It was previously shown that the levels of soluble
protein can be determined, during protein production
in vivo, by using a flow cytometer. Proteins are fused to
the N-terminus of eGFP and the cells producing these
fusion proteins can then be analyzed [20]. This method
was used to further assess the production in
BL21(DE3) and Rosetta(DE3). Thus, after protein pro-
duction in the two different strains, the cells were ana-
lyzed by using a flow cytometer. The behavior in the
flow cytometer correlates well with the amount of solu-
ble protein (Fig. 3). Interestingly, the strain appears to
affect the signal achieved because two populations are
formed. Figure 3 clearly shows that the whole cell
fluorescence after production in BL21(DE3) is higher
than in Rosetta(DE3), although the amount of soluble
protein is similar. By using this alternative method, the
results shown in Table 3 could be confirmed. Roset-
ta(DE3) is favorable if soluble protein is desired.
Table 3. Summary of the production levels in E. coli BL21(DE3) and Rosetta(DE3) for five proteins under the control of the three promoters. All protein amount values are adjusted to cell
density. The data are based on the analysis of two separately cultured samples. Because of incomplete SDS ⁄ PAGE results, two values are based on a single cultured sample: protein A
under the control of lac UV5 and protein B under the control of trc, both produced in BL21(DE3). The amount of produced protein is normalized to the highest value [protein E under the
control of the T7 promoter produced in Rosetta(DE3)]. In addition, the amount of soluble target protein as well as the fraction of soluble protein is also shown.
Promoter T7 trc lacUV5
Protein Strain Total (· 10
3
)
Soluble
(· 10
3
)
Soluble
fraction (%) Total (· 10
3
)
Soluble
(· 10
3
)
Soluble
fraction (%) Total (· 10
3
)
Soluble
3
(· 10
3
)
Soluble
fraction (%)
A BL21(DE3) 240 ± 35 2.1 ± 0.27 0.91 ± 0.25 57 ± 3.2 1.1 ± 0.13 1.9 ± 0.12 0.21 0.11 53
Rosetta(DE3) 360 ± 200 6.3 ± 4.1 1.7 ± 0.21 150 ± 71 11 ± 3.8 7.6 ± 1.0 1.8 ± 0.24 0.33 ± 0.061 18 ± 1.0
B BL21(DE3) 2.6 ± 0.90 0.15 ± 0.021 6.2 ± 1.4 0.32 0.073 23 0.30 ± 0.10 0.18 ± 0.022 65 ± 14
Rosetta(DE3) 83 ± 14 1.6 ± 0.10 2.0 ± 0.47 52 ± 5.2 1.9 ± 0.013 3.8 ± 0.36 0.70 ± 0.034 0.20 ± 0.068 28 ± 8.3
E BL21(DE3) 190 ± 23 6.8 ± 0.77 3.5 ± 0.02 97 ± 11 4.5 ± 1.0 4.8 ± 1.6 0.98 ± 0.0086 0.92 ± 0.010 93 ± 0.16
Rosetta(DE3) 1000 ± 350 28 ± 3.5 3.0 ± 0.72 260 ± 11 16 ± 1.0 6.0 ± 0.15 0.88 ± 0.12 0.56 ± 0.022 65 ± 11
M BL21(DE3) 300 ± 62 3.2 ± 0.53 1.1 ± 0.045 55 ± 0.95 0.92 ± 0.28 1.7 ± 0.49 0.29 ± 0.053 0.20 ± 0.039 70 ± 0.61
Rosetta(DE3) 660 ± 64 8.4 ± 1.8 1.2 ± 0.15 380 ± 54 10 ± 0.40 2.8 ± 0.29 0.84 ± 0.011 0.42 ± 0.048 50 ± 5.1
O BL21(DE3) 450 ± 23 6.7 ± 1.1 1.5 ± 0.16 150 ± 23 3.1 ± 0.17 2.1 ± 0.19 1.1 ± 0.014 0.95 ± 0.031 89 ± 1.7
Rosetta(DE3) 730 ± 42 16 ± 3.0 2.2 ± 0.29 210 ± 29 5.2 ± 0.94 2.4 ± 0.11 0.79 ± 0.13 0.50 ± 0.017 65 ± 8.2
Relative whole cell fluorescence
Relative amount of soluble protein
0.7
0.6
0.5
0.4
0.3
0.2
0.1
0.0
0.6
0.4
0.2
0.0
0.8 1.0 1.2
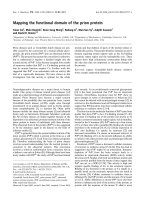
Fig. 3. Solubility analysis of eGFP fusion proteins. The correlation
between whole cell fluorescence and amount of soluble protein,
normalized to the highest value, for 30 cell samples. Five proteins
were produced under the control of three different promoters in
two bacterial strains: E. coli BL21(DE3) and Rosetta(DE3). The filled
data points represent the proteins that are produced in BL21(DE3)
and the unfilled data points represent the proteins that are pro-
duced in Rosetta(DE3). The data are based on measurements per-
formed with two separately cultured samples. The average error in
the fluorescence activated cell sorting analysis was 13%. Two pop-
ulations of different fluorescence, depending on the choice of
E. coli strain, are indicated by trend lines. For an explanation of the
different symbols used, see Table 1.
Protein production levels in E. coli H. Tegel et al.
734 FEBS Journal 278 (2011) 729–739 ª 2011 The Authors Journal compilation ª 2011 FEBS
In the flow cytometric analysis, the production in
BL21(DE3) of some additional samples was analyzed.
Except for three samples, they all showed the same
correlation as the BL21(DE3) population in Fig. 3.
The outliers all had a large amount of soluble protein
without showing any whole cell fluorescence. To deter-
mine whether this was caused by an inactive but solu-
ble eGFP, the eGFP activity of purified protein from
the soluble fraction was studied. The three outliers did
not show any eGFP activity, as was the case for the
positive control (data not shown). An additional evalu-
ation of the correlation between the amount of soluble
and insoluble protein achieved was performed for this
data set. A constant ratio was seen between the two
protein fractions for almost all proteins when using the
T7 and trc promoters, regardless of the strain used
(data not shown). Interestingly, there are two proteins
(A and E) that show a larger fraction of soluble pro-
tein than the other proteins when produced in Roset-
ta(DE3) under the control of the trc promoter. For
proteins produced under the control of lacUV5, the
amount of insoluble protein is generally low and an
increased protein production gives mostly soluble pro-
tein. In other words, lacUV5 has a larger fraction of
soluble protein, although, as an effect of the low total
production, the amount of soluble protein is much
lower than for T7 and trc.
Discussion
To further understand the effect of the promoter on
the acquired protein, 17 different proteins have been
produced under the control of three different promot-
ers. Because the final amount of protein achieved also
is dependent on other important features, such as
mRNA stability, transcription and translation efficien-
cies, and protein stability, a comparison of the total
amount of protein as well as the fraction of soluble
protein achieved with different promoters was ana-
lyzed for 17 different proteins with different character-
istics, pI and solubility. As expected, the data show
that a strong promoter is a benefit when a large
amount of protein is desired (Table 1). Noteworthy,
when comparing the mRNA level with the amount of
protein achieved, a high correlation between these
parameters could be seen (Fig. 1B). Hence, the weak
lacUV5 promoter shows a low fold change as well as
low protein production compared to the stronger pro-
moters, trc and T7, which both show higher values.
Interestingly, there are some proteins that do not fol-
low the expected pattern. A lower protein production
than expected could be an effect of poor mRNA
stability or proteolysis within the cell. However, to
minimize proteolytic effects, we limited the induction
time to 3 h [20]. Accordingly, the bacteria should not
experience any limitations with respect to oxygen sup-
ply or nutrition. Both proteins J and O show a larger
amount of produced protein under the control of the
T7 promoter than expected. This behavior could be
explained by these mRNA molecules being more effec-
tively translated as a result of having few rare codons,
especially a low number of the rare arginine codons
(Table 2). One way to compensate for differences in
codon usage is by co-expression of genes encoding
rare tRNAs; for example, by using the E. coli strain
Rosetta(DE3). When comparing the protein produc-
tion of five different proteins in E. coli BL21(DE3)
with the production in Rosetta(DE3), the Roset-
ta(DE3) strain generated a higher amount of protein
for all three promoters (Table 3). However, as in a
previous study carried out by Tegel et al. [21], the
benefit of using Rosetta(DE3) could not be explained
solely by the number of rare codons within the trans-
lated genes (data not shown). Also, the efficiency of
different tRNA synthetases and the 3D structure of
the translated mRNA may effect the translation effi-
cacy. These conclusions were also drawn by Welch
et al. [22]. Surprisingly, in three of five cases, the com-
bination of Rosetta(DE3) and the trc promoter gives
more soluble protein than does Rosetta(DE3) and the
T7 promoter (Table 3). However, in the other two
cases, the T7 promoter gave substantially larger
amounts of target protein.
With respect to translation, one parameter that is
even more important for overall translation efficiency
than codon usage is the efficiency of translation initia-
tion. This step is mainly influenced by features related
to the Shine–Dalgarno (SD) sequence, such as the
sequence itself, the length of the sequence and the dis-
tance between the SD sequence and the initiation
codon. Within the SD sequence used in the expression
vectors in the present study, some differences could be
observed. The most obvious differences are the
sequence itself and the sequence length. The SD
sequence in the T7 vector, AAGGAG, is longer than
the one used in the lacUV5 and trc vectors, AGGA
(Doc. S2). A study by Ringquist et al. [23] concluded
that the SD sequence UAAGGAGG initiates transla-
tion approximately four-fold more efficiently than
AAGGA. Comparing these sequences with the SD
sequences used in the present study, the translation
efficiency will most likely be higher for mRNA tran-
scribed from the T7 vector. In other words, the same
number of mRNA molecules could generate different
amounts of protein depending on the SD. However, in
the present study, the correlation between the fold
H. Tegel et al. Protein production levels in E. coli
FEBS Journal 278 (2011) 729–739 ª 2011 The Authors Journal compilation ª 2011 FEBS 735
change in mRNA levels and the amount of protein
indicates that the differences between the translation
efficiency for different SD sequences are rather small.
Moreover, if the leakage of the trc promoter is taken
into account, the final concentration of mRNA for this
vector is even higher, which indicates that the transla-
tion efficiency of the SD sequence included in the T7
promoter is no higher than for the other vectors. One
explanation for this could be that the T7-driven tran-
scription is uncoupled from translation and proceeds
several times faster than the ribosomes are able to fol-
low. Hence, the transcribed mRNA is not as efficiently
used for translation as those that exhibit a coupled
transcription ⁄ translation activity [24].
Depending on the final application of the produced
protein, the need for soluble protein differs. As shown
in Table 1, the largest fraction of soluble protein is
generated by lacUV5, which is the weakest promoter.
However, when it comes to the amount of soluble pro-
tein, the two stronger promoters are beneficial as a
result of higher total production. The T7 promoter
should therefore also be used when large amounts of
soluble protein are desired. The larger fraction of solu-
ble protein generated by lacUV5 is explained by the
weaker promoter giving a lower protein synthesis rate
as a result of less mRNA, and thereby each protein
has more time to fold correctly and form a soluble
protein before forming an insoluble protein precipitate
by colliding with other recently translated proteins.
Even though the majority of all proteins had a large
fraction of soluble protein under the control of
lacUV5, protein I was shown to be very insoluble
regardless of the promoter. By contrast, proteins B
and D appeared to be more soluble than the other
proteins when produced under the control of trc and
T7. One explanation for this might involve differences
in folding rate or the structural features of the trans-
lated protein. The differences in the fractions of solu-
ble protein achieved for the different proteins could, in
most cases, also be correlated with the solubility of the
protein itself.
Hedhammar et al. [20] has previously shown that
the levels of soluble protein within the cell could be
determined using a flow cytometer. In the present
study, we show that this correlation is highly depen-
dent on the strain used for protein production (Fig. 3).
In addition, there might be soluble proteins with inac-
tive eGFP resulting in misleading results. Moreover, it
has also been shown that GFP captured in inclusion
bodies also could contribute to the measured fluores-
cence [25]. However, the high correlation between fluo-
rescence and the amount of soluble protein shown in
the present study indicates that the main part of the
measured fluorescence originates from correctly folded
and soluble protein.
Finally, we conclude that the regulation of protein
production is a combination of the transcription and
translation efficiencies. Other important parameters
include the gene itself and the solubility of the protein.
A general recommendation, if a large amount of pro-
tein is needed, is to use the T7 promoter in combina-
tion with the Rosetta(DE3) strain. If the amount of
soluble protein is important, protein production should
be performed in Rosetta(DE3) cells under the control
of the T7 or trc promoter.
Materials and methods
Materials and strains
All recombinant work was performed in E. coli strain
RR1DM15 [26], essentially as described by Sambrook et al.
[27]. Oligonucleotides for cloning of the different constructs
were purchased from MWG-biotech AG (Edersberg, Ger-
many), whereas the oligonucleotides for real-time PCR were
purchased from Thermo Electron GmbH (Ulm, Germany).
Restriction enzymes were manufactured by New England
Biolabs (Ipswich, MA, USA) and ligase by Fermentas Life
Sciences (Vilnius, Lithuania). All enzymes were used in accor-
dance with the manufacturers’ instructions. To sequence ver-
ify the constructs, an ABI Prism 3700 DNA sequencer
(Applied Biosystems, Foster City, CA, USA) was used. Plas-
mids were purified using Qiaprep Spin Miniprep kit (Qiagen
GmbH, Hilden, Germany). Production of the fusion proteins
was performed in E. coli strain BL21(DE3) and E. coli strain
Rosetta(DE3) (co-expression of tRNA genes for AGG,
AGA, GGA, AUA, CUA and CCC) (Novagen).
Cloning
DNA sequences coding for the promoters lacUV5 and trc
were amplified by PCR from vectors including the relevant
genes. By using primers TEHA1: ACACAGATCTCTGCA-
GGGCACCCCAGGCTTTACA and TEHA2: ACACCC-
ATGGAGCTTTCCTGTGTGAAATTGT, lacUV5 was
amplified. TEHA3: ACACAGATCTCTGCAGTGAAATG-
AGCTGTTGACAATTA and TEHA4: ACACCCATGGT-
CTGTTTCCTGTG were used for trc amplification. The
exact nucleotide sequence of each promoter region is pro-
vided in Doc. S1. A common handle sequence introduced
the restriction sites for BglII and PstI upstream and NcoI
downstream of the promoters. The resulting PCR frag-
ments were digested with BglII and NcoI and ligated into
pAff8eGFP (with a pBR322-ori and encoding kanamycin
resistance) [20], cut with the same enzymes and thereby
replacing the sequence encoding the T7 promoter, using
solid-phase cloning [18]. The resulting vectors were
Protein production levels in E. coli H. Tegel et al.
736 FEBS Journal 278 (2011) 729–739 ª 2011 The Authors Journal compilation ª 2011 FEBS
sequence verified and named pAff8eGFPLacUV5 and
pAff8eGFPTrc, respectively.
The gene for the T7 promoter was amplified from the
vector pAff8eGFP using TEHA7: ACACCTGCAGCGAT-
CCCGCGAAATTAATAC and TEHA8: ACACCCATGG-
TATATCTCCTTCT, introducing restriction sites for PstI
upstream and NcoI downstream of the promoter. The PCR
fragment and pAff8eGFPTrc were digested with PstI and
NcoI before the PCR fragment was ligated into the cut vec-
tor using solid-phase cloning, replacing the trc with the T7
promoter. The resulting vector was sequence verified and
named pAff8eGFPT7.
Sixteen different PrESTs (Table 1) were PCR-amplified
from the pAff8cPrEST [18] plasmids using primers intro-
ducing an upstream NotI site and a downstream AscI site,
although without introducing a downstream stop codon.
The PCR products were digested with NotI and AscI and
ligated into pAff8eGFPT7, pAff8eGFPTrc and pAff8eG-
FPLacUV5 using solid-phase cloning, resulting in plasmids
encoding His
6
-ABP-PrEST-eGFP under the control of three
different promoters. All constructs were transformed into
E. coli strain BL21(DE3) and some of them also into
E. coli strain Rosetta(DE3).
Protein expression
One milliliter of overnight culture in tryptic soy broth
(Merck KGaA, Darmstadt, Germany), 30 gÆL
)1
, supple-
mented with 5 gÆL
)1
yeast extract (Merck KGaA, Darms-
tadt, Germany) and 50 lgÆmL
)1
kanamycin (Sigma-Aldrich,
Munich, Germany) was used to inoculate 100 mL of identi-
cal media in 1 L Erlenmeyer flasks. When using the E. coli
Rosetta(DE3) strain for protein production, 20 lgÆmL
)1
chl-
oramphenicol was also added to the culture media. The cul-
tures were incubated on shakers (150 r.p.m.) at 37 °C until
OD
600
of 0.5–0.8 was reached. Protein production was then
induced by addition of isopropyl thio-b-d-galactoside (App-
ollo Scientific Ltd, Stockport, UK) to a final concentration
of 1.0 mm. Incubation continued at 30 °C for 3 h. The cells
were harvested by centrifugation (2400 g for 8 min at 4 °C)
and the pellet was re-suspended in 30 mL of 1· PBS (20 mm
NaH
2
PO
4
,80mm Na
2
HPO
4
, 150 mm NaCl). At harvest,
the cell density varied between 3.9 (for T7) and 5.2 (for trc),
with a mean of 4.5.
Analysis of the total and soluble protein
production
SDS
⁄
PAGE and western blotting
To be able to fractionate the soluble and insoluble proteins,
the cells were disrupted by sonication at 60% duty cycle for
3 min with 1.0 s pulses (Vibra cellÔ; Sonics and Materials,
Inc., Danbury, CT, USA). The sonication level was evalu-
ated using viable count. One milliliter of the sonicated cells
was centrifuged for 10 min at 9500 g in a microcentrifuge
to separate the soluble from the insoluble proteins. The pel-
lets were then washed twice with 200 lLof1· NaCl ⁄ P
i
and
the washing solution was added to the soluble fraction. To
concentrate all soluble fractions, lyophilization (Automatic
Environmental SpeedVac system AES2010; ThermoSavant,
Holbrook, NY, USA) was used. Both soluble and insoluble
fractions were then diluted to the same volume and all frac-
tions were analyzed on Criterion Precast SDS ⁄ PAGE 10–
20% gradient gels (Bio-Rad Laboratories) and stained with
GelCode Blue Stain Reagent (Thermo Scientific, Rockford,
IL, USA) in accordance with the manufacturers’ instruc-
tions. The gels were destained with distilled water before
scanning at 400 d.p.i.
To be able to detect low producing proteins, all fractions
were also analyzed on western blots. After SDS ⁄ PAGE
separation, the proteins were electroblotted onto a
polyvinylidene fluoride membrane (Criterion Gel Blotting
Sandwiches; Bio-Rad Laboratories) in accordance with the
manufacturer’s instructions. The blotted proteins were
detected using a Ni-NTA horseradish peroxidase conjugate
(Qiagen GmbH) in combination with SuperSignal West
Dura extended duration substrate (Thermo Scientific) in a
ChemiDoc CCD camera (Bio-Rad Laboratories), all in
accordance with the respective manufacturers’ instructions.
All gels and western blots were evaluated using
quantityone 4.6.3 software (BioRad Laboratories). The
bands of the recombinant proteins, both soluble and insolu-
ble, were normalized against some of the soluble E. coli
house-keeping proteins that are produced equally in all cells.
Real-time RT-PCR
Samples were taken from the cultures before induction and
at harvest. The total RNA from the bacteria was purified
using RNeasy Protect Bacteria Mini Kit (Qiagen). Two sep-
arate cDNA synthesis reactions were performed for each
total RNA: synthesis of the reference gene (ribosomal
protein rpmE) and the target gene (eGFP) using reverse-
specific primers, rpmE_R: GGGATGTTGAAACGCTT
GTTG and GFP6_R: CGGTCACGAACTCCAGCAG,
respectively. The input of total RNA was 2 lg. A mixture
containing total RNA, dNTPs (Invitrogen, Carlsbad, CA,
USA) and 5 pmol of each reverse primer was denatured at
70 °C for 10 min and then cooled on ice for 2 min. Subse-
quently, 200 units of SuperScript III reverse transcriptase
(Invitrogen) were added and cDNA synthesis was per-
formed at 46 °C for 1 h. The enzyme was inactivated at
85 °C for 5 min. The total volume of the cDNA synthesis
reaction was 20 lL and contained 0.25 lm specific primer,
0.5 mm dNTP, 5 mm dithiothreitol (Invitrogen) and 1·
First-Strand Synthesis Buffer [50 mm Tris-HCl (pH 8.3),
75 mm KCl, 3 mm MgCl
2
; Invitrogen].
Real-time PCR was performed with an iCycler iQ 3.0
(Bio-Rad Laboratories) in 25 lL reactions containing
H. Tegel et al. Protein production levels in E. coli
FEBS Journal 278 (2011) 729–739 ª 2011 The Authors Journal compilation ª 2011 FEBS 737
12.5 lL of iQ SYBR Green Supermix (Bio-Rad Laborato-
ries), 5 lL of cDNA template and 5 pmol of reverse
(rpmE_R, GFP6_R) and forward (rpmE_F: AAGTGCCA-
CCCGTTCTTCAC, GFP6_F: GACAACCACTACCTGA-
GCAC) specific primers. PCR amplification was carried out
at 95 °C for 30 s followed by 35 annealing and extension
cycles (94 °C for 20 s, 62 °C for 30 s and 72 °C for 1 min).
After the amplification, a melt curve analysis was per-
formed by ramping the temperature from 60 °C to 100 °C.
The obtained C
T
values of the analysis were then deter-
mined using icycler Software (Optical System Software,
version 3.0a). The C
T
values were converted into the fold
change data using the 2
)DDC
T
method [28].
In vitro solubility assay
His
6
-ABP-PrEST proteins, with and without eGFP, were
purified by immobilized metal ion affinity chromatography
[29] using a fully automated purification set-up [30]. The
in vitro solubility of each recombinant protein was assessed
using a method developed by Stenvall et al. [19]. The con-
centration of all purified proteins was adjusted to
0.8 mgÆmL
)1
in 1 m urea. All samples were then diluted
five-fold in 1· NaCl ⁄ P
i
resulting in a final urea concentra-
tion of 0.2 m. Immediately after dilution, the initial protein
concentration was determined using the bicinchoninic acid
kit (Thermo Scientific). Thereafter, the samples were incu-
bated at 30 °C for 20 h. After incubation, the precipitated
proteins were separated from the soluble proteins by centri-
fugation at 2800 g followed by a second concentration
determination of the soluble fraction. The difference
between the two measurements corresponds to the amount
of precipitated protein. The proteins were classified from 1
to 5 depending on the degree of precipitation, where grade
1 was the least soluble (80–100% precipitation), followed
by grade 2 (60–80% precipitation), grade 3 (40–60% pre-
cipitation) and grade 4 (60–80% precipitation), with grade
5 being the most soluble (0–20% precipitation) [19].
Flow cytometric analysis
The flow cytometric analysis was performed on a FACS
Vantage SE stream-in-air flow cytometry instrument (BD
Biosciences, San Jose, CA, USA). To align the laser flow
cytometry alignment beads for 488 nm (Molecular Probes,
Leiden, The Netherlands) were used. Samples, containing
whole cells diluted 1 : 100 in 1· NaCl ⁄ P
i
, were illuminated
with an air-cooled argon ion laser (488 nm). The fluores-
cence from 10 000 cells was detected at a rate of approxi-
mately 500–750 eventsÆs
)1
via a 530 ± 15 nm (green) band
pass filter. The analytical flow cytometric histograms were
recorded using standard procedures. cellquestpro
software (BD Biosciences) was used to analyze the flow
cytometric data. E. coli BL21(DE3) cells producing
His
6
-ABP-eGFP and His
6
-ABP-SOD1 under the control of
the T7 promoter were used as positive and negative
controls, respectively, in each analysis. The relative fluores-
cence for each construct was normalized with the two
controls [20].
Acknowledgements
The authors would like to thank Dr C. Agaton, Dr
M. Hedhammar, Mrs C. Asplund and Dr J. Steen for
fruitful discussions and technical assistance. The authors
would also like to thank the referees for their construc-
tive comments that helped to improve the manuscript.
This work was financially supported by grants from the
Knut and Alice Wallenberg Foundation.
References
1 Studier FW & Moffatt BA (1986) Use of bacteriophage
T7 RNA polymerase to direct selective high-level
expression of cloned genes. J Mol Biol 189, 113–130.
2 Gronenborn B (1976) Overproduction of phage lambda
repressor under control of the lac promotor of
Escherichia coli. Mol Gen Genet 148, 243–250.
3 Wanner BL, Kodaira R & Neidhardt FC (1977)
Physiological regulation of a decontrolled lac operon.
J Bacteriol 130, 212–222.
4 Brosius J, Erfle M & Storella J (1985) Spacing of the –
10 and –35 regions in the tac promoter. Effect on its in
vivo activity. J Biol Chem 260, 3539–3541.
5 Golomb M & Chamberlin M (1974) Characterization of
T7-specific ribonucleic acid polymerase. IV. Resolution
of the major in vitro transcripts by gel electrophoresis.
J Biol Chem 249, 2858–2863.
6 Hannig G & Makrides SC (1998) Strategies for optimiz-
ing heterologous protein expression in Escherichia coli.
Trends Biotechnol 16, 54–60.
7 Terpe K (2006) Overview of bacterial expression
systems for heterologous protein production: from
molecular and biochemical fundamentals to
commercial systems. Appl Microbiol Biotechnol 72,
211–222.
8 Dubendorff JW & Studier FW (1991) Controlling basal
expression in an inducible T7 expression system by
blocking the target T7 promoter with lac repressor.
J Mol Biol 219, 45–59.
9 Sorensen HP & Mortensen KK (2005) Advanced
genetic strategies for recombinant protein expression in
Escherichia coli. J Biotechnol 115, 113–128.
10 Pedelacq JD, Piltch E, Liong EC, Berendzen J, Kim CY,
Rho BS, Park MS, Terwilliger TC & Waldo GS (2002)
Engineering soluble proteins for structural genomics.
Nat Biotechnol 20, 927–932.
11 Alzari PM, Berglund H, Berrow NS, Blagova E,
Busso D, Cambillau C, Campanacci V, Christodoulou E,
Protein production levels in E. coli H. Tegel et al.
738 FEBS Journal 278 (2011) 729–739 ª 2011 The Authors Journal compilation ª 2011 FEBS
Eiler S, Fogg MJ et al. (2006) Implementation of
semi-automated cloning and prokaryotic expression
screening: the impact of SPINE. Acta Crystallogr D Biol
Crystallogr 62, 1103–1113.
12 Graslund S, Nordlund P, Weigelt J, H allberg BM, Bray J,
Gileadi O, Knapp S, Oppermann U, Arrowsmith C,
Hui R et al. (2008) Protein production and purification.
Nat Methods 5, 135–146.
13 Graslund S, Sagemark J, Berglund H, Dahlgren LG,
Flores A, Hammarstrom M, Johansson I, Kotenyova T,
Nilsson M, Nordlund P et al. (2008) The use of
systematic N- and C-terminal deletions to promote pro-
duction and structural studies of recombinant proteins.
Protein Expr Purif 58 , 210–221.
14 Savitsky P, Bray J, Cooper CD, Marsden BD,
Mahajan P, Burgess-Brown NA & Gileadi O (2010)
High-throughput production of human proteins for
crystallization: the SGC experience. J Struct Biol 172,
3–13.
15 Cornvik T, Dahlroth SL, Magnusdottir A, Flodin S,
Engvall B, Lieu V, Ekberg M & Nordlund P (2006) An
efficient and generic strategy for producing soluble
human proteins and domains in E. coli by screening
construct libraries. Proteins 65, 266–273.
16 Cornvik T, Dahlroth SL, Magnusdottir A, Herman MD,
Knaust R, Ekberg M & Nordlund P (2005) Colony
filtration blot: a new screening method for soluble
protein expression in Escherichia coli. Nat Methods 2,
507–509.
17 Hammarstrom M, Woestenenk EA, Hellgren N,
Hard T & Berglund H (2006) Effect of N-terminal
solubility enhancing fusion proteins on yield of purified
target protein. J Struct Funct Genomics 7, 1–14.
18 Agaton C, Galli J, Hoiden Guthenberg I, Janzon L,
Hansson M, Asplund A, Brundell E, Lindberg S,
Ruthberg I, Wester K et al. (2003) Affinity proteomics
for systematic protein profiling of chromosome 21 gene
products in human tissues. Mol Cell Proteomics 2,
405–414.
19 Stenvall M, Steen J, Uhlen M, Hober S & Ottosson J
(2005) High-throughput solubility assay for purified
recombinant protein immunogens. Biochim Biophys
Acta 1752, 6–10.
20 Hedhammar M, Stenvall M, Lonneborg R, Nord O,
Sjolin O, Brismar H, Uhlen M, Ottosson J & Hober S
(2005) A novel flow cytometry-based method for
analysis of expression levels in Escherichia coli, giving
information about precipitated and soluble protein.
J Biotechnol 119, 133–146.
21 Tegel H, Tourle S, Ottosson J & Persson A (2010)
Increased levels of recombinant human proteins with
the Escherichia coli strain Rosetta(DE3). Protein Expr
Purif 69, 159–167.
22 Welch M, Govindarajan S, Ness JE, Villalobos A,
Gurney A, Minshull J & Gustafsson C (2009) Design
parameters to control synthetic gene expression in
Escherichia coli. PLoS ONE 4, e7002.
23 Ringquist S, Shinedling S, Barrick D, Green L,
Binkley J, Stormo GD & Gold L (1992) Translation
initiation in Escherichia coli: sequences within the
ribosome-binding site. Mol Microbiol 6, 1219–1229.
24 Mattanovich D, Weik R, Thim S, Kramer W, Bayer K
& Katinger H (1996) Optimization of recombinant gene
expression in Escherichia coli
. Ann NY Acad Sci 782,
182–190.
25 Garcia-Fruitos E, Martinez-Alonso M, Gonzalez-
Montalban N, Valli M, Mattanovich D & Villaverde A
(2007) Divergent genetic control of protein solubility
and conformational quality in Escherichia coli. J Mol
Biol 374, 195–205.
26 Ruther U (1982) pUR 250 allows rapid chemical
sequencing of both DNA strands of its inserts. Nucleic
Acids Res 10, 5765–5772.
27 Sambrook J, Fritsch EF & Maniatis T (1989) Molecular
Cloning: A Laboratory Manual. Cold Spring Harbor
Laboratory Press, New York.
28 Livak KJ & Schmittgen TD (2001) Analysis of relative
gene expression data using real-time quantitative PCR
and the 2(–Delta Delta C(T)) method. Methods 25,
402–408.
29 Porath J, Carlsson J, Olsson I & Belfrage G (1975)
Metal chelate affinity chromatography, a new approach
to protein fractionation. Nature 258, 598–599.
30 Steen J, Uhlen M, Hober S & Ottosson J (2006)
High-throughput protein purification using an auto-
mated set-up for high-yield affinity chromatography.
Protein Expr Purif 46, 173–178.
Supporting information
The following supplementary material is available:
Doc. S1. Nucleotide and amino acid sequence of each
PrEST part of the His6-ABP-PrEST-eGFP fusion pro-
teins (A–P).
Doc. S2. Nucleotide sequences of the T7, trc and
lacUV5 promoters.
This supplementary material can be found in the
online version of this article.
Please note: As a service to our authors and readers,
this journal provides supporting information supplied
by the authors. Such materials are peer-reviewed and
may be re-organized for online delivery, but are not
copy-edited or typeset. Technical support issues arising
from supporting information (other than missing files)
should be addressed to the authors.
H. Tegel et al. Protein production levels in E. coli
FEBS Journal 278 (2011) 729–739 ª 2011 The Authors Journal compilation ª 2011 FEBS 739