Global Economic Research - Global Forecast Update potx
Bạn đang xem bản rút gọn của tài liệu. Xem và tải ngay bản đầy đủ của tài liệu tại đây (257.05 KB, 8 trang )
Global Economic Research
Global Forecast Update is available on: www.scotiabank.com, Bloomberg at SCOE and Reuters at SM1C
Global Forecast Update
New Year Wish List — More Growth
We expect that global growth will build momentum, albeit gradually, over the
next two years. The Federal Reserve has introduced another and significant
round of non-conventional monetary accommodation that, along with the
winding down of household deleveraging in the U.S., will help support
increased spending, homebuilding and risk-taking at a time of increased
federal fiscal restraint. The central banks in the euro zone, the U.K. and
Japan will provide more support as needed.
Many of the larger developing nations have already implemented additional
monetary and fiscal stimulus to maintain comparatively stronger growth
trajectories in the absence of more robust conditions in the developed
economies. These countries and regions have the financial and institutional
capabilities to rebalance towards more domestically generated growth.
In particular, increased infrastructure spending will underpin demand
for most commodities and keep prices at profitable levels.
However, global growth remains comparatively soft and uneven
heading into the New Year. The developed nations are still stuck in the
slow lane of activity. Economic performances range from recession
through much of Europe, to minimal growth in Japan and only
moderate advances in Canada and the U.S. in 2013.
The pace of growth in the developing countries is comparatively firmer.
While activity is still relatively sluggish in Brazil, it is generally good in
Mexico, India and South Korea, and relatively solid in most of the other
major Latin American and Asia-Pacific nations. Recent evidence
suggests that China's economy is regaining momentum in response to
renewed stimulus and improved domestic spending.
A number of developed economies are implementing the medium-term
structural adjustments needed to reduce major budget shortfalls,
restore domestic competitiveness, and regulate financial institutions.
With inflation pressures mostly absent, short-term borrowing costs will remain at rock bottom levels. Yields on
longer-dated securities are expected to begin trending modestly higher from historically low levels in 2013
against the backdrop of ongoing sovereign credit differentiation, a renewed strengthening in economic activity,
and an eventual upward drift in inflation expectations.
In an environment where the major developed economies are underperformers, are savings-deficient, and have
lower interest rates, their currencies will tend to have a weakening bias against many of the developing economies.
The yen and euro are likely to underperform widely; whereas the U.S. dollar is expected to underperform the
Canadian and Australian dollars as well as the Scandinavian currencies, mainly on relative fiscal fundamentals,
monetary policy and selective commodity price strength.
Many of the developed economies undergoing a multi-year period of fiscal and economic restructuring will need
more time to regenerate stronger growth in the absence of much stronger domestic-led growth in the Asia-
Pacific and Latin American regions that would re-invigorate international trade. The U.S. economy has the
potential to be a relative outperformer in 2013 and 2014, especially if a credible medium-term fiscal
consolidation plan engenders confidence. U.S. households and financial institutions have refurbished their
balance sheets, export competitiveness has been enhanced by low currency-adjusted unit labour costs, overall
activity is finding support from expanding energy production and comparatively low and stable prices, and there
is considerable consumer and business pent-up demand, particularly for housing and other big-ticket items.
Index
Overview
Forecasts
International
Commodities
North America
Provincial
Financial Markets
December 20, 2012
1-2
3-4
4
5
6
7-8
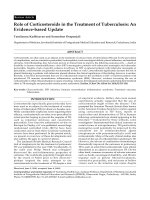
-1
0
1
2
3
4
5
6
00 02 04 06 08 10 12 14
annual % change
Scotiabank forecast
Average:
1980-
2011
World GDP
Source: IMF, Scotiabank Economics.
2
Global Economic Research
December 20, 2012
Global Forecast
Update
Canada's economy will lag the U.S. in performance in 2013. Housing activity is moderating, and Canadians are becoming more
cautious borrowers. Export earnings are continuing to be pressured by reduced prices for a number of key commodity exports,
and the lack of adequate oil pipeline infrastructure between Canada and key export markets. However, longer-term prospects
are still quite favourable, with ongoing investments to further develop the country's large and varied resource base,
internationally competitive business tax rates, ongoing capital and immigration inflows, and a relatively lower government debt
burden helping to provide a more supportive environment.
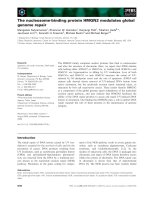
The impending fiscal cliff, as intended, has spurred some compromises; it
also has demonstrated the steep challenges for the U.S. political system
to undertake the multi-faceted, multi-year reforms necessary to place
American governments on a more sustainable fiscal path.
Public debate over taxes for high-income residents has largely precluded
substantive discussion of the other measures required to narrow the
federal revenue-expenditure gap in order to regain some fiscal flexibility
(side charts).
Entering 2013, at least “a patch” is still possible to deal with the most
urgent issues, such as extending the Bush personal income tax rates with
a compromise on the top bracket. A credible commitment to develop a
comprehensive tax reform package in 2013 would be encouraging, yet it
will prolong some of the uncertainty. Spending and investment decisions
by households and businesses will remain constrained until outstanding
issues are decided, such as allowed depreciation and capital gains and
dividend taxation.
The U.S. Treasury’s use of a range of extraordinary measures after the
statutory debt ceiling is broached could allow a decision on raising the
debt ceiling to be deferred until late February or early March given factors
such as some leeway in the timing of personal income tax refunds. By
then, a rise in the debt ceiling of at least US$1 trillion is required to take
Washington through another year, though staged hikes could be adopted
to reflect progress on spending restraint plans.
Positive indicators for U.S. economic growth, particularly in the housing
sector, are reflected in federal revenues, which are up about 9½% y/y for
the first two months of fiscal 2013, before potential tax hikes such as
ending the 2011-12 payroll tax reduction. Scotiabank Economics
continues to assume that the U.S. economy can sustain healthy forward
momentum with a partial implementation of the fiscal cliff restraint in
calendar 2013, amounting to a negative contribution of roughly one
percentage point to output growth. The remaining ‘cliff ‘ restraint would be
adopted in 2014 and 2015.
The Fall 2012 Fiscal Survey of States underlines the gradual reversal of the fiscal drag from this level of government
as fiscal 2013
1
general fund revenues surpass pre-recession levels in an increasing number of States. Specifics of
the federal restraint measures, such as limiting the deductibility of state and local taxes, could impact this recovery
and complicate the overhang of longer-term issues such as unfunded pension and retirement benefit liabilities.
For the Social Security, Medicare and Medicaid programs — the key drivers of widening budget shortfalls over the
longer term — the window of opportunity is narrowing to gradually implement comprehensive structural reforms
over a number of years, before substantial numbers of the baby-boom generation approach or surpass 65.
__________
1
The fiscal year-end for Washington is September 30 and for 46 States is June 30.
-12
-9
-6
-3
0
3
-1600
-1200
-800
-400
0
400
FY96 98 00 02 04 06 08 10 12
%
Budget Balance, LHS
% of GDP, RHS
US$ billions
10
12
14
16
18
20
22
24
26
FY96 00 04 08 12
% of GDP
Revenue
Expenditure
The Uncertainties Emerging From the Fiscal Cliff
… and the Revenue-Expenditure Gap
U.S. Federal Budget Balances
Source for charts: U.S. Office of Management
and Budget, Scotiabank Economics.
3
Global Economic Research
December 20, 2012
Global Forecast
Update
Forecast
Changes
International
The payback from an artificially
resilient third-quarter GDP
performance in the largest
economies of the euro area (i.e.,
Germany and France) is proving
sharper than anticipated in the
final months of 2012. The fourth
quarter will likely see pronounced
GDP contractions, with a negative
carry-over into the New Year. We
have adjusted lower our 2013
growth forecasts for Germany and
France, to 0.7% (previously 0.8%)
and 0.1% (0.3%), respectively.
Accordingly, we have trimmed our
euro zone GDP expectation for
next year to -0.1% (from 0.0%).
We continue to expect growth of
1.0% in 2014. Though crisis-
related tail risks have been
mollified in recent months by
central bank policy and Eurogroup
agreements on Greece and the
proposed banking union,
significant uncertainties continue
to threaten the medium-term
outlook, including pending
elections in Italy and Germany,
progress on fiscal consolidation
across the region, bank lending
rates (particularly in the
periphery), currency dynamics and
commodity prices. At present we
remain of the view that under this
scenario, and with inflation
expected to remain consistent with
price stability, the European
Central Bank will leave interest
rates unchanged through 2014.
After the disappointing third-
quarter GDP report in Brazil,
industrial output expanded by
2.3% y/y in October (the first
annual gain since September
2009), signaling a moderate
recovery. However, the recovery
in the manufacturing sector will
have to be confirmed in the
coming months. We maintain our
view that the Brazilian economy
will expand by 1.9% in the fourth
quarter and by 1.0% for all of
2012.
International
2000-11 2012f 2013f 2014f
Real GDP
(annual % change)
World (based on purchasing power parity) 3.7 3.1 3.2 3.8
Canada 2.2 2.0 1.7 2.3
United States 1.8 2.2 2.0 2.5
Mexico 2.2 4.0 3.6 3.9
United Kingdom 1.9 0.0 1.3 1.5
Euro zone 1.4 -0.5 -0.1 1.0
Germany 1.4 0.9 0.7 1.3
France 1.4 0.1 0.1 1.0
Italy 0.7 -2.2 -0.8 0.8
Spain 1.9 -1.4 -1.7 0.4
Greece 1.6 -6.6 -3.7 -0.8
Portugal 0.8 -3.4 -2.2 0.5
Ireland 3.3 0.0 0.9 2.0
Russia 5.3 3.7 3.7 3.9
China 9.4 7.7 8.0 8.3
India 7.3 5.5 6.0 6.5
Japan 0.8 2.1 0.8 1.2
South Korea 4.5 2.2 3.0 3.5
Indonesia 5.3 6.0 6.3 6.5
Australia 3.0 3.5 2.6 3.1
Thailand 4.0 5.5 4.0 4.2
Brazil 3.6 1.0 3.5 4.0
Colombia 4.5 4.5 5.0 4.8
Peru 5.6 6.3 6.0 5.5
Chile 4.8 5.4 5.0 5.4
Consumer Prices
(y/y % change, year-end)
Canada 2.1 1.4 2.1 2.2
United States 2.5 2.0 2.2 2.1
Mexico 4.8 4.0 4.0 3.8
United Kingdom 2.3 2.8 2.6 2.5
Euro zone 2.1 2.2 2.0 1.7
Germany 1.7 1.9 2.2 2.0
France 1.9 1.6 1.9 1.7
Italy 2.4 2.3 2.2 1.6
Spain 2.9 3.0 1.7 1.9
Greece 3.3 0.8 0.2 0.6
Portugal 2.6 2.6 0.8 1.5
Ireland 2.2 2.2 1.2 2.0
Russia 12.2 6.4 6.5 6.7
China 2.4 2.2 3.3 3.9
India 6.6 7.3 7.0 6.1
Japan -0.3 0.0 0.3 0.6
South Korea 3.2 1.7 2.8 3.0
Indonesia 8.3 4.1 5.0 5.5
Australia 3.1 2.5 2.8 3.0
Thailand 2.7 3.2 3.1 3.3
Brazil 6.6 5.5 5.8 5.0
Colombia 5.6 3.3 3.0 3.5
Peru 2.6 3.3 3.0 3.0
Chile 3.5 2.1 3.2 3.0
4
Global Economic Research
December 20, 2012
Global Forecast
Update
-2
0
2
4
6
8
10
China Canada U.S. Euro-
zone
2012f
2013f
2014f
Real GDP,
annual average % change
0
100
200
300
400
500
600
700
800
900
02 03 04 05 06 07 08 09 10 11 12
Index:2002Q1=100
Gold
Natural
Gas
WTI Oil
Copper
Nickel
Forecast
Changes
International
We have made a minor revision to
our expectation regarding China’s
monetary policy path. We now
assess that the People’s Bank of
China’s benchmark 1-year lending
rate has reached its cyclical
bottom at the current level of
6.0%, as China’s economic
outlook continues to improve with
real GDP, sentiment indicators,
industrial production, and retail
sales indicating that a revival,
albeit modest, is imminent. We
expect the Chinese economy to
expand by 8.0% in 2013.
Monetary tightening is in sight in
the first quarter of 2014, taking the
policy rate to 6.6% by the end of
the year.
Commodities
Scotiabank’s Commodity Price
Index fell by 8.4% yr/yr through
November 2012, led by declines in
oil & gas and metals & minerals.
However, forest products-based
building materials — lumber &
OSB — and agriculture were
pockets of strength.
Lumber and OSB are our top
investor ‘picks’ for 2013 —
expected to post a multiple-year
recovery through mid-decade.
With only a modest rebound in
U.S. housing activity, substantial
lumber & OSB mill closures
across North America since 2006
are quickly translating into a
tighter supply/ demand balance.
While financial institutions are still
holding a large number of homes
off the market, the supply of
‘existing homes for sale’ at
4.8 months in November was
approaching normal levels
(4.6 months from 2000-05).
Average home prices (including
condos) have increased by 9.9%
yr/yr. As a result, U.S. housing
starts have already rebounded to
861,000 units annualized (+22%
yr/yr) in November, up from a
mere 612,000 units in 2011. U.S.
housing starts should rise to
950,000 units in 2013 and
1.100 million in 2014. The
improvement in U.S. residential
construction is also occurring in an
environment of growing demand
from China.
Global Growth Commodity Price Trends
Source: Bloomberg, Scotiabank Economics.
Source: Scotiabank Economics. Bloomberg,
BEA, Statistics Canada, Eurostat.
International
2000-11 2012f 2013f 2014f
Current Account Balance
(% of GDP)
Canada 0.4 -3.9 -3.3 -2.5
United States -4.4 -3.0 -2.6 -2.6
Mexico -1.2 -1.0 -1.4 -1.8
United Kingdom -2.1 -3.2 -2.3 -1.8
Euro zone -0.2 0.3 0.4 0.5
Germany 3.9 5.6 5.3 5.1
France -0.2 -2.2 -1.9 -1.6
Italy -1.4 -1.9 -1.4 -1.1
Spain -5.7 -2.1 -1.0 -0.7
Greece -8.8 -6.1 -4.2 -3.2
Portugal -9.6 -2.5 -1.5 -1.1
Ireland -1.7 1.7 2.5 3.2
Russia 8.6 4.5 3.8 2.4
China 4.7 2.6 2.6 2.7
India -1.0 -4.4 -3.9 -3.6
Japan 3.2 1.1 1.2 1.5
South Korea 2.3 3.8 3.2 3.2
Indonesia 2.1 -2.1 -2.4 -2.3
Australia -4.3 -3.6 -3.7 -3.2
Thailand 3.2 0.5 1.1 1.4
Brazil -1.0 -3.3 -3.4 -3.0
Colombia -1.7 -3.0 -3.1 -4.0
Peru -1.0 -3.8 -3.9 -3.0
Chile 0.6 -3.0 -3.7 -4.6
Commodities
(annual average)
WTI Oil (US$/bbl) 57949496
Brent Oil (US$/bbl) 58 112 112 112
Nymex Natural Gas (US$/mmbtu) 5.67 2.85 3.75 4.00
Copper (US$/lb) 2.10 3.62 3.50 3.30
Zinc (US$/lb) 0.77 0.88 1.01 1.20
Nickel (US$/lb) 7.62 7.95 8.10 8.00
Gold, London PM Fix (US$/oz) 668 1,670 1,750 1,700
Pulp (US$/tonne) 718 872 875 950
Newsprint (US$/tonne) 581 640 630 660
Lumber (US$/mfbm) 272 298 340 375
5
Global Economic Research
December 20, 2012
Global Forecast
Update
Forecast
Changes
Canada & United States
The outlook for the Canadian and
U.S. economies in 2013-2014 is
largely unchanged from our last
update. Real GDP growth is
expected to average 2.0% in
Canada and 2.3% in the United
States, with underlying momentum
building gradually over the
forecast horizon. In both countries,
business investment and exports
are being constrained by the slow
pace of global growth and ongoing
economic uncertainty. While
federal fiscal restraint is expected
to impose a relatively larger drag
on U.S. growth, greater pent-up
demand for consumer goods and
housing give the U.S. economy a
slight performance edge over
Canada.
Canada’s projected federal deficits
from fiscal 2012-13 (FY13)
through FY15 rely upon annual
real per capita program spending
declines. In the United States,
potential restrictions on personal
income tax deductions could
significantly impact specific
sectors, from charities to housing.
Mexico
As a result of the recent inflation
performance in Mexico, we are
revising our 2012 year-end CPI
forecast from 4.2% to 4.0% y/y.
Consumer prices increased by
4.8% y/y in September, its highest
level since March 2010; it has
slowed since then to 4.2% y/y in
November (marked by discounts
given through the “el buen fin”
sales weekend).
North America
2000-11 2012f 2013f 2014f
Canada
(annual % change)
Real GDP 2.2 2.0 1.7 2.3
Consumer Spending 3.1 2.0 2.0 2.2
Residential Investment 4.2 5.5 -3.5 -3.6
Business Investment 3.0 4.8 4.9 6.2
Government 3.4 -0.9 -0.3 -0.2
Exports 0.2 1.7 3.0 5.7
Imports 3.3 2.7 2.5 3.8
Nominal GDP 4.7 3.3 3.3 4.3
GDP Deflator 2.5 1.3 1.6 1.9
Consumer Price Index 2.1 1.6 1.9 2.1
Core CPI 1.8 1.7 1.7 1.9
Pre-Tax Corporate Profits 5.5 -1.2 2.0 6.0
Employment 1.5 1.1 1.2 1.2
thousands of jobs 242 197 214 209
Unemployment Rate (%) 7.1 7.3 7.2 7.0
Current Account Balance (C$ bn.) 1.5 -71.0 -62.2 -50.0
Merchandise Trade Balance (C$ bn.) 41.0 -11.8 -4.7 8.9
Federal Budget Balance (C$ bn.) -1.2 -25.0 -18.0 -10.5
per cent of GDP 0.0 -1.4 -1.0 -0.5
Housing Starts (thousands) 200 214 180 175
Motor Vehicle Sales (thousands) 1,588 1,680 1,690 1,695
Motor Vehicle Production (thousands) 2,447 2,500 2,625 2,650
Industrial Production 0.0 0.7 2.0 3.3
United States
Real GDP 1.8 2.2 2.0 2.5
Consumer Spending 2.2 1.8 2.0 2.6
Residential Investment -4.6 12.0 15.8 18.3
Business Investment 1.2 7.0 1.4 5.1
Government 1.7 -1.3 -0.8 -1.0
Exports 4.1 3.7 3.4 4.8
Imports 3.5 2.8 2.3 4.8
Nominal GDP 4.1 4.1 3.9 4.5
GDP Deflator 2.2 1.8 1.9 1.9
Consumer Price Index 2.5 2.1 2.2 2.2
Core CPI 2.0 2.1 1.9 2.0
Pre-Tax Corporate Profits 6.5 6.5 5.0 7.0
Employment 0.2 1.4 1.4 1.8
millions of jobs 0.20 1.86 1.83 2.41
Unemployment Rate (%) 6.2 8.1 7.6 7.1
Current Account Balance (US$ bn.) -553 -467 -427 -447
Merchandise Trade Balance (US$ bn.) -642 -727 -708 -752
Federal Budget Balance (US$ bn.) -481 -1,089 -950 -800
per cent of GDP -3.4 -6.9 -5.8 -4.7
Housing Starts (millions) 1.38 0.78 0.95 1.10
Motor Vehicle Sales (millions) 15.2 14.3 15.0 15.5
Motor Vehicle Production (millions) 10.4 10.1 10.5 10.9
Industrial Production 0.5 3.6 2.6 3.4
Mexico
Real GDP 2.2 4.0 3.6 3.9
Consumer Price Index (year-end) 4.8 4.0 4.0 3.8
Unemployment Rate (%) 3.8 4.8 4.4 4.1
Current Account Balance (US$ bn.) -10.3 -12.1 -19.4 -26.3
Merchandise Trade Balance (US$ bn.) -7.5 -4.6 -11.6 -14.9
Industrial Production 1.6 3.9 3.6 3.7
6
Global Economic Research
December 20, 2012
Global Forecast
Update
Provincial
2000-11 2012f 2013f 2014f 2000-11 2012f 2013f 2014f
Real GDP
Budget Balances*, FY March 31
(annual % change) ($ millions)
Canada
2.2 2.0 1.7 2.3 106 -26,220 -25,000 -18,000
Newfoundland & Labrador 3.1 1.2 2.7 2.2 133 776 -726 n.a.
Prince Edward Island 1.9 1.2 1.1 1.6 -32 -79 -80 n.a.
Nova Scotia 1.7 1.3 1.3 2.2 70 -248 -277 n.a.
New Brunswick 1.8 1.1 1.0 1.8 -77 -261 -357 n.a.
Quebec 1.9 1.0 1.4 2.0 -623 -2,628 -1,500 0
Ontario 1.9 2.0 1.6 2.0 -3,374 -12,969 -14,371 n.a.
Manitoba 2.2 2.2 1.6 2.2 189
**
-999 -567 n.a.
Saskatchewan 2.2 3.1 2.6 2.9 393 352 6 n.a.
Alberta 3.0 3.4 2.7 3.1 3,627 0 0 n.a.
British Columbia 2.6 2.1 1.7 2.4 540 -1,840 -1,469 n.a.
* Final. Other FY12 and FY13 data: Provinces' estimates.
** FY04-FY11.
Employment Unemployment Rate
(annual % change) (annual average, %)
Canada
1.5 1.1 1.2 1.2 7.1 7.3 7.2 7.0
Newfoundland & Labrador 0.9 2.1 1.3 1.4 15.0 12.6 12.3 11.7
Prince Edward Island 1.5 1.0 0.7 0.8 11.3 11.3 11.1 11.0
Nova Scotia 1.0 0.8 0.8 0.9 8.8 8.9 8.9 8.7
New Brunswick 0.6 0.1 0.6 0.7 9.4 10.2 10.1 9.9
Quebec 1.4 0.5 1.0 1.1 8.2 7.8 7.7 7.6
Ontario 1.5 0.7 1.0 1.1 7.0 7.8 7.7 7.6
Manitoba 1.2 0.8 0.9 1.4 4.9 5.3 5.2 5.1
Saskatchewan 0.9 2.0 1.5 1.7 5.0 4.7 4.6 4.5
Alberta 2.6 2.7 2.0 2.1 4.8 4.7 4.6 4.5
British Columbia 1.5 1.7 1.2 1.3 6.7 6.7 6.6 6.5
Housing Starts
Motor Vehicle Sales
(annual, thousands of units) (annual, thousands of units)
Canada
200 214 180 175 1,588 1,680 1,690 1,695
Atlantic 12 12 10 10 114 123 124 124
Quebec 45 47 42 40 405 420 422 422
Ontario 73 76 61 60 603 627 630 631
Manitoba 5 7 6 5 44 50 50 51
Saskatchewan 4 10 8 7 42 54 55 55
Alberta 34 34 30 30 205 237 239 241
British Columbia 27 28 23 23 175 169 170 171
*
*
*
*
*
*
*
*
Forecast
Changes
Provinces
According to the revised Provincial
Economic Accounts,
Saskatchewan experienced a 28%
improvement in its terms-of-trade
from 2007 to 2011, the largest
among the provinces. With the
province’s interprovincial terms-of-
trade effectively unchanged over
that period, the improvement
came from the its international
terms-of-trade, in particular a
modest decrease in import prices
along with a 46% increase in the
price of its international goods
exports. Prices of the province’s
key exports have been mixed this
year, with higher wheat and
canola prices, but lower oil, potash
and uranium prices.
The revisions also indicate that
Canadian export volumes declined
at an average annual rate of 1.9%
between 2007 and 2011, with only
four provinces achieving a
measurable increase in
international shipments over that
period. Notwithstanding the
decline in international exports, all
but two provinces registered
growth in real interprovincial
exports over this period. In the
case of Ontario, in 2011, the
province was able to partially
offset its international trade deficit
equivalent to 5% of GDP, with an
interprovincial trade surplus
equivalent to 3.5% of GDP. We
expect these trends have
continued this year, with
interprovincial exports
outperforming the modest growth
in international shipments.
Updates for fiscal 2012-13 (FY13)
indicate a range of belt-tightening
across the Provinces. Relative to
Budget, the shortfall in provincial
resource receipts for FY13 is now
expected to exceed $2.0 billion.
Major federal transfers for FY14
for each Province, however, are
guaranteed by Ottawa not to
decline below FY13 levels. To
help restrain net debt, a number of
Provinces continue to trim capital
spending plans.
Canada
Canada
Canada
Newfoundland & Labrador
Prince Edward Island
Nova Scotia
New Brunswick
Quebec
Ontario
Manitoba
Saskatchewan
Alberta
British Columbia
Newfoundland & Labrador
Prince Edward Island
Nova Scotia
New Brunswick
Quebec
Ontario
Manitoba
Saskatchewan
Alberta
British Columbia
Atlantic
Quebec
Ontario
Manitoba
Saskatchewan
Alberta
British Columbia
Real GDP
(annual % change)
Budget Balances*, FY March 31
($millions)
Employment
(annual % change)
Unemployment Rate
(annual average, %)
Housing Starts
(annual, thousands of units)
Motor Vehicle Sales
(annual, thousands of units)
*Final. Other FY12 and FY13 data:
Provinces' estimates. **FY04-FY11.
Provincial 2000-11 2012f 2013f 2014f 2000-11 2012f 2013f 2014f
7
Global Economic Research
December 20, 2012
Global Forecast
Update
Quarterly Forecasts
12Q4f 13Q1f 13Q2f 13Q3f 13Q4f 14Q1f 14Q2f 14Q3f 14Q4f
Canada
Real GDP (q/q, ann. % change) 1.2 1.9 2.0 2.2 2.3 2.4 2.4 2.4 2.4
Real GDP (y/y, % change) 1.3 1.3 1.4 1.8 2.1 2.2 2.3 2.4 2.4
Consumer Prices (y/y, % change) 1.4 1.6 1.7 2.2 2.1 2.0 2.0 2.1 2.2
Core CPI (y/y % change) 1.3 1.6 1.6 1.9 1.9 1.9 1.9 2.0 2.0
United States
Real GDP (q/q, ann. % change) 1.0 1.9 2.2 2.3 2.5 2.6 2.6 2.7 2.7
Real GDP (y/y, % change) 1.8 1.8 2.0 1.8 2.2 2.4 2.5 2.6 2.7
Consumer Prices (y/y, % change) 2.0 2.0 2.3 2.3 2.2 2.1 2.2 2.2 2.2
Core CPI (y/y % change) 2.0 1.9 1.8 1.9 1.9 2.0 2.0 2.0 2.0
Financial Markets
Central Bank Rates
(%, end of period)
Americas
Bank of Canada 1.00 1.00 1.00 1.00 1.00 1.25 1.50 1.75 2.00
U.S. Federal Reserve 0.25 0.25 0.25 0.25 0.25 0.25 0.25 0.25 0.25
Bank of Mexico 4.50 4.75 5.00 5.00 5.25 5.75 6.50 6.75 7.00
Central Bank of Brazil 7.25 7.25 7.25 7.25 7.25 7.25 7.75 8.25 8.25
Bank of the Republic of Colombia 4.50 4.50 4.50 5.00 5.00 5.50 5.50 6.00 6.00
Central Reserve Bank of Peru 4.25 4.25 4.25 4.25 4.25 4.25 4.50 5.00 5.00
Central Bank of Chile 5.00 5.00 5.25 5.50 5.75 5.75 5.75 5.75 5.25
Europe
European Central Bank 0.75 0.75 0.75 0.75 0.75 0.75 0.75 0.75 0.75
Bank of England 0.50 0.50 0.50 0.50 0.50 0.50 0.50 0.50 0.50
Swiss National Bank 0.00 0.00 0.00 0.00 0.00 0.00 0.00 0.00 0.00
Asia/Oceania
Bank of Japan 0.10 0.10 0.10 0.10 0.10 0.10 0.10 0.10 0.10
Reserve Bank of Australia 3.00 3.00 3.00 3.00 3.25 3.25 3.50 3.50 3.75
People's Bank of China 6.00 6.00 6.00 6.00 6.00 6.30 6.30 6.60 6.60
Reserve Bank of India 8.00 7.50 7.00 6.75 6.75 6.75 6.75 7.00 7.25
Bank of Korea 2.75 2.75 2.75 3.00 3.00 3.25 3.25 3.50 3.50
Bank Indonesia 5.75 5.75 5.75 6.00 6.00 6.25 6.50 6.75 7.00
Bank of Thailand 2.75 2.75 2.75 3.00 3.00 3.25 3.25 3.50 3.50
Canada
3-month T-bill 1.00 1.00 1.00 1.00 1.10 1.35 1.65 1.90 2.15
2-year Canada 1.10 1.10 1.25 1.65 1.95 2.25 2.40 2.60 2.75
5-year Canada 1.35 1.35 1.65 1.90 2.15 2.40 2.55 2.75 2.95
10-year Canada 1.75 1.75 1.95 2.15 2.40 2.70 2.85 3.05 3.20
30-year Canada 2.35 2.35 2.60 2.70 3.10 3.35 3.50 3.60 3.65
United States
3-month T-bill 0.05 0.05 0.10 0.10 0.10 0.10 0.10 0.10 0.10
2-year Treasury 0.25 0.25 0.30 0.35 0.40 0.50 0.75 1.00 1.30
5-year Treasury 0.70 0.70 0.90 1.25 1.45 1.55 1.60 1.85 2.10
10-year Treasury 1.70 1.70 1.80 2.10 2.50 2.75 3.00 3.15 3.25
30-year Treasury 2.90 2.90 2.95 3.20 3.65 3.85 4.00 4.10 4.15
Canada-U.S. Spreads
3-month T-bill 0.95 0.95 0.90 0.90 1.00 1.25 1.55 1.80 2.05
2-year 0.85 0.85 0.95 1.30 1.55 1.75 1.65 1.60 1.45
5-year 0.65 0.65 0.75 0.65 0.70 0.85 0.95 0.90 0.85
10-year 0.05 0.05 0.15 0.05 -0.10 -0.05 -0.15 -0.10 -0.05
30-year -0.55 -0.55 -0.35 -0.50 -0.55 -0.50 -0.50 -0.50 -0.50
Global Economic Research Global Economic Research
December 20, 2012
Global Forecast
Update
Scotiabank Economics
Scotia Plaza 40 King Street West, 63rd Floor
Toronto, Ontario Canada M5H 1H1
Tel: (416) 866-6253 Fax: (416) 866-2829
Email:
This report has been prepared by Scotiabank Economics as a resource for the clients of Scotiabank.
Opinions, estimates and projections contained herein are our own as of the date hereof and are
subject to change without notice. The information and opinions contained herein have been
compiled or arrived at from sources believed reliable but no representation or warranty, express or
implied, is made as to their accuracy or completeness. Neither Scotiabank nor its affiliates accepts
any liability whatsoever for any loss arising from any use of this report or its contents.
TM
Trademark of The Bank of Nova Scotia. Used under license, where applicable.
0
1
2
3
4
5
6
7
04 05 06 07 08 09 10 11 12 13 14
%
Forecast
Canada
U.S.
U.K.
Euro zone
-4
-2
0
2
4
6
8
10
07 08 09 10 11 12
y/y % change
U.S.
China
Euro zone
Canada
0
1
2
3
4
5
6
7
04 05 06 07 08 09 10 11 12 13 14
%
Forecast
Canada
U.S.
Central Bank Rates Global Inflation 10-Year Yields
Source: Bloomberg, Scotiabank Economics. Source: Bloomberg, Scotiabank Economics. Source: Bloomberg, Scotiabank Economics.
Financial Markets
12Q4f 13Q1f 13Q2f 13Q3f 13Q4f 14Q1f 14Q2f 14Q3f 14Q4f
Exchange Rates
(end of period)
Americas
Canadian Dollar (USDCAD) 0.97 0.97 0.97 0.96 0.96 0.95 0.95 0.94 0.94
Canadian Dollar (CADUSD) 1.03 1.03 1.03 1.04 1.04 1.05 1.05 1.06 1.06
Mexican Peso (USDMXN) 12.78 12.93 12.84 12.95 13.17 13.01 12.84 12.89 13.05
Brazilian Real (USDBRL) 2.06 2.11 2.12 2.15 2.15 2.15 2.18 2.20 2.20
Colombian Peso (USDCOP) 1789 1810 1820 1840 1850 1860 1870 1880 1890
Peruvian Nuevo Sol (USDPEN) 2.56 2.55 2.53 2.51 2.49 2.49 2.48 2.45 2.45
Chilean Peso (USDCLP) 475 493 494 495 497 498 500 503 505
Canadian Dollar Cross Rates
Euro (EURCAD) 1.29 1.26 1.25 1.23 1.22 1.20 1.20 1.18 1.18
U.K. Pound (GBPCAD) 1.58 1.57 1.58 1.57 1.57 1.57 1.57 1.56 1.56
Japanese Yen (CADJPY) 87 88 90 93 94 95 96 97 98
Australian Dollar (AUDCAD) 1.02 1.02 1.03 1.03 1.04 1.03 1.04 1.02 1.03
Mexican Peso (CADMXN) 13.17 13.33 13.24 13.49 13.72 13.69 13.51 13.71 13.89
Europe
Euro (EURUSD) 1.33 1.30 1.29 1.28 1.27 1.26 1.26 1.25 1.25
U.K. Pound (GBPUSD) 1.63 1.62 1.63 1.64 1.64 1.65 1.65 1.66 1.66
Swiss Franc (USDCHF) 0.91 0.93 0.94 0.95 0.96 0.98 0.98 1.00 1.00
Swedish Krona (USDSEK) 6.51 6.62 6.59 6.56 6.54 6.55 6.51 6.52 6.48
Norwegian Krone (USDNOK) 5.55 5.60 5.50 5.40 5.30 5.28 5.25 5.22 5.20
Russian Ruble (USDRUB) 30.7 30.9 31.2 31.5 31.8 31.9 32.0 32.1 32.2
Asia/Oceania
Japanese Yen (USDJPY) 84 85 87 89 90 90 91 91 92
Australian Dollar (AUDUSD) 1.05 1.05 1.06 1.07 1.08 1.08 1.09 1.09 1.10
Chinese Yuan (USDCNY) 6.25 6.25 6.20 6.15 6.10 6.09 6.07 6.06 6.04
Indian Rupee (USDINR) 54.5 54.1 53.8 53.4 53.0 52.7 52.4 52.1 51.8
South Korean Won (USDKRW) 1075 1069 1063 1056 1050 1044 1038 1031 1025
Indonesian Rupiah (USDIDR) 9700 9675 9650 9625 9600 9550 9500 9450 9400
Thai Baht (USDTHB) 30.6 30.5 30.4 30.3 30.3 30.1 30.0 29.9 29.8