RISK OF PULMONARY TUBERCULOSIS ASSOCIATED WITH EXOGENOUS REINFECTION AND ENDOGENOUS REACTIVATION IN A SOUTH INDIAN RURAL POPULATION-A MATHEMATICAL ESTIMATE* doc
Bạn đang xem bản rút gọn của tài liệu. Xem và tải ngay bản đầy đủ của tài liệu tại đây (199.83 KB, 5 trang )
Ind. J. Tub., 1990, 37, 63
RISK OF PULMONARY TUBERCULOSIS ASSOCIATED WITH EXOGENOUS
REINFECTION AND ENDOGENOUS REACTIVATION IN A SOUTH INDIAN
RURAL POPULATION-A MATHEMATICAL ESTIMATE*
V.V. Krishnamurthy
1
and K. Chaudhuri
2
Summary : It has been reported that a substantial
proportion of the new cases arise from the previously
infected population. Hence, it appears that exogenous
reinfection and/or endogenous reactivation play a major
role in the development of post-primary disease. Though
the risk of disease due to recent infection is known, the risk
of disease associated with exogenous reinfection and
endogenous reactivation has not been computed in Indian
conditions. The data collected during a longitudinal study
by NTI, Bangalore was analysed to estimate the above
mentioned risk rates. The risk of disease associated with
exogenous reinfection was 6.55% per year compared with
0.21% yearly due to endogenous reactivation. To test the
validity of the computed risk rates these were applied to
the interval between the 3rd and 4th surveys. It was then
estimated that 64 new cases should have been diagnosed in
that survey interval as against 57 cases actually diagnosed.
It was also estimated that 1.9% of the total
population would be having recent infection, 1.3%
would be previously infected with recent infection
and 32.7% with previous infection but no recent
infection leaving 64.1% who are not infected at all
(uninfected). Among the new cases diagnosed, 28%
would have progressive primary disease, 41% cases
arise due to exogenous reinfection and 31% due to
endogenous reactivation. In other words, the 1.9%
population with recent infection contributes 28% of
the total new cases, the 1.3% reinfected population
contributes 41% and the 32.7% infected population
wi thout further reinfection contributes the
remaining 31% of the total new cases.
Introduction
It is estimated that about one third of the Indian
population are infected with M.tuberculosis (National
Tuberculosis Institute, 1974). It is also reported that
about 75% of the total new pulmonary tuberculosis cases
are diagnosed from the previously infected and 25%
from the uninfected persons (Krishnamurthy et al.,
1976). The new cases arising from the previously
infected population may have developed the disease
either due to exogenous superinfection/reinfection
(EXRI) or endogenous reactivation (ENRA). On the
other hand, new cases from the uninfected population
arise following a comparatively recent primary infection.
As a substantial proportion of the new cases are
diagnosed from the previously infected persons, EXRI
and/or ENRA should be playing a major role in the
development of post-primary disease. Though the risk of
disease among the previously infected persons is five
times that among the uninfected, the risk of disease
associated with EXRI and ENRA is not known in Indian
conditions. In this analysis, an attempt has been made to
mathematically estimate the above mentioned risk rates
for the Indian population aged five years and above.
Materials and Methods
The data collected from four epidemiological
surveys during a longitudinal study of tuberculosis in a
rural population of South India is analysed (National
Tuberculosis Institute, 1974). As the interval between
the I-II and II-III surveys was identical (1½ years), the
data collected during the first three surveys are analysed.
For the details of the survey procedures, the above cited
study may be referred. Persons having normal chest
x-ray or those with abnormal chest x-ray in the
preceding survey(s) but bacteriologically negative who
became culture positive with persisting X-ray
abnormality in the subsequent survey were termed new
cases. Infection occurring within 1½ years is considered
as new infection or reinfection, as the case may be. New
cases arise from three different groups of population
viz.,
* Paper presented at the First Joint Conference on Tuberculosis and Chest Diseases held at Madras in
December, 1989.
1.
Statistical Assistant, National Tuberculosis Institute, 8, Bellary Road, Bangalore 560 003.
2.
Director, National Tuberculosis Institute, Bangalore.
64 V.V KRISHNAMURTHY AND K. CHAUDHURI
1. Previously uninfected population with recent
infection or the newly infected (NI)
-progressive primary tuberculosis,
2. previously infected population with added recent
infection (RI)
-exogenous tuberculosis (from superinfection or
reinfection, "reinfection" hereafter) and
3. Previously infected population with no recent
reinfection (NRI)
-endogenous tuberculosis (as a result of reacti-
vation).
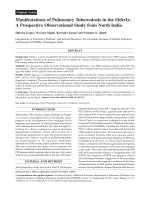
The formulation of the three groups at the II survey
is shown in the accompanying diagram.
The development of new pulmonary tuberculosis
from the above cited three groups could be
mathematically written as:
NI × A + RI × B + NRI × C = Total new cases
where A, B and C are the risks of disease associated
with new infection, reinfection and endogenous
reactivation respectively and the abbreviations NI, RI
and NRI are as explained above. The first term in the
above equation viz., NI x A is equivalent to the total
new cases arising from the group of persons with
recent infection. If cases diagnosed from the newly
infected population could be identified and removed,
then the above equation reduces itself to :
RI × B + NRI × C = New cases arising from the
previously infected population.
When the size of RI and NRI groups becomes known,
there will be two unknowns i.e. B and C in the
equation. By formulating two equations, the values of
B and C could be worked out.
Findings
Size of the population with "recent reinfection (RI) "
and "no recent reinfection (NRI) "
To estimate the size of RI and NRI, it is assumed
that the risk of infection is uniform for the population
as a whole, comprising both infected and uninfected
persons. Similar assumption has been made by other
workers also (Sutherland, 1973). The incidence
Diagram showing groups of Population by status of tuberculous infection
Population at
I Survey
Not infected
At II Survey
Infected
At II Survey
Not
infected
Recently
infected NI
Reinfected
RI
No
Reinfection
NRI
New cases
Primary
Tuberculosis
New cases due to
endogenous
reactivation
New cases due
to exogenous
reinfection
RISK OF PULMONARY TUBERCULOSIS 65
rate of infection (column 4) between I and II and II and
III surveys is available from the already reported five
year study, (National Tuberculosis Institute, 1974). By
applying these incidence rates to the infected
population, the respective sizes of RI and NRI can be
estimated.
It was estimated that among 10,565 persons (aged
5 years and above) infected at the I survey and
examined at the II survey, 415 persons had become
reinfected between I-II surveys and I0,150 had no
reinfection (Table 1). The corresponding figures for
II-III surveys were 229 and 9,165 persons respectively
(Table not presented).
Among the 70 new cases diagnosed at the II
survey, 48 cases were diagnosed from the group of
infected persons at I survey, 19 cases from the
uninfected (the tuberculin sensitivity status at I survey
was not available for three cases). The corresponding
figures for the new cases diagnosed at the III survey
were 34, 5 and 1 respectively.
Two equations are:
Between surveys I-II : 415 x B + 10150 C = 48
Between surveys II-III : 229 x B + 9165 C = 34
Solving the two equation :
The value of B = 0.0655 or 6.55%
The value of C = 0.002108 or 0.21%
To test the validity of the risk rates computed
above (6.55% and 0.21%), these rates were applied to
the interval between III and IV surveys. It was found
that 64 new cases could have been diagnosed as against
57 actually diagnosed.
The risk of disease associated with the cited
different types of tuberculosis infection is given in
Table 2.
The risk of disease associated with reinfection is
31 times that for endogenous reactivation and twice
that for recent infection.
Table 2. Risk of disease associated with different
types of infection
Type of infection
Risk of disease
(%)
(Annual)
Recent infection
3.19*
Exogenous reinfection
(Reinfection)
6.55
Endogenous reactivation
0.21
* Krishnamurthy et al
With the information on the size of previously
infected population, with or without recent reinfection,
it is possible to construct the profile of the population
in respect of tuberculous infection (Table 3). The table
is self explanatory.
Among the infected persons (11, 161), 5% were
initially uninfected but got recently infected between
surveys I and II (596), 4% were reinfected (415) and
91% (10,150) had no reinfection.
Table 1. Size of the population with or without recent reinfection between I and II surveys (estimated)
Examined at II survey Previously infected
Among I survey
Incidence rate of
infection (%)
between*
Age at I survey Uninfected Infected I and II surveys
Plus recent
reinfection
(RI)**
No recent
reinfection
(NRI)**
1 2 3 4 5 = 3 x 4 6 = 3-5
5-14
10194 1409 1.78 25 1384
15-34
6093 4057 3.35 136 3921
35+
4205 5099 4.99 254 4845
All ages (5 +)
20492 10565 - 415 10150
*National Tuberculosis Institute (1974); **estimated
66 V.V KRISHNAMURTHY AND K. CHAUDHURI
Table 3. Population aged 5 years and above (examined at I and II surveys) at II survey by infection status
Status of tuberculous infection Number % to total population
remain uninfected 19896 64.1
*Uninfected }
recently infected 596** 1.9**
Previously infected with recent reinfection 415 1.3
Previously infected with no recent reinfection 10150 32.7
Total population 31057 100.0
* Total uninfected = 20492; ** National Tuberculosis Institute, 1974
Among the 67 new cases diagnosed at the II
survey, for whom tuberculin sensitivity was known at I
survey, 28% had progressive primary tuberculosis,
41% had disease due to exogenous reinfection and the
remaining 31% due to endogenous reactivation (Table
4).
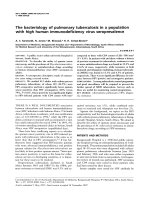
Contribution by different groups of population to the
total new cases at the II survey
Population with recent infection constituting
1.9% of the total population have contributed 28%
of the total new cases (progressive primary disease);
infected population with reinfection constituting
1.3% of the population have contributed 41% of the
new cases (disease due to exogenous reinfection),
and tie remaining 31% of the total new cases
(disease due to endogenous reactivation) have come
from the population previously infected with no
reinfection constituting 32.7% of the total
population (Fig. 1). It could be seen that the infected
population with reinfection are not only at the
highest risk of developing fresh pulmonary
tuberculosis (6.55%) but they make the
RISK OF PULMONARY TUBERCULOSIS 67
Table 4. Composition of new cases diagnosed at II survey
Type of infection No. of persons Risk of disease (%) New cases
% to total
new cases
Recently infected 596 3.19* 19 28
Previously infected with recent reinfection 415 6.55 27 41
Previously infected with no recent reinfection 10150 0.21 21 31
* Krishnamurthy et al.
highest proportional contribution to the total new
cases arising in the community. More over, the
newly infected persons together with the group of
population previously infected and recently
reinfected together contribute 69% on the total new
cases arising in the community. Only 31% of the
new cases arise from the previously infected persons
with no recent reinfection, presumably due to
endogenous reactivation.
Acknowledgement
The authors are grateful to Dr A.K. Chakraborty,
Deputy Director, CGHS, Bangalore for his comments
and suggestions at the draft stage of the paper,
Mrs.Anuradha for statistical assistance, Miss T.J.
Alamelu for secretarial help and Mr B.R. Narayana
Prasad graphics.
References
Krishnamurthy, VV, Nair, SS, Gothi, GD, a
Chakraborty, AK. Incidence of Tuberculosis
among newly infected population and in relation to
the duration of infected status; Indian Journal of
Tuberculosis 1976, Vol. 33/1, 3.
National Tuberculosis Institute, Bangalore.
Tuberculosis in a rural population of South India :
a five year epidemiological study, Bull World
Health Orgn, 1974, 51, 473.
Sutherland, I. Endogenous reactivation and exogenous
reinfection, IUAT 1972,47,123.