Tài liệu Detection of Pulmonary tuberculosis: comparing MR imaging with HRCT pptx
Bạn đang xem bản rút gọn của tài liệu. Xem và tải ngay bản đầy đủ của tài liệu tại đây (2.77 MB, 7 trang )
RESEARCH ARTICLE Open Access
Detection of Pulmonary tuberculosis: comparing
MR imaging with HRCT
Elisa Busi Rizzi
1*
, Vincenzo Schinina’
1
, Massimo Cristofaro
1
, Delia Goletti
2
, Fabrizio Palmieri
3
, Nazario Bevilacqua
3
,
Francesco N Lauria
3
, Enrico Girardi
4
and Corrado Bibbolino
1
Abstract
Background: Computer Tomography (CT) is considered the gold standard for assessing the morphological
changes of lung parenchyma. Although novel CT techniques have substantially decreased the radiation dose,
radiation exposure is still high. Magnetic Resonance Imaging (MRI) has been established as a radiatio n- free
alternative to CT for several lung diseases, but its role in infectious diseases still needs to be explored further.
Therefore, the purpose of our study was to compare MRI with high resolution CT (HRCT) for assessing pulmonary
tuberculosis.
Methods: 50 patients with culture-proven pulmonary tuberculosis underwent chest HRCT as the standard of
reference and were evaluated by MRI within 24 h after HRCT. Altogether we performed 60 CT and MRI
examinations, because 10 patients were also examined by CT and MRI at follow- up. Pulmonary abnormalities, their
characteristics, location and distribution were analyzed by two readers who were blinded to the HRCT results.
Results: Artifacts did not interfere with the diagnostic value of MRI. Both HRCT and MRI correctly diagnosed
pulmonary tuberculosis and identified pulmon ary abnormalities in all pa tients. There were no significant differences
between the two techniques in terms of identifying the location and distribution of the lung lesions, though the
higher resolution of MRI did allow for better identification of parenchymal dishomogeneity, caseosis, and pleural or
nodal involvement.
Conclusion: Technical developments and the refinement of pulse sequ ences have improved the quality and speed
of MRI. Our data indicate that in terms of identifying lung lesions in non-AIDS patients with non- miliary
pulmonary tuberculosis, MRI achieves diagnostic performances comparable to those obtained by HRCT but with
better and more rapid identification of pulmonary tissue abnormalities due to the excellent contrast resolution.
Background
CT is considered the gold standard for assessing the
morphological changes of lung parenchyma. Although
novel CT techniques have substantially decreased the
radiation dose, radiati on exposure is still high. Magnetic
Resonance Imaging (MRI) has been established as a
radiation- free alternative to CT for several lung dis-
eases, explaining the growing interest in (MRI) for lung
parenchyma. New technologies and strategies which
allow for very fast imaging and improved image quality
[1,2] have been introduced, but their role in infectious
diseases still needs to be explored further.
MRI o f the lung is difficult for s everal reasons. Major
problems result from susceptibility artifacts caused by
extensive air-tissue parenchymal interfaces and the low-
proton density of normal parenchyma, both of which
are factors that lead to low signal intensity of the nor-
mal lung. Another problem is the continuous motion of
all components induced by heart pulsation and respira-
tion, which are most prominent in the lower and ante-
rior sections of the chest. However, proton density
increases when lung tissue damage determines air space
obliteration, reducing the susceptibility effects. In these
cases, MRI plays a role in assessing lung parenchyma
[1,3-5] and could be useful in diagnosing pneumonia,
due to the exudative accumulation of water and cells
occurring in the air space.
* Correspondence:
1
Diagnostic Department, Radiology. “L. Spallanzani” National Institute for
Infectious Diseases Rome ITALY
Full list of author information is available at the end of the article
Busi Rizzi et al. BMC Infectious Diseases 2011, 11:243
/>© 2011 Rizzi et al; licensee BioMed Central Ltd. This is an Open Access article distributed under the terms of the Creative Commons
Attribution License ( which permits unrestricted use, distribution, and reprodu ction in
any medium, pro vided the original work is properly cited.
There is some existing information on MR imagi ng of
the lung for various diseases, including pulmonary per-
fusion and ventilation [1,2,5-9], however to our knowl-
edge, no systematic study has been published about
diagnostic MRI in patients with pulmonary tuberculosis.
The aim of our study was to compare HRCT and MRI
lung examinations to identify the features of tuberculo-
sis (TB).
Methods
Patients enrolment and characteristics
Our prospective study received institutional review
board approval (INMI 3/150207) by the local ethical
committee and all patients provided written informed
consent.
The 50 patients (17 women and 33 men, ranging from
21-63 years o f age with a median age of 47) who met
our study criteria were referred to undergo HRCT and
MRI imaging. The entry criteria for patients were as fol-
lows: (a) a chest X-ray with pulmonary abnormalities,
(b) culture-proven pulmonary tuberculosis in culture
from sputum (also induced) or bronchoalveolar lavage
(c) absence of contraindication to MR examin ations (ex.
cardiac pacemakers, cochlear implants), (d) MRI
obtained within 24 hours of the CT examination, to
avoid divergent results during therapy.
All patients who did not have AIDS or additional con-
comitant infectious diseases were undergoing TB treat-
ment. Altogether we performed 60 CT and MRI
examinations, because 10 patients were also examined
by CT and MRI at follow- up . However we analyzed the
latter examinations to increment the number in our ser-
ies, not to evaluate the effectiveness of therapy
CT
Low dose HRCT was performed on all subjects using a
helical four-channel MDCT scanner (Light Speed QX/i
General Electric Medical System, Milwaukee, Wis).
Unenhanced HRCT was obtained from the apex to the
base of the lung at the end of inspiration, with 1-mm
collimation, a high resolution algorithm, and 10 mm
spacing. A specific mediastinum reconstruction algo-
rithm was employed, and the images were obtained o n
lung and mediastinal settings.
To minimize the radiation required for obtaining diag-
nostic scans, the following scanning parameters were
selected: tube current 70 mA, with 100 kV [7].
MRI
Parallel imaging MRI was performed with a 1, 5-T sys-
tem (Signa Excite, General Electric Medical System, Mil-
waukee, Wis, USA), a maxi mum gradient strength of 33
mT/m, and a slew rat e of 120 mT/m/s, using a six-
channel body phased array coil system.
The examinations were p erformed with expiratory
respiratory and diastolic gating. When pulsation was less
vigorous, pulsation artifacts were reduced [1,6,8]. In
agreement with the literature data [6], we preferred t o
use respiratory gating which allowed for continuous
breathing instead of multiple breath hold acquisitions,
also because the shifts of the lung parenchyma relative
to the slice level are reduced. We performed MRI in
expiration because the expiration phase is longer than
the inspiration phase and signal intensity increases with
deflation [8]. Even when MRI was performed in expira-
tory respiration and CT at the end of inspiration, there
was no significant discrepancy between the breathing
positions of the images.
An axial T2-weighted Fast Recovery Fast Spin-Echo
(FR FSE T2) FAT SAT was used with the following
param eters: Echo Time, 90 msec; Repetition Time, 2500
msec; Echo Train Length, 14; bandwidth, 50; sli ce thick-
ness, 5 mm; slice gap, 2 mm; field of view, 42 cm;
matrix size, 288 × 224, reconstructed to 512.
Fat saturation sequences are very effective because th e
attenuated fat signal of the thoracic subcutaneous tissue
reduces the ghosting artifacts of the ventral chest wall
[6] and also increases conspicuity of fluids [9].
This sequence provides good image quality, and with
imaging times of about 120 seconds we obtained enough
slices to assess the entire lung.
The in-room time, including positioning the patient
on the examination table, was a pproximately 15
minutes.
Imaging Analysis
Both CT and MR images, all made anonymous, were
directly displayed on the monitors of a picture archiving
and communication system (PACS 5.1 Kodak, Roche-
ster, NY, USA) with a window setting appropriate for
lung parenchyma and mediastinum (pixel 2048 × 25 60,
display gradation 1021 (10-bit), maximum brightness
750cd/m
2
, LCD display device 54 cm). The readers were
asked to assess presence, location and extension of pul-
monary TB.
According to the standardized nomenclature for par-
enchymal findings on CT, consolidation was defined as
a homogeno us increase in lung parenchyma attenuat ion
that obscures the margins of the vessels and airway
walls(anairbronchogrammaybepresent);anodule
was defined as a round lesion with a diameter of 3 cm
or smaller; ground glass pattern was defined as a homo-
genous, hazy area of increased attenuation without
obscuration of bronchovascular margins (an air bronch-
ogram may be present); cavitation was defined as a gas-
filled space, contained or not contained within a pul-
monary consolidation, mass, or nodule. Tree in bud
appearance was defined as a linear branching structure
Busi Rizzi et al. BMC Infectious Diseases 2011, 11:243
/>Page 2 of 7
with more than one contiguous branching site. Further-
more, we assessed interstitial changes, in particular mili-
ary, bronchial wall and peribronchial tissue thickening.
Pleural and mediastinal lymph node involvement was
also assessed.
Pleural effusion was defined as free-flowing pleural
fluid producing sickle-shaped opacity (in most cases
posteriorly) and loculat ed fluid c ollections as lenticular
opacities in a fixed position. Pleural effusions with a
volume of 15 ml or more can be detected with CT,
however pleuritis sicca is not visible on CT scans.
Lymph nodes were considered enlarged when they were
greater than one centimeter on the short axis. Since
there are no established MRI criteria to define parench-
ymal lung findings, we adopted the CT criteria. Regard-
ing the pleura, MRI can detect subtle signal
abnormalities that might be consistent pleuritis sicca.
Concerning lymph nodes, we also assessed nodal signal
intensity compared with thoracic wall m uscle. Previous
reports correlated histological data with MRI features in
tuberculous lymphadenopathy [10], including signal
intensity on unenhanced MR. Based on MRI findings,
lymph node types could be defined according to the
presence and degree of granuloma formation, caseation/
liquefaction necrosis, fibrosis and calcifications. Signal
intensity may differ depending on the stage of evolution:
i) slight hyper-intensity may reflect lymphoid hyperpla-
sia related to inflammation, ii) high hyper-intensity is
suggestive of liquefactive necrosis, and iii) central isoin-
tensity associated with peripheral hyper-intensity may
reflect caseosis.
The MRI findings to be assessed were previously
established by consensus to av oid bias in individual
interpretation.
All MR images were independently analyzed by two
board-cer tified radiologists (VS, EBR, both with 10 years
of experience in clinical MR imaging and 25 years of
experience in chest imaging). The observers were una-
ware of CT results to avoid interpretation bias. Since
CT is considered the gold standard technique, all CT
images we re considered a s reference scans and were
analyzed in a randomised order by the same radiologist
in consensus, two months after analyzing the MR
images.
Then, they directly compared MRI with CT examina-
tions in consensus to verify the presence, distribution
and character istics of pathological features. In divergent
cases, MRI and CT were re-examined to determine
which imaging technique was correct. Disagreements in
image scorings were resolved by consensus. MRI arti-
facts were graded as minimal (barely visible), moderate
(clearly visible, but not interfering with evaluation) and
severe (compromising evaluation). Particular attention
was given to determining whether these artifacts inter-
fered with the diagnostic value.
For CT and MR images, each parenchymal finding
was scored on a scoring sheet using the following sliding
scale of relative certainty: 0 = definitely negative; 1 =
probably negative; 2 = indeterminate; 3 = probably posi-
tive; 4 = definite ly positive. To calculate the MRI detec-
tion rate for each finding, we only considered those that
were scored as 0 (definitely negative) and 4 (definitely
positive).
Furthermore, for both imaging techniques, we c lassi-
fied each lung by zone: upper, middle, and lower, result-
ing in a total of six zones per patient. The upper zones
were defined as areas of the lung above t he level of the
carina; the middle zones as areas between the level of
thecarinaandtheoriginoftheinferiorpulmonary
veins; and the lower zones as areas below the origin of
the inferior pulmonary veins. Each zone had approxi-
mately the same number of sections. We scored lung
zone involvement by using a four-point scale: 0 = no
involvement, 1 = < 25%, 2 = 25%-50%, 3 = > 50%.
Statistical analysis
Statistical analyses were performed using the SPSS/PC+
version 11 (SPSS, Chicago, Ill). A p value lower than
0.05 indicated a statistically significant difference.
The degree of agreement between observers interpret-
ing chest MRI was determined by using pair-wise kappa
statistics as follows: very good, k value > 0.81; good, k
value 0.80-061; moderate, k value 0.60-041. A s eparate
kappa value was calculated for each sign that was
reviewed.
K statistics were also calculated to analyze the agree-
ment between MRI and CT and a detection rate for
each finding; in this analysis, results were dichotomized
as definitely positive or not.
The chi- square test was used to compare the propor-
tion of images demonstrating different scores of involve-
ment for each zone of the lungs depicted by MRI and
CT.
Results
MR artifacts were negligible in 48 cases (48/60 80%),
and minimal (barely visible) in 12 cases (12/60 20%),
however, these artifacts did not interfere with the diag-
nostic value. There were no motion artifacts or
instances of image distortion due to susceptibility that
resulted in poor image quality.
Pathological findings were observed in all CT and MR
examinations (Table 1) however, in our study we did
not observe miliary or calcified parenchymal lesions.
Concerning MR imaging, a greement between obser-
vers was always very good for each sign (k = 0.98-0.86).
Busi Rizzi et al. BMC Infectious Diseases 2011, 11:243
/>Page 3 of 7
A k value of 1 for MRI/CT agreement was recorded
for consolidations, nodules and cavities. In 4 patients,
MRI easily assessed caseation while CT showed aspecific
hypodensity (Figure 1a, b).
The k value for MRI/CT agreement was 0.90 for
ground glass, 0.86 for tree in bud and 0.78 for interstitial
changes (Figure 2, Figure 3, Figure 4a, b, Figure 5a,b).
Regarding pleural effusion (Figure 6a, b, Figure 7a, b),
the results of the two techniques differed considerably,
and the k value for MRI/CT agreement was 0.54. For
MRI, we found hyper-intensity to be consistent with
pleural involvement in 35% cases (21/60 examinations).
For CT, pleural effusion (free or loculat ed) was se en in
only 17% (10/60 examinations) of the cases. In the
remaining 11 cases depicted by MRI, 3 cases showed
very subtle pleural effusion (identified on CT by the
reviewers in consensus), and in 8 there was no pleural
abnormality on CT; pleural layers showed a relatively
high signal intensity on T2-weighted images without sig-
nificati ve thickening or effusi on, consistent with inflam-
mation sicca.
Regarding mediastinal lymph nodes (Figure 8a, b), on
MRI we found that in 23% of the cases (14/60 examina-
tions) there was either enlargement and/or signal altera-
tion consistent with nodal involvement; a total of 56
lymph nodes were evaluated. In our series, when com-
pared with the thoracic wall muscle, 89% of the nodes
Table 1 Findings of 60 HRCT examinations and 60 MRI examinations
HRCT score MRI score
01234
Consolidation 52 52
Alteration consistent with caseosis undetermined 4
Cavitation 39 39
Ground glass 6 2 1 4
Nodule 43 43
Tree in bud 33 29
Interstitial changes 14 1 4 13
Lymph nodes (Short axis > 10 mm) 38 56
Edema undetermined 50
Alteration consistent with colliquative necrosis undetermined 2
Alteration consistent with caseosis undetermined 4
Pleural involvement 10 21
0 = definitely negative
1 = probably negative
2 = indeterminate
3 = probably positive
4 = definitely positive
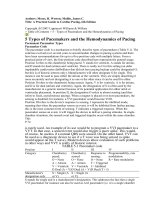
Figure 1 32 year-old man with pulmonary tuberculosis.A)
HRCT shows parenchymal consolidation with cavitations. B)
Unenhanced MRI better depicts caseosis, air level in the cavities and
pleural effusion.
Figure 2 28 year-old man with pulmonary tuberculosis, HRCT
shows bronchogenic spread and interstitial changes with
peribronchial thickening.
Busi Rizzi et al. BMC Infectious Diseases 2011, 11:243
/>Page 4 of 7
were slightly hyper-intense (most likely reflecting lym-
phoid hyperplas ia), 7% showed central isointensity asso-
ciated with peripheral hyperintensity (most likely
refl ecti ng caseosi s), and 3.5% were highly hyper-intense,
suggesting liquefactive necrosis.
A total of 38 lymph nodes were evaluated on unen-
hanced CT. Nodal involvement, assessa ble only as an
enlargement, was seen in 16% of the cases (10/60 exami-
nations). In the remaining 4 patients, nodal involvement
(depicted by MRI as hyperintensity) was not identified
on CT by the reviewers in consensus, nor at re-exami-
nation, because the nodal short axis remained < 10 mm.
We examined the lymph nodes (which were identified
as pathological on HRCT and MRI because the short
axis was greater than 10 mm) to choose which imaging
technique enabled correct diagnosis of nodal involve-
ment. We observed that MRI depicted signal alterations
in all of the lymph nodes that were enlarged on CT.
The same MR signal alterations were observed in lymph
nodes that were not enlarged on CT. These data suggest
that MRI have a highe r sensitivity for detecting nodal
involvement. In all patients, both MR and CT examina-
tions showed identica l results concerning the location of
parenchymal features (Table 2).
Discussion
Today CT represents the gold standard for assessing
lung parenchyma. MRI has some relevant clinical appli-
cation, but it is not used in routine clinical management.
Several recent studies clearly demonstrated that MRI
Figure 3 Same patient reported in Fig.2: 28 year-old man with
pulmonary tuberculosis, unenhanced MRI identifies the same
features as well as HRCT in figure 2.
Figure 4 44 year-old man with pulmonary tuberculosis.A)
HRCT shows interstitial changes with peribronchial thickening. B)
Unenhanced MRI identifies the same features as well as HRCT.
Figure 5 53 year-old woman with pulmonary tuberculosis.A)
HRCT shows interstitial changes with peribronchiolar thickening. B)
Unenhanced MRI identifies the same features as well as HRCT and
also depicts lymph node caseosis.
Figure 6 38 year-old man with pulmonary tuberculosis.A)
HRCT shows parenchymal consolidation. B) Unenhanced MRI
depicts colliquative necrosis within consolidation, subtle, free and
loculated pleural effusion, and a highly hyper-intense mediastinal
lymph node.
Busi Rizzi et al. BMC Infectious Diseases 2011, 11:243
/>Page 5 of 7
can identify lung abnormalities [1,2,4-6,9] with signifi-
cant diagnostic ad vantages over CT in terms o f higher
contrast resolution and absence of exposure to radiation.
However, CT is cheaper, more widespread, rapid to per-
form, and has an established role in clinical manage-
ment. On the other hand, the disadvantages of MRI,
such as limited spatial resolution and motion and sus-
ceptibility artifacts, have been overcome by using new
techniques. In agreement with literature, our study indi-
cates that regarding presence and distribution of patho-
logical lung features, MRI and CT show the same
results, even regarding lung tuberculosis.
Based on a one- to -one correlation between MRI and
CT, the findings in both techniques regarding consolida-
tions, nodules and cavities correlated well, and indeed
obtained the same results when identifying these
characteristics.
On the contrary, although MRI identified parenchymal
changes, on 4 occasions it failed to diagnose “ tree in
bud” , probably misinterpreted as interstitial changes.
These false negative results for bronchogenic spread
were made because of the lower MR spatial resolution.
Likewise, the missed identification of interstitial changes,
verified in one follow- up case, was due to very subtle
involvement and lower MR spatial resolution.
Moreo ver small areas of “gro und glass” were missed 3
times, misinterpreted as blurring.
It might be useful to consider performing MRI at the
end of inspirati on, or using a FR FSE T2 without fat sat
to visualize the parenchyma [7,11,12] in order to reduce
these limiting factors.
However, because of the excellent contrast resolution,
MR examinations show immediate results and are even
more accurate in revealing lymph node involvement,
pleural abnormalities and parenchymal caseation than
unenhanced CT.
Indeed, MRI indicated nodal involvement in 14
patients and parenchymal caseation in 4 of these, fea-
tures not clearly identified by the CT. However, the CT
examination was unenhanced, thus could not allow for
correct diagnosis. To our knowledge, no i nvestigators
have focused on the MRI fea tures of thoracic tubercu-
lous lympadenopathies. In our series, 89% were slight
hyper-intense, 7% were isointense with peripheral hyper-
intensity, and 3.5% were highly hype r-intense compared
with the thoracic wall muscle. Signal intensity may differ
depending on the stage of evolution, where slight hyper-
intensity may indicat e lymphoid hyperplasia related to
inflammation, high hyper-intensity is suggestive of lique-
factive necrosis, and central isointensity associated with
peripheral hyper-intensity may indicate caseosis. All
these findings are in line with previous reports regarding
Figure 7 61 year-old woman with pulmonary tuberculosis.A)
HRCT shows cavited infiltrate. B) Unenhanced MRI identifies the
same features as well as HRCT and identifies subtle, free pleural
effusion, and a highly hyper-intense mediastinal lymph node.
Figure 8 53 year-old woman with pulmonary tuberculosis.A)
HRCT, reconstructed for mediastinum, shows an enlarged
pretracheal lymph node, B) Unenhanced MRI also depicts lymph
node caseosis.
Table 2 Detection and percentage of pulmonary
involvement in 60 HRTC and 60 MRI images
Location Score 0 Score 1 Score 2 Score 3 P value
CT MRI CT MRI CT MRI CT MRI
Right lung
Upper zone 224 224 33 33 3 3 32 24 0.79 (ns)
Middle zone 48 48 33 24 40 24 16 16 0.40 (ns)
Lower zone 265 249 40 57 8 9 9 10 0.31 (ns)
Left lung
Upper zone 116 116 40 40 48 48 182 182 1 (ns)
Middle zone 24 24 24 24 32 24 74 83 0.64 (ns)
Lower zone 99 88 107 116 40 32 16 25 0.27 (ns)
0 = no involvement
1 = < 25%,
2 = 25%-50%,
3 = > 50%.
Busi Rizzi et al. BMC Infectious Diseases 2011, 11:243
/>Page 6 of 7
abdominal tuberculous lymphadenopathy that correlated
histological data with MRI features [13].
Because of its excellent contrast resolution, MRI is
superior to CT in assessing pleural involvement [14].
Indeed, MRI promptly depicted pleural abnormalities with
a higher percentage than CT (35% vs. 17%) with the same
immediateness for subtle or loculated effusions (not seen
on CT) and pleural hyp er-intensity, consistent with early
sicca inflammation, which was never observed on CT.
From our experience, MR was not only useful for inte-
grating diagnostic evaluation of the lung, but the results
of our study even suggest that MRI could replace CT in
assessing lung tuberculosis in s ome subsets of patients
such as children, women, during pregnancy (MR ima-
ging should be avoided during the first trimester), follow
-ups, or as an alternative to CT for patients w ith aller-
gies to IV contrast material. Performing MRI in children
with TB may also prove to be interesting since they may
have lymph node involvement rather than lung involve-
ment; however it should be taken into account that
anaesthesia may be required.
Conclusion
We believe that MRI is comparable to CT for identify-
ing morphological pulmonary changes, and that MRI is
clearly superior to CT regarding tissue characterization.
Furthermore, on the basis of lesion signal intensity, MRI
could differentiate the exudative stage of lung TB from
the relatively acellular fibrotic phase because of the rela-
tively “short T2” in fibrotic tissues [15].
The shortcomings of our study are the limited number
of patients an d the absence of miliary and calcified
nodules found in the enrolled patients, thus it could not
be proved that these lesions can be identified by MRI.
The l ack of histopathological correlation or microbiolo-
gical tests of the adenopathies is another important lim-
itation of the study, and MRI in the phase of expiration
may show non-pathological processes such a s small
laminar atelectasis. Moreover, further studies are needed
to determine whether the use of FR FSE T2 sequences
without fat sat might improve visualization of the
parenchyma.
Acknowledgements
The authors are grateful to all the patients, nurses and technicians (in
particular M.R.Longo, D.Di Bartolomeo, M.Bianchetti, M.Morea, V.Possanzini)
who took part in the study. The authors thank Ms Andrea Baker for editing
the manuscript.
Author details
1
Diagnostic Department, Radiology. “L. Spallanzani” National Institute for
Infectious Diseases Rome ITALY.
2
Research Department, Translational
Research Unit. “L. Spallanzani” National Institute for Infectious Diseases Rome
ITALY.
3
Clinical Department. National Institute for Infectious Diseases “L.
Spallanzani” Rome.
4
Epidemiology Department, “L. Spallanzani” National
Institute for Infectious Diseases Rome ITALY.
Authors’ contributions
EBR and VS have made substantial contributions to the conception and
design, acquisition, analysis and interpretation of data, and also drafted the
manuscript; MC carried out the radiological examination; EG was responsible
for the statistical analysis; DG enrolled the patients and drafted the
manuscript; FP, NB were responsible for patient selection and enrolment;
DG, EG, FNL, CB revised the manuscript critically for important intellectual
content.
All authors have read and approved the final manuscript.
Competing interests
The authors declare that they have no competing interests.
Received: 11 August 2010 Accepted: 16 September 2011
Published: 16 September 2011
References
1. Leutner CC, Gieseke J, Lutterbey G, Kuhl CK, et al: MR Imaging of
Pneumonia in Immunocompromised Patients: Comparison with Helical
CT. AJR 2000, 175:391-397.
2. Eibel R, Herzog P, Dietrich O, Rieger CT, et al: Pulmonary Abnormalities in
Immunocompromised Patients: Comparative Detection with Parallel
Acquisition MR Imaging and Thin-Section Helical CT. Radiology 2006,
241:880-891.
3. Herold CJ, Kuhlmann JE, Zerhouni EA: Pulmonary Atelectasis: Signal
Patterns with MR Imaging. Radiology 1991, 178:715-720.
4. Eibel R, Herzog P, Dietrich O, Rieger CT, Ostermann H, Reiser M,
Schoenberg S: Magnetic Resonance Imaging in the Evaluation of
Pneumonia. Radiology 2006, 46:272-274.
5. McFadden RG, Carr TJ, Mackie IDF: Thoracic Magnetic Resonance Imaging
in the Evaluation of HIV-1/AIDS Pneumonitis. Chest 1992, 101:371-374.
6. Lutterbey G, Gieseke J, von Falkenhausen M, Morakkabati N, Schild H: Lung
MRI at 3.0T: A Comparison of Helical CT and High-Field MRI in the
Detection of Diffuse Lung Disease. Eur Radiol 2005, 15:324-328.
7. Eichinger M, Heussel CP, Kauczor HU, Tiddens H, Puderbach M: Computed
Tomography and Magnetic Resonance Imaging in Cystic Fibrosis Lung
Disease. J Magn Reson Imaging 2010, 32(6):1370-8.
8. Ley-Zaporozhan J, Puderbach M, Kauczor HU: MR for the Evaluation of
Obstructive Pulmonary Disease. Magn Reson Imaging Clin N Am 2008,
16(2):291-308.
9. Kauczor HU, Ley-Zaporozhan J, Ley S: Imaging of Pulmonary Pathologies.
Focus on Magnetic Resonance Imaging. Proc AM Thorac Soc 2009,
6:458-463.
10. Busi Rizzi E, Schininà V, Gentile FP, Bibbolino C: Reduced Computed
Tomography Radiation Dose in HIV-related Pneumonia: Effect on
Diagnostic Image Quality. Clin Imaging 2007, 31(3):178-184.
11. Puderbach M, Hintze C, Ley S, Eichinger M, Kauczor HU, Biedere J: MR
Imaging of the Chest: A Practical Approach at 1.5 T. E J Radiol 2007,
64:345-355.
12. Lutterbey G, Grohè C, Gieseke J, von Falkenhausen M, et al: Initial
Experience with Lung-MRI at 3.0T: A Comparison with CT and Clinical
Data in the Evaluation of Interstitial Lung Disease Activity. E J Radiol
2007, 61:256-261.
13. De Backer AI, Mortelè KJ, Van Den Heuvel E, Vanschoubroeck IJ, Kockx MM,
Van de Vyvere M: Tuberculous Adenitis: Comparison of CT and MRI
Findings with Histopathological Features. Eur Radiol 2007, 17:1111-1117.
14. Knisely BL, Broderick LS, Kuhlman JE: MR Imaging of the Pleura and Chest
Wall. Magn Reson Imaging clin N Am 2000, 8:125-41.
15. Berthezene Y, Vexler V, Kuwatsuru R, Rosenau W, Muhler A, Clement O,
et al: Differentiation of Alveolitis and Pulmonary Fibrosis with a
Macromolecular MR Imaging Contrast Agent. Radiology 1992, 185:97-103.
Pre-publication history
The pre-publication history for this paper can be accessed here:
/>doi:10.1186/1471-2334-11-243
Cite this article as: Busi Rizzi et al.: Detection of Pulmonary tuberculosis:
comparing MR imaging with HRCT. BMC Infectious Diseases 2011 11:243.
Busi Rizzi et al. BMC Infectious Diseases 2011, 11:243
/>Page 7 of 7