Credit Access for Small and Medium Firms Survey Evidence for Ireland doc
Bạn đang xem bản rút gọn của tài liệu. Xem và tải ngay bản đầy đủ của tài liệu tại đây (537.29 KB, 36 trang )
11/RT/11
Credit Access for Small and Medium Firms
Survey Evidence for Ireland
Martina Lawless and Fergal McCann
Credit Access for Small and Medium Firms: Survey Evidence
for Ireland
Martina Lawless and Fergal McCann
∗
Central Bank of Ireland
Abstract
The extension of credit to SMEs in Ireland has been identified as a necessary condition for economic
recovery and job growth. The debate on whether the reduction in credit to this sector is caused
by credit rationing by banks or a lack of credit demand on the part of SMEs has received much
attention in media and policy circles. Owing to a lack of relevant available micro-data, research on
this issue in I reland has been sparse to date. The aim of this paper is to provide evidence using
recently available firm-level data from the Central Statistics Office and the European Central Bank.
Using the CSO data, we find a moderate decline in credit applications, coupled with a very large
increase in credit rejection rates. Using firm-level production data, we find no evidence that the
accepted firms have been pooled according to firm performance - more productive and fast-growing
firms are as likely to be rejected as any other firm. Using the ECB data, we show that Irish firms
are 15 to 18 percent more likely to be rejected for credit than a comparable Eurozone SME. We
show also that Irish firms are less likely to have had decreased credit demand than other Eurozone
SMEs in the 2009-10 period.
∗
The authors would like to thank the Central Statistics Office for access to the anonymised micro-data
used in this analysis, and in particular Kevin Phelan and Catalina Gonz´alez for their help with the data.
We would also like to thank Sarah Holton for assistance with the SAFE data and Trevor Fitzpatrick,
Ciar´an Mac an Bh´aird, Kieran McQuinn, Ken O’Sullivan, Gerard O’Reilly and Ian Talbot for comments,
along with participants at the Statistical and Social Inquiry Society of Ireland meeting in October 2011
at which this paper was read. The views expressed in this paper are our own, and do not necessarily
reflect the views of the Central Bank of Ireland or the ESCB. E-mail: or
2
Non Technical Summary
Ireland experienced an unprecedented credit boom in the years leading up to 2008, before contracting
sharply, falling by 18% over the past two years. This paper uses firm level data to assess how s mall
and medium enterprises (SMEs) perceive current credit conditions and takes some tentative steps
towards disentangling the relative effects of changes in supply versus demand in explaining the
change in credit.
SMEs account for a considerable proportion of economic activity in most countries. The SME
group accounts for the vast majority of enterprises in the EU and employs more than half of the
labour force. To date, it has been difficult to assess how the difficulties in the banking sector
have been impacting on SMEs. The available data on firms’ interactions with the credit market
is limited, with even the most comprehensive Irish firm-level datasets providing no information on
firms’ finances or borrowings.
This paper presents analysis of two surveys of Irish SMEs, both of which draw their samples
from the whole relevant population and thus provides the first objective evidence on firms’ demand
for credit and experience of supply decisions.
Using the Access to Finance survey carried out by the Central Statistics Office, we place the
changes in the Irish SME credit market between 2007 and 2010 in a European context. We find
that, even controlling for decreases in GDP, the tightening in Irish credit supply appears among the
most extreme in Europe. We then match the survey data with quantitative information from other
CSO sources and use it to compare the characteristics of rejected and accepted firms along a number
of performance dimensions, such as productivity, sales, growth and the firm’s relative position in
their sector. This allows us to determine if there is evidence of sorting by quality of the firms that
successfully accessed credit in 2010. No statistically significant differences could be found between
accepted and rejected firms on the basis of observable firm characteristics.
The second set of data is the Survey of Access to Finance in Europe (SAFE) which is a biannual
survey carried out by the European Central Bank across all Euro member states. We make use of
this data to compare Irish firms to similar Eurozone firms using matching techniques. This allows
us to address the question of whether Irish firms are different from comparable Eurozone firms in
terms of their changes in credit demand in 2009-10 and the degree to which they have been rationed
credit. We find that firms in Ireland are less likely to have decreased their demand for credit than
comparable firms in the Euro area as a whole or when compared to the peripheral crisis countries.
Irish firms are also significantly more likely to have been refused credit than their counterparts
elsewhere.
1 Introduction
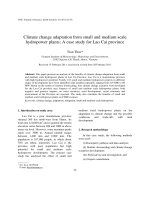
Ireland experienced an unprecedented credit boom in the years leading up to 2008. Outstanding
credit to private sector Irish resident firms grew by 194% beween 2003 and the peak in March
2009, as shown in Figure 1. Since then, credit has contracted sharply, falling by 18% in two years
(March 2009 to March 2011). This is in part explained by the need to reduce the size of the Irish
banking sector and move away from unsustainable loan-to-deposit ratios, as specified in the F inancial
Measures Programme
1
:
The Central Bank has agreed with the External Partners that a sustainable Loan to
Deposit Ratio for the aggregate domestic banking system is 122.5%, meaning a surplus
of some e70bn of loans. Deleveraging these loans will reduce dependence on wholesale
funding and set the foundation for a sustainable banking sector.
In order to protect the domestic economy from the negative effects of this deleveraging process, the
Programme emphasises that the deleveraging is to come from “‘non-core” assets, and not from “core
portfolios” which would continue “to service the retail, SME and corporate banking requirements
of the Irish economy.” In an effort to ensure that small and medium enterprises (SMEs) would
continue to b e able to access credit, an annual lending target of e3bn was established for the two
main banks as part of recapitalisation requirements. However, the Credit Review Office (CRO 2011)
says it will be a “challenge” for this target to be met. This paper uses firm level data to assess how
SMEs perceive current credit conditions and takes some tentative steps towards disentangling the
relative effects of changes in supply versus demand.
We focus on SMEs for a number of reasons.
2
SMEs account for a considerable proportion of
economic activity in most countries. Even prior to the current financial crisis, the funding opportu-
nities and constraints of this type of firm had been of interest to economists and policy-makers. The
SME group accounts for the vast majority of enterprises in the EU and employs more than half of
the labour force. In Ireland, SMEs account for 99% of firms and employ 68% of workers (European
Commission, 2009b).
The SME sector makes up a significant proportion of employment but, as a sector it is char-
acterised by a greater degree of output and profit volatility than larger enterprises. They are also
more liable to failure; manufacturing firms with fewer than 20 employees have been found to be five
1
Online version of report available at />institutions/Documents/The%20Financial%20Measures%20Programme%20Report.pdf
2
We follow the European Commission definitions of a small firm as one employing fewer than 50 employees
and a medium fir m as having between 50 and 250 employees (European Commission, 2009a).
1
times more likely to fail in a given year than larger firms (OECD, 2006). This is the case even in
times of stable economic growth. In times of recession or crisis, SMEs are particularly vulnerable
as their limited diversification and dependence on short-term credit give them much less of a buffer
against demand falls than are available to larger firms (OECD, 2009). Furthermore, SMEs have
limited internal resources and little or no direct access to capital markets and they thus tend to rely
mainly on banks for funding. As a result, the fall in bank credit is likely to impact SMEs much more
directly than larger firms.
Given the previous reliance of Irish economic growth on Foreign Direct Investment and latterly
on property and construction, the development of a productive, innovative and internationalised
indigenous SME sector has become a key national policy objective. Central to the debate on the
growth of this sector has been the issue of access to finance. The importance of the issue is made
clear by Deputy John Perry, Minister of State at the Department of Jobs, Enterprise and Innovation
in a D´ail debate on the SME sector on 19 July 2011
3
:
The availability of credit to viable businesses is a recurring challenge that has hampered
new or expanding firms from developing new products and markets, and thereby pro-
tecting or creating jobs. This is a challenge the Government is determined to address.
To date, it has been difficult to assess how the difficulties in the banking sector have b een impacting
on SMEs. The available data on firms’ interactions with the credit market is limited, with even
the most comprehensive Irish firm-level datasets providing no information on firms’ finances or
borrowings. The debate on credit access has therefore been dominated by anecdotal evidence and
disagreement on whether the observed fall in aggregate credit is due to reduced demand from firms
or from banks restricting supply.
On the “reduced supply” side of the debate, a number of ad-hoc surveys have been carried
out showing impressions of tightened credit standards by banks. A survey of its members by the
Institute of Certified Public Accountants in Ireland (CPA), carried out in July 2011, reported that
87% believe banks are not “open for business”.
4
In addition, 61% of CPA members gave their
opinion that viable businesses had been refused credit. Another survey by the Irish Small and
Medium Enterprises Association (ISME), found that of its members, 30% applied for credit in the
second quarter of 2011, and 54% of these were refused.
5
On the other side of the debate, the Credit Review Office (CRO) and Banking Industry Fed-
eration maintain that banks are willing to lend, but that there has been a major fall in demand
3
Transcript available here: />4
Press release available at />5
Press release available at />2
Figure 1: Credit to Irish Private-Sector Firms
50000 100000 150000 200000 250000
Outstanding Credit Euro millions
Mar−03 Mar−04 Mar−05 Mar−06 Mar−07 Mar−08 Mar−09 Mar−10 Mar−11
Date
Total
Total ex Financial Intermediation
Total ex Financial Intermediation and Property Related Sectors
since the recession began (see for example the CRO’s 5th Quarterly Report). A survey of banks in
Ireland, the Bank Lending Survey
6
, carried out by the Central Bank found reports of credit stan-
dards tightening between 2008 and 2010 and remaining unchanged since July 2010. This survey also
reported credit demand falling from 2008-10, and stabilising since late 2010.
Figures from surveys focusing on members of trade associations and lobby groups may not always
be representative of the experiences of the wider body of firms but, up until now, little information
from disinterested sources has been available. This paper presents analysis of two surveys of Irish
SMEs, both of which draw their samples from the whole relevant population and thus provides the
first objective evidence on firms’ demand for credit and experience of supply decisions.
The first survey is the Access to Finance survey carried out by the Central Statistics Office.
It collected information on the change in credit application and rejection rates for a representative
sample of Irish SMEs between 2007 and 2010. We find a relatively small decrease in loan application
rates over the period. On supply, we first compare the changes in the Irish figures over the period
to European countries in which an identical survey was carried out. This suggests that no other
country in Europe has seen as big a r elative increase in loan rejection rates, and only Bulgaria has a
lower absolute rejection rate than Ireland in 2010. We then match the Irish data with quantitative
information from other CSO sources and use it to compare the characteristics of rejected and accepted
6
/>3
firms along a number of performance dimensions, such as productivity, sales, growth and the firm’s
relative position in their sector. This allows us to determine if there is evidence of sorting by quality
of the firms that successfully accessed credit in 2010. No statistically significant differences could be
found between accepted and rejected firms on the basis of observable firm characteristics.
The second set of data is the Survey of Access to Finance in Europe (SAFE) which is a biannual
survey carried out by the European Central Bank across all Euro member states. Currently four
waves of the survey are available. We make use of this data to compare Irish firms to similar
Eurozone firms using matching techniques. This allows us to address the question of whether Irish
firms are different from comparable Eurozone firms in terms of their changes in credit demand in
2009-10 and the degree to which they have been rationed credit. We find that firms in Ireland are
less likely to have decreased their demand for credit than comparable firms in the Euro area as a
whole or when compared to the peripheral crisis countries. Irish firms are also significantly more
likely to have been refused credit than their counterparts elsewhere.
One variable for which we cannot control is the degree to which Irish SMEs are over-leveraged.
Given the extent of the credit and construction boom in Ireland up to 2007, it is eminently possible
that Irish SMEs have accumulated higher levels of debts that other European firms. On account of
this fact, it is prudent to interpret our estimates as upper bounds on the probability of rejection due
solely to the firm being Irish, with the potential that a certain proportion of the Irish coefficient is
in fact explained by property-related over-leverage. One finding that mitigates this concern comes
from comparisons between Irish rejection rates and those of Baltic states which experienced similar
credit booms to Ireland in the past decade. These comparisons suggest that, even when considering
countries with a very similar previous economic pattern, Irish rejection rates appear to be high.
Additionally, an analysis of the reasons for rejection shows that one-fifth of Irish SMEs were rejected
due to over-leverage, leaving four-fifths of firms who were rejected for other reasons, including 15
percent who were rejected for no reason. The question of SME leverage in Ireland will require more
detailed firm-level data in order to be comprehensively addressed.
The remainder of the paper is structured as follows. Section 2 discusses some previous work on
SME credit constraints. Section 3 presents the evidence from the CSO Access to Finance survey
and Section 4 focuses on the SAFE results. Section 5 concludes.
2 SMEs and Credit Constraints: Background
Credit constraints have been defined by the OECD (2006) as occurring when SMEs cannot obtain
financing from banks, capital markets or other suppliers of finance even when they have the capability
4
to use those funds productively. In a situation where economically viable projects may have to be
restricted or even abandoned because of funding difficulties, this has the potential to have serious
negative consequences for ongoing innovation and growth. It is this potential scenario that motivates
the concern for identifying and measuring whether SMEs are credit constrained and, if they are, if
there is any way that these constraints can be alleviated.
The greater difficulty of smaller firms in accessing credit relative to larger firms revolves around
differences in risk profile and information asymmetries between the firm and lending institution
(OECD, 2006). It can be difficult for SMEs to convince banks of the quality of their business
plans and, for newer firms in particular, it can take a considerable amount of effort to build a
reputation that signals that they are low risk. From the bank’s point of view, the costs involved in
assessing and monitoring SMEs act as a disincentive to funding this market. For larger institutions,
transactions lending that relies on financial statements of firms as an information source is often
preferred. Furthermore, SMEs often have less collateral that could protect creditors (ECB, 2007).
Banks may, in some circumstances, prefer to ration credit rather than use interest rate changes
to compensate for risk if there are concerns that this might result in adverse selection and hence a
riskier loan portfolio (OECD, 2006). The conceptual framework of Berger and Udell (2006) suggests,
however, that the above difficulties can be mitigated if banks use alternative transactions lending
technologies such as using credit scoring data, asset-based lending and factoring
Research on the funding of SMEs in Ireland has been relatively limited due primarily to a lack of
sufficient data. Ad hoc survey methods have been used to gain some information on the existence of
financing constraints. Personal sources of financing of the proprietor and external debt collateralised
by personal assets were found to be important sources of finance by Mac an Bhaird and Lucey (2006)
in their survey of 275 small firms. This was particularly the case for younger firms, with retained
earnings becoming a more significant source of funds for established firms. Most firms (86%) in
this sample reported that banks were willing to provide overdraft funding but no more detailed
information on credit constraints or loan turndown was collected.
Mazars (2009) published an independent report commissioned by the Government to examine
the availability of credit to SMEs in Ireland, in the face of widespread anecdotal reports that the
banking crisis was negatively impacting business credit. Of the firms surveyed for the report, 52%
reported that they were refused credit in the last 12 months. When queried about the reasons given
by banks in turning down loan applications, the firms reported that they were told there had been
“a change in bank lending policy” and “the sector in which the business operates is no longer a
sector to which the bank is prepared to lend”. The latter was particularly the case when the firm
operated in the real estate, construction and manufacturing sectors.
5
This paper contributes to the literature on SME credit in Ireland both by utilising two new
data sources and by approaching the issue of credit demand and credit supply using separating
equilibrium t-tests and propensity score matching.
3 CSO Access to Finance Survey
3.1 Data Description
The Central Statistics Office carried out an Access to Finance survey covering Irish SMEs in 2010,
with the results released in May 2011 (CSO 2011). The total sample was 800 firms, drawn from
firms that had employed b etween 10 and 249 people in 2005 and continued to employ at least 10
people when the survey was carried out. The questionnaire related to firm activities in 2010 and
retrospective questions were asked about financing in 2007. All of the firms were independent entities
(i.e. no subsidiaries were included on the assumption that financing decisions would primarily b e
taken in the group headquarters). The Access to Finance survey contains qualitative information
on the type of finance that the firm tried to obtain, the outcome of their application and their
impression on how financing standards had changed.
The CSO assigns each firm an unique identifying number that enabled us to merge the results
of the Access to Finance survey with two other sources of data. Depending on their sector, the
firm finance information was matched to either the Census of Industrial Production or the Annual
Services Inquiry (see CSO 2008 and CSO 2009 for full descriptions of these surveys). Both of these
sources provide quantitative data on production, productivity, employment and international trade.
We were able to match 635 of the firms to one of these other surveys.
7
The Census of Industrial
Production data used covered 2005 to 2009, while the Annual Services Inquiry covered 2005 to 2008.
Given that the firm information is therefore lagged either one or two years relative to the financing
information, we will concentrate on broad measures of firm quality that are likely to be persistent.
There is an implicit assumption here that the sho cks hitting the economy would have had symmetric
effects on firms operating within the same sector (defined at the NACE2 level).
A number of other caveats are worth noting before moving to the survey results. The first is that
there is a “survivor bias” to be b orne in mind, particularly when looking at the retrospective results,
as we cannot observe any firms that exited since 2007 and these may have been firms more likely
to have had difficulty accessing credit at that time. Thus our findings on credit supply for 2007 are
7
The unmatched firms were primarily in either constru ction which is not included in either dataset or in
services as the Annual Services Inquiry does not provide a full census of firms with under 20 employees.
6
likely to understate the true rejection rate. The second item to note is that when we observe a firm
that did not apply for any type of finance, we do not have any further information on the reasons
for not applying. Therefore, we are unable to distinguish between firms that had sufficient internal
resources and did not need any external financing from those that did not apply because they felt
that an application was bound to be rejected. There is also no separation of questions relating
to new loans from those restructuring existing credit arrangements, so we cannot tell if these are
being treated differently by the banks. As mentioned in the Introduction, we cannot identify firms’
leverage in the data. Therefore, over-indebtedness as a factor explaining rejection is not included in
our T-tests.
3.2 Summary of Credit Demand and Supply
Out of the total sample, approximately 200 firms applied for loan financing in each of the two years
referred to in the survey. In 2007, 37.2% of firms applied for loan finance and in 2010 this had fallen to
30.7%. This shows a reasonably significant reduction in the demand for credit, but given the extent
of the fall in economic activity between 2007 and 2010, it does not suggest that credit demand has
“fallen off a cliff”. Unfortunately, as we pointed out in the previous subsection, we cannot tell how
much of this reduction might be due to discouraged borrowers relative to the reduction coming from
a drop in investment opportunities. However, if there was a widespread perception amongst firms
that credit was being restricted, one might have expected a larger reduction in credit applications.
Turning to credit supply, Table 1 s hows the breakdown of the outcome of applications for bank
credit in both 2007 and 2010. The survey allows firms to indicate if they had been successful,
unsuccessful or if the application had been “partially” successful.
8
As we can see, the level of
unsuccessful applications in 2007 is close to negligible, with under 2% rejected and only a further 3%
granted less credit than they had applied for. The change in the percentage of successful applications
fell from slightly over 95% in 2007 to just under 57% in 2010. The rejection rate increased to almost
a quarter, while a further 19% of firms were partially successful in their applications.
Table 2 broadens the definition of financing from bank loans to also include other official financing
sources such as overdrafts and non-bank financial institutions. The success rate for these wider
financing options was higher than for bank loans alone, with over 67% of firms accessing some type
of credit. However, this still contrasts strongly with the 96% success rate in 2007. These figures
can be benchmarked against European comparator countries, as the Access to Finance survey was
8
No further questions are asked about the extent of the “partial” success in terms of the percentage of
credit applied for that was actually granted.
7
Table 1: Access to Bank Loans
Unsuccessful Partial Successful
No. % No. % No. % Total
2007 4 1.96 6 2.94 194 95.10 204
2010 44 24.72 33 18.54 101 56.74 178
Table 2: Access to All Loan Sources
Unsuccessful Partial Successful
No. % No. % No. % Total
2007 2 0.83 8 3.33 230 95.83 240
2010 36 16.67 35 16.20 145 67.13 216
carried out as part of a wider European Commission study. Tables 22 and 23 give the results for the
same study carried out in twenty European countries. Table 22 shows that Ireland had the second
highest acceptance rate in Europe in 2007, which one might argue was certainly overly profligate.
However, Table 23 shows that, relative to European comparator countries, Irish SM Es appear to
be experiencing particular difficulties in accessing financing in 2010. As Table 24 makes apparent,
no other country has seen a similar fall in its position on the acceptance rate ranking, with Ireland
falling from the 2nd highest to 19th highest acceptance rate, which points to an over-correction
relative to 2007 lending levels. Looking at pure rejection rates, i.e. considering “partially accepted”
firms as part of the “accepted” category, does not alter this picture. Looking at further international
comparable data sources, a survey of firm bank applications carried out in Latvia, Estonia, Hungary
and the Czech Republic showed similarly high acceptance rates in 2005 to those we find in the 2007
results for Ireland. Loan rejection rates increased significantly when the survey was repeated in 2009,
with rates that ranged from 7% in Hungary to 21% in Latvia.
9
Even this most extreme contraction
in Eastern Europe does not match the increase in Irish rejection rates recorded in Tables 22 to 24.
9
Authors’ calcuations using World Bank/European Bank for Reconstruction and Development survey
data, details available on request. See appendix, Table 25 and 26 for summary statistics on the Baltic and
UK results.
8
Figure 2: Change in acceptance rate versus change in output.
Belgium
Bulgaria
Denmark
Finland
France
Germany
Greece
Ireland
Italy
Latvia
Lithuania
Luxembourg
Netherlands
Poland
Slovakia
Spain
Sweden
United Kingdom
−50 −40 −30 −20 −10 0
Change in acceptance rate 2007−2010
−20 −10 0 10
Percentage change in GDP 2007−2010
acceptchange Fitted values
UK evidence also shows a sharp increase in rejection rates in SME applications for credit from 6.1%
in 2001-04 to 16.3% in 2008, but even for the riskiest group of firms the rejection rates do not reach
Irish levels (Frazer, 2010). Of importance here is that the Baltic States and the UK are comparable
to Ireland in that there were large credit and construction booms in all these countries in the past
decade. The fact that Ireland has higher rejection rates than any of these countries helps alleviate
concerns that our extreme findings for Ireland are purely explained by property-related over-leverage
of Irish SMEs.
One could claim that a large fall in Irish SME credit acceptance rates is to be expected, given
the significant fall in output experienced since the onset of the economic crisis in 2007. We address
this issue in Figure 2 by plotting a linear fit of changes in loan acceptance rates on changes in output
for each country reported in Table 22 and 23. This plot shows a positive relationship, with larger
contractions in output associated with larger declines in the acceptance rate. Importantly from the
point of view of our analysis, Ireland is found significantly below the fitted line, indicating that
the decline in credit acceptance rates is larger than that expected given the decline in output. For
robustness, Figure 3 in the Appendix plots a similar relationship, looking at the pure rejection rate
rather than the pure acceptance rate. The picture does not change, with Ireland now lying above
the fitted line in this case, indicating that this finding is robust to the category in which partially
accepted firms are placed.
Looking at a breakdown by broad sector in Table 3, we do not observe any major difference
between manufacturing and services. Both sectors show a success rate close to two-thirds for appli-
9
Table 3: Finance by Broad Sector
Manufacturing % Services %
Unsuccessful 8 19.51 21 15.33
Partial 5 12.20 27 19.71
Successful 28 68.29 89 64.96
Total 41 100.00 137 100.00
cations for our broader definition of financing in 2010.
3.3 Testing Credit Allocation
We have seen that there was a sharp increase in rejection rates, particularly for bank loans, during
the recession. However, this alone is not sufficient evidence of a credit crunch. The OECD definition
of credit constraints in Section 2 included an important proviso that it applied to firms that have the
capability to use those funds productively. Given the extent of the fall in economic activity between
2007 and 2010, a reduction in credit could be a reflection of a lack of investment opportunities that
banks feel have a reasonable probability of success. If this is the case, the rejections could be largely
a function of an increased risk profile and the refusals entirely prudent.
It is difficult to gauge empirically the strength of this argument. There are many firm char-
acteristics that are unobservable in the data and extremely limited information on the purpose for
which financing is sought. That said, the question of how credit is being allocated to SMEs is of
such importance that every attempt to shed light on the process should be examined, even if the
data cannot address all facets of the issue.
While it is impossible to quantitatively model all factors that should influence a bank’s lending
decision, we can make inferences from tests of the data available to us. We take as our working
hypothesis that if the banking sector is “correctly” allocating credit, we should see a performance gap
between rejected and accepted firms. On the other hand, if credit is being rationed in a “blanket”
fashion, then rejected and accepted firms will not appear to be any different from one another.
In order to do this, we pool the data into two groups:
• Firms fully successful in obtaining finance.
• Firms partially successful or unsuccessful.
10
We then perform T-tests to examine if the means are the same across these two groups for a number
of measures of firm performance. The first measures that we look at are labour productivity, labour
productivity as a percentage of the frontier (most productive) firm in a sector, sales and sales
growth. To define the frontier firm in the two relative measures, we make use of the full coverage
of the Census of Industrial Production and Annual Services Inquiry for each sector at the NACE2
level. Assuming that the economic shocks of the past few years were symmetric within each narrow
sector, each firm’s position relative to the frontier should be reasonably stable over time. Table 4
Table 4: Productivity and Growth by Loan Outcome
Unsuccessful Successful p-value N
/Partial
Labour Productivity 2008 11.76 11.71 0.67 178
LP % of Frontier, 2008 0.73 0.74 0.71 178
log Sales, 2008 8.26 8.31 0.80 178
Sales growth 2008 0.0002 0.0328 0.48 123
presents T-tests comparing the means of successful and unsuccessful applicants for finance for each
performance measure. The hypothesis being tested is that the means are equal between rejected
and accepted firms.
For all four of the indicators of firm quality, we find no evidence of significant differences between
firms that were successful and those that were unsuccessful in their credit applications. In terms of
labour productivity, they actually appear to perform worse than those firms that are unsuccessful or
partially successful, while in terms of distance to frontier, they appear only marginally stronger (in
no case is a result statistically significant). We also look at sales growth as a proxy for the growth
potential of the firm, which is something that a lender is expected to take account of when deciding
on capital allocation. We see that the successful firms in 2010 do appear to have been growing at a
faster rate in 2007-08 than those who did not obtain their desired financing. This difference however
is a long way from being statistically significant. This suggests that there is little sorting by quality
taking place, at least not on the basis of these measures of past firm performance. For roubstness,
the tests of Table 4 were replicated, redefining the “successful” category to include both those firms
that were fully or partially unsuccesful. Table 21 again finds no statistically significant differences
between accepted and rejected firms.
Research in the field of international trade has consistently shown that exporters perform better
11
than non-exporters along a wide range of firm characteristics. We therefore examine the composition
of the 2010 loan finance success rate by firms’ exporter status. As above, the working hypothesis is
that if the banks are correctly allocating capital according to risk, exporters should be more success ful
in obtaining loans than their counterparts serving only the domestic Irish market. Echoing our
findings using productivity measures, we see in Table 5 that there appears to be no discrimination
on firm “quality” - exporters are just as likely as non-exporters to be uns uccessful in their applications
for loan finance in 2010. Both exporters and non-exporters have a rate of rejection of 16%, with
almost identical rates for partial and successful applications as well. Table 6 presents an alternative
Table 5: Export Status and Loan Outcome
Non-Exporter % Exporter %
Unsuccessful 23 16.31 6 16.22
Partial 26 18.44 6 16.22
Successful 92 65.25 25 67.57
Total 141 100.00 37 100.00
measure by examining the breakdown of the access to finance variable according to the quartile in
which the firm resides in its NACE 2 industry’s labour productivity distribution in 2008. We again
see that, for each quartile, the rates of acceptance are roughly similar. The firms that are most
productive in their sector are more likely to be partially accepted for a loan, but are in fact less
likely than other firms to be fully successful.
Table 6: Productivity Distribution and Loan Outcome
Quartile of firm’s NACE2 Labour Productivity in 2008
1st % 2nd % 3rd % 4th %
Unsuccessful 4 17.39 10 20.41 8 17.39 7 13.73
Partial 4 17.39 6 12.24 8 17.39 13 25.49
Successful 15 65.22 33 67.35 30 65.22 31 60.78
Total 23 100 49 100 46 100 51 100
12
3.4 The reasons for rejection
For those firms rejected for bank loans in 2010, the sur vey asks which (if any) reasons were given
by the bank for the rejection decision. Table 7 reports that too much debt already accumulated
by the SME was the most common reason for rejection in Ireland, and that Ireland was among
the countries where this reason was most prevalent. This over-leverage of Irish SMEs is potentially
linked to over-investment in property during the construction boom up to 2007, although data do
not allow us to identify the breakdown of over-leveraged firms between property and other types
of credit. The problem of debt overhang has been identified by many commentators
10
as the key
barrier to recovery from the current economic crisis. In light of such proclamations, the figures for
over-leverage appear worrying in the Irish context.
After over-leverage, the next most common reason for rejection in Ireland was “no reason”, with
Ireland having the highest share of firms in this category. That the share of firms rejected for no
reason was higher than that for insufficient collateral, a poor credit rating or risky potential of the
borrower points to a significant degree of credit rationing in the Irish SME market.
3.5 How big a problem is credit?
The evidence from the CSO survey shows a fairly dramatic decline in the success rate for SME loan
applications between 2007 and 2010. How big a problem is this for the firms? The survey asks
firms to pick the five factors that are most likely to limit their growth between now and 2013. Table
8 reports results for the most frequently identified factors. Unsurprisingly, the general economic
outlook is mentioned by almost all respondents. Perhaps more surprisingly, finance is picked as a
growth-limiting factor by just a quarter of firms. A number of other constraints were chosen as more
important than finance access, with 60% of firms reporting price competition/tight margins as an
obstacle, 53% reporting domestic demand and 50% reporting labour costs.
We look at how the question on finance as a future obstacle is broken down among our firms
that applied for a loan in 2010. Not surprisingly, Table 9 tells us that among unsuccessful firms in
2010, 75% believe financing will be an obstacle to growth between now and 2013. Among partially
successful firms, this figure falls to 43%, while among firms who were successful in 2010, 72% do not
believe finance will be an obstacle to growth. Notice that this sample is of 216, rather than the 635
in Table 8, as only 216 firms applied for external finance in 2010.
10
See e.g. Rogoff (2011) for a discussion of the effects of over-leveraged balance sheets of households,
governments and firms on the potential for economic recovery.
13
Table 7: Reasons given by bank for rejecting loan application. Countries with acceptance
rates greater than 80% are excluded.
Over- No reason Insufficient Poor Credit Risky
Leverage Collateral Rating Potential
Bulgaria 2.7 13.5 8.5 3.3 4.9
Denmark 5.7 4.5 12.5 0.2 1.8
Germany 6.2 9.4 13.4 13.6 5.2
Ireland 19.4 15.9 12.0 2.6 5.8
Greece 9.4 13.0 9.9 10.4 4.7
Spain 12.4 9.8 12.7 11.8 2.8
Italy 4.3 4.1 3.6 6.2 1.7
Cyprus 27.2 10.3 15.5 3.7 7.8
Latvia 18.4 8.5 9.5 0.1 4.9
Lithuania 8.7 10.6 11.0 12.5 5.2
Luxembourg 4.5 6.9 10.2 7.7 5.3
Netherlands 4.6 4.3 7.3 5.8 5.8
Slovakia 5.9 7.4 6.9 14.0 4.5
Sweden 8.9 6.4 6.9 6.6 6.6
UK 5.2 8.0 13.8 5.9 7.2
Table 8: Perceived Obstacles to Growth
Yes No
Price Competition 60.3 29.7
Regulation 33.3 66.7
Finance 25.2 74.8
Market Competition 47.2 52.8
Wage Costs 50.2 49.8
Domestic Demand 52.8 47.2
General Economy 89.8 11.2
3.6 Summary of findings: CSO’s Access to Finance Survey
The Access to Finance survey carried out by the CSO measured changes in the SME credit market
between 2007 and 2010. It showed a decline in credit demand, with the percentage of firms applying
14
Table 9: Perceived Finance Obstacle and Loan Experience
No Problem % Problem % Total
Unsuccessful 9 25 27 75 36
Partial 20 57.14 15 42.85 35
Successful 104 71.72 41 28.27 145
Total 133 61.57 83 38.42 216
for a bank loan falling from 37.2% in 2007 to 30.7% in 2010. The change in demand was fairly
modest however when compared with the sharp fall in approval rates for those firms that did apply.
We observe rejection rates up from 5% in 2007 to 43% in 2010 for bank loans and rejection rates of
33% for all credit. Using comparable data, we observe almost no other country in the EU that has
undergone a similar increase in loan rejection rates for SMEs.
We then examined if there was any evidence of sorting on firm quality between rejected and
accepted firms. Using a range of measures of past firm performance and position relative to others
in their sector, we could find no significant differences between the two groups of firms that could
explain the differing experiences with credit providers.
Despite the contraction in credit availability, access to finance is considered an important im-
pediment to future growth by a surprisingly small share of Irish SMEs. Broader concerns about the
economic climate, cost levels and the intensity of competition were all regarded as barriers to future
growth by a majority of firms, whereas finance was a key concern to approximately a quarter of
survey respondents.
4 The ECB survey ”Access to finance of small and medium-
sized enterprises” (SAFE)
4.1 The Data
Since 2009, the ECB has conducted four half-yearly waves of the SAFE survey of Eurozone-area
SMEs. The aim of the survey is to provide information on the financing needs of SMEs, their
experience in attempting to access finance, along with information on their perceptions of current
economic and financial conditions. The survey also asks firms to place their turnover, employment,
15
ownership type, age and sector of activity into categories. As one can see from Table 10, the
majority of the sample comes from four countries: Germany, Spain, France and Italy, for whom
the sample of firms is representative. The overall sample for all countries is also representative of
Eurozone SMEs, but for individual countries apart from those already mentioned, the samples are
not representative.
11
Table 10: Breakdown of SAFE survey sample size by survey round and country.
H1 2009 H2 2009 H1 2010 H2 2010 Total
Austria 224 203 200 500 1,127
Belgium 220 202 203 517 1,142
Germany 1,003 1,001 1,000 1,000 4,004
Spain 1,012 1,004 1,000 1,000 4,016
Finland 111 100 100 500 811
France 1,000 1,001 1,003 1,004 4,008
Greece 220 200 200 500 1,120
Ireland 110 101 100 500 811
Italy 1,006 1,004 1,000 1,000 4,010
Netherlands 323 252 256 502 1,333
Portugal 327 252 250 509 1,338
Total 5,556 5,320 5,312 7,532 23,720
Given the small sample size of Irish SMEs and the lack of representativeness of the sample,
comparisons of Irish survey responses to the SAFE survey across time are of little value. The authors
of the survey state that “the sample size in the other countries is too small to permit robust analysis
in each country separately”. We focus instead on cross-country comparisons in which Irish firms
are benchmarked against firms in comparator Eurozone countries using Propensity Score Matching
(PSM, explained in Section 4.2). The SAFE data allow us to compare both supply and demand of
SME credit in Ireland to Eurozone benchmarks. The aim of the empirical exercise on the supply
side is to ascertain to what extent Irish firms are being refused credit, relative to similar firms in
11
The sample was stratified by firm size class, economic activity and country.
16
comparable countries. On the demand side, we estimate the difference in the likelihood of credit
demand having changed in the previous six-month period for an Irish firm relative to a comparable
Eurozone firm. While the results of these models do not tell us anything about the absolute levels
of credit demand or credit supply in the Irish SME sector, they do give us a sense of the differing
nature of the Irish credit market relative to comparable benchmark countries. Table 11 gives the
breakdown of the following question in the survey, referring to bank credit:
If you applied and tried to negotiate for this type of financing over the past 6 months,
did you: receive all the financing you requested; receive only part of the financing you
requested; refuse to proceed because of unacceptable costs or terms and conditions; or
have you not received anything at all?
We code as “Rejected” all firms who r eceived only part of the requested financing, refused to proceed
or received nothing at all. Only firms that received all requested financing are coded as “Not
Rejected”. This is our measure of credit supply that will be used in Section 4.2. Although we
cannot say anything conclusive about these breakdowns for countries other than France, Germany,
Italy and Spain, the rejection rates in Table 11 do suggest that Spanish, Irish and Greek SME credit
markets have been particularly parsimonious in their allocation of credit to SMEs over 2009 and
2010. One is justified in being sceptical of any normative judgement on the rationing of credit in
individual countries from this table. It is eminently possible that rejection rates in Ireland, Greece
and Spain could be explained by increased riskiness of firms in these countries, in which case the
banking sector would be deemed to be making credit decisions in a perfectly rational way. Our
analysis in Section 4.3 will address this issue.
We also observe firms’ responses on their demand for bank loans. Table 12 gives country-level
frequencies for the following survey question with reference to bank loans:
For each of the following types of external financing, please tell me if your needs in-
creased, remained unchanged or decreased over the past 6 months
From Table 12, it does not appear that credit demand among Irish firms has been changing in
any systematically different way to other Eurozone countries. The share of SMEs with increased,
unchanged and decreased demand for bank loans, standing at 19.3, 60.8 and 19.9 percent respectively,
match the total sample shares very closely. As with Table 11, we will get behind these figures in
Section 4.3 by using PSM to compare each Irish firm to the most similar comparator firm from the
rest of the sample.
From our description of the credit supply and demand variables in this section, the initial
suggestion coming from the data is that supply conditions have been very restrictive in Ireland
17
Table 11: Breakdown of the credit supply variable by country. Bank l oans only.
Not rejected Rejected Total
Country No. % No. % No. %
Austria 206 80.2 51 19.8 257 100
Belgium 212 81.5 48 18.5 260 100
Germany 683 74.6 233 25.4 916 100
Spain 714 50.6 696 49.4 1,410 100
Finland 92 84.4 17 15.6 109 100
France 901 81.4 206 18.6 1,107 100
Greece 169 47.7 185 52.3 354 100
Ireland 54 44.3 68 55.7 122 100
Italy 896 67.8 426 32.2 1,322 100
Netherlands 89 53.6 77 46.4 166 100
Portugal 173 61.8 107 38.2 280 100
Total 4,189 66.5 2,114 33.5 6,303 100
18
Table 12: Change in firms’ demand for bank loans in previous six months.
Increased Unchanged Decreased Total
No. % No. % No. % No. %
Austria 160 20.4 467 59.4 159 20.2 786 100
Belgium 159 18 570 64.7 152 17.3 881 100
Germany 604 21.3 1,656 58.5 572 20.2 2,832 100
Spain 815 24.9 1,822 55.8 630 19.3 3,267 100
Finland 108 17.8 367 60.4 133 21.9 608 100
France 646 17.9 2,426 67.4 527 14.6 3,599 100
Greece 239 29.7 414 51.4 152 18.9 805 100
Ireland 130 19.3 409 60.8 134 19.9 673 100
Italy 802 24.4 1,950 59.4 531 16.2 3,283 100
Netherlands 185 20.4 509 56.1 214 23.6 908 100
Portugal 193 22 521 59.3 164 18.7 878 100
Total 4,041 21.8 11,111 60 3,368 18.2 18,520 100
19
relative to the Eurozone as a whole, and relative to all countries apart from Spain and Greece. On
the demand side, the data do not offer any suggestion that credit demand has been falling more in
Ireland than in other Eurozone countries. Section 4.2 will present the theory behind the Propensity
Score Matching (PSM) methodology that we will use in Section 4.3 to test whether differences in
credit supply and demand persist once we have matched Irish firms to comparator firms in other
countries.
4.2 Propensity Score Matching
PSM was traditionally used in microeconometric studies of labour, education and health economics,
with its use expanding to a broader range of topics in recent years. The broad aim of the methodology
is to isolate the causal effect of a given treatment (often a policy change), by matching individuals in a
treatment group (T ) with individuals in a control group (C) along a set of observable characteristics.
This is necessary mainly where individuals have not been randomly assigned into the states T or C.
The key Conditional Independence Assumption (CIA) of PSM is that, once observations have been
matched on observables, the only factor driving any difference in the outcome variable of interest
between T and C is the treatment itself. While clearly inferior to randomly assigning a policy
intervention to one sample and depriving another sample of the s ame treatment and observing
the difference in outcomes (a purely experimental approach), PSM offers a powerful observational
alternative, once the CIA can be credibly posited to hold.
Mathematically, we can represent our treatment dummy D
i
= 1 if treatment occurs and D
i
= 0
if the individual i does not receive the treatment, i.e. is in the control group. Our outcome variable
of interest (say the probability of being rejected for a loan), when individual i r eceives the treatment,
is represented by Y
1i
. The inherent problem in all observational studies is that the counterfactual
Y
0i
(the value of the outcome variable for individual i when treatment is not received), is never
observed for the same i, D
i
= 1. The role of PSM is to estimate the causal effect of the treatment
(Y
1i
− Y
0i
). This effect is known as the Average Treatment Effect on the Treated (ATT). PSM
begins by estimating a propensity score, first introduced by Rosenbaum and Rubin (1983). From
the pool of treated and non-treated individuals i, with the vector of observable characteristics X,
the propensity score is the probability that an individual i is in the treatment group:
p
i
(x) = P r(D = 1|X = x) (1)
Equation 1 is generally estimated by a probit regression. There are a number of ways by
which PSM can proceed after the estimation of (1). Nearest neighbour matching will match an
individual in the treatment group with the individual with the closest p
i
(x) in the non-treated
20
group. Other methods, such as nearest-multiple-neighbours matching and Kernel matching, will
match a treatment firm to a number of control firms, weighting the control firms by the difference
between their propensity score and that of the treatment firm.
Once treatment i have been matched using one of the methods above, the Average Treatment
Effect on the Treated (ATT) is calculated as the weighted average of the difference in Y
i
between
treated and matched control i. Once the CIA is deemed to hold, this ATT is interpreted as the
estimated causal effect of the treatment D on the outcome Y .
There are a number of ways to provide support for the CIA when using PSM. Most importantly,
the researcher must test whether there are differences between T and C in the set of observables X
used to calculate P
i
(x). In order for the CIA to hold, we must first be sure that, post-matching,
x
t
= x
c
for all x, i.e. the mean values of each observable characteristic should not be significantly
different between the treatment and control groups. Further, one can observe the distribution of
the propensity score in T and C post-matching. For a match to have been effective, the propensity
score should be similarly distributed across the two groups. PSM should also only be estimated for
observations deemed to be “on common support”, which means that only observations that have a
propensity score in the region of overlap between the treated and non-treated groups’ distributions
should be used. When common support does not hold for some observations, researchers must be
more careful in their interpretation of the ATT, which now becomes the Average Treatment Effect on
the Treated who are on support. This poses particular concerns when the observations off-support
have not randomly ended up in this state. In all results presented in the next section, all observations
were in fact “on support”, meaning that this issue did not pose problems to our methodology.
Section 4.3 covers our implementation of PSM vis-a-vis the issue of Irish SME credit demand
and supply.
4.3 Results on Credit Supply
We use PSM not to estimate the effect of any particular policy change, but rather to look at the
effect of a firm being Irish, controlling for observable characteristics of the firm, on credit supply
and demand. On supply, this removes the effect that the riskiness of applicant firms has on credit
decisions; assuming the CIA holds, the estimated effect is due solely to the nature of the Irish credit
market. Similarly, when looking at credit demand, we attempt to quantify the difference in demand
changes between Irish and comparable Eurozone countries not explained by firm characteristics.
We begin reporting results on credit supply. Our pool of firms is initially all firms in the
sample. In the terminology of PSM, being an Irish firm is the treatment, T , and being from any
21
other country is the non-treatment, or control, C. We estimate equation 1, where X comprises the
following variables:
• Categorical variables for turnover, employment, independence, sector of activity, age, owner-
ship.
• Variables indicating whether the following increased, decreased or remained unchanged in
the previous six months: Turnover, labour costs, other costs, net interest expenses, profit,
mark-ups.
• Variables indicating firms’ perception of changes in the following: general economic outlook,
access to public financial support, firm-specific outlook, firm’s capital, firm’s credit history.
• Dummy indicating survey wave.
In Table 13, we first report results where the pool of non-treated firms come from all sample
countries apart from Ireland. Here we see that, depending on the matching method used (one nearest
neighbour, two neighbours, four neighbours or kernel matching
12
), we find an Average Treatment
Effect on the Treated (ATT) that lies between 15 and 18 percent. This effect is significant at the
1% level for all cases apart from single-neighbour matching, where it is significant at the 5% level.
The interpretation of the coefficient is that a firm in Ireland has a 15 to 18 percent higher likelihood
of being rejected when applying for a bank loan than a firm in another Eurozone country, and that
this effect is not explained by firm-level characteristics and is rather due simply to the firm being in
Ireland.
Table 13: PSM results. Outcome variable: D
i
= 1 if firm rejected for a bank loan in
previous six months. Non-treated group: All sampled Eurozone firms.
ATT t-stat N
T
N
C
Pseudo R
2
Method
.1471 2.05 102 4,538 .1341 n(1)
.1666 2.72 102 4,538 .1341 n(2)
.1568 2.78 102 4,538 .1341 n(4)
.1837 3.64 102 4,538 .1341 Kernel
We extend this exercise by comparing Irish firms to two subsets of the data. First we look only
at countries in which a similar sovereign, economic and/or banking crisis has been felt since the onset
of the global economic crisis. Intuitively, one would expect that the Irish banking system should not
12
n(x) implies nearest neighbour matching with x neighbours.
22