Báo cáo khoa học: Adipophilin protein expression in muscle – a possible protective role against insulin resistance pot
Bạn đang xem bản rút gọn của tài liệu. Xem và tải ngay bản đầy đủ của tài liệu tại đây (467.6 KB, 13 trang )
Adipophilin protein expression in muscle – a possible
protective role against insulin resistance
Janneke de Wilde
1,2
, Egbert Smit
1,2
, Frank J. M. Snepvangers
2
, Nicole W. J. de Wit
1,3
, Ronny
Mohren
1,2
, Martijn F. M. Hulshof
1,2
and Edwin C. M. Mariman
1,2
1 Nutrigenomics Consortium, Top Institute Food and Nutrition, Wageningen, The Netherlands
2 Department of Human Biology, NUTRIM School for Nutrition, Toxicology and Metabolism, Maastricht University Medical Centre,
The Netherlands
3 Nutrition, Metabolism and Genomics group, Wageningen University, The Netherlands
Introduction
The metabolic syndrome (MS) is a multi-component
metabolic disorder associated with an increased risk
for type 2 diabetes (T2D) and cardiovascular diseases
[1,2]. The increasing prevalence of the MS is caused by
a combination of lifestyle factors, such as nutrition
and limited physical activity, which are known to
contribute to the pathogenesis of the MS [3]. Two
major characteristics underlying the MS are obesity
Keywords
2D gel electrophoresis; C2C12 cells; insulin
signaling; intramuscular triglycerides; lipid
droplet
Correspondence
J. de Wilde, Department of Human Biology,
Maastricht University, PO Box 616,
6200 MD Maastricht, The Netherlands
Fax: +31 43 36 70976
Tel: +31 43 38 81509
E-mail:
(Received 4 November 2009, revised 27
November 2009, accepted 30 November
2009)
doi:10.1111/j.1742-4658.2009.07525.x
Adipophilin is a 50 kDa protein that belongs to the PAT family (perilipin,
adipophilin, TIP47, S3-12 and OXPAT), which comprises proteins involved
in the coating of lipid droplets. Little is known about the functional role of
adipophilin in muscle. Using the C2C12 cell line as a model, we demon-
strate that palmitic acid-treated cells highly express the adipophilin protein
in a dose-dependent way. Next, we show that oleic acid is a more potent
inducer of adipophilin protein levels than palmitic acid. Cells treated with
oleic acid have a higher adipophilin protein expression and higher triglycer-
ide levels but less impairment of insulin signaling than cells treated with
palmitic acid. Additionally, we show that peroxisome proliferator-activated
receptor (PPAR)a, PPARb ⁄ d and PPARc agonists all increase the expres-
sion of the adipophilin protein in C2C12 cells. This effect was most pro-
nounced for the PPARa agonist GW7647. Furthermore, the expression of
adipophilin as a 37 kDa N-terminally truncated protein is higher in the
gastrocnemius than in the quadriceps of C57BL ⁄ 6J mice, especially after an
8-week high-fat diet. The expression of adipophilin was higher in the mus-
cle of mice fed a 4-week high-fat diet based on olive oil or safflower oil
than in mice fed a 4-week high-fat diet based on palm oil. After 2 weeks of
intervention, plasma glucose, plasma insulin and the homeostasis model
assessment of insulin resistance index were lower in mice fed a 4-week
high-fat diet based on olive oil or safflower oil than in mice fed a 4-week
high-fat diet based on palm oil. Taken together, the results obtained in the
present study indicate that adipophilin protein expression in muscle is
involved in maintaining insulin sensitivity.
Abbreviations
Adfp, adipophilin; CLB, classical lysis buffer; FA, fatty acid; HFD, high-fat diet; HOMA-IR, homeostasis model assessment of insulin
resistance; LD, lipid droplet; LFD, low-fat diet; MS, metabolic syndrome; O, olive oil; P, palm oil; PPAR, peroxisome proliferator-activated
receptor; S, safflower oil; T2D, type 2 diabetes; TAG, triacylglycerol.
FEBS Journal 277 (2010) 761–773 ª 2009 The Authors Journal compilation ª 2009 FEBS 761
and insulin resistance [4,5]. Additionally, obesity is
considered as the principal cause of insulin resistance
[3,4]. Because the skeletal muscle is the major site of
insulin-stimulated glucose metabolism, it plays an
important role in the etiology of insulin resistance
and the MS [5].
Insulin promotes the uptake of glucose via the acti-
vation of the phosphatidylinositol 3-kinase pathway,
which is responsible for most of the metabolic actions
of insulin. Upon activation of phosphatidylinositol
3-kinase, Akt ⁄ protein kinase B is activated by
phosphorylation. Consequently, glucose transporter 4
is translocated to the cell membrane, mediating the
uptake of glucose [6]. Impaired insulin signaling, as
observed in obesity and T2D, is strongly associated
with an excess accumulation of triacylglycerols (TAG)
in the skeletal muscle [7–10]. Paradoxically, endurance
training has been shown to improve insulin sensitivity,
whereas levels of intramuscular TAG are reported to
increase upon training [11,12]. Therefore, it has been
proposed that it is not TAG per se but lipid intermedi-
ates such as long-chain fatty acyl CoAs, diacylglycerol
and ceramides that may act as signaling molecules to
interrupt insulin signaling and glucose metabolism.
Eventually, this will result in insulin resistance [13,14].
TAG are mainly stored as lipid droplets (LDs) sur-
rounded by a phospholipid monolayer and coated
with one or more proteins of the PAT family [perili-
pin, adipophilin (Adfp), TIP47, S3-12 and OXPAT]
[15–17]. The best-characterized member of the PAT
family is perilipin. Perilipin is exclusively expressed in
adipocytes and steroidogenic cells [17], where it is
involved in the regulation of the storage and lipolysis
of TAG [18–22]. Whereas Adfp was originally discov-
ered as one of the earliest markers of adipocyte
development, Adfp is now known to be ubiquitously
expressed including in skeletal muscle [23]. Recent
in vitro studies have provided more insight in the
functional role of Adfp. In various cell types, it has
been shown that Adfp overexpression stimulates the
uptake of fatty acids (FA) [24], increases the storage
of TAG [25–27] and decreases the turnover rate of
TAG [25]. The expression of Adfp is regulated by the
nuclear hormone receptors of the peroxisome prolifer-
ator-activated receptor (PPAR) family. The three
PPAR family members, PPARa, PPARb ⁄ d and
PPARc, all increase the expression of Adfp [28] but
little is known about regulation in the skeletal muscle.
In mouse skeletal muscle, PPARa is involved in the
regulation of Adfp expression [29], whereas ambigu-
ous results are reported regarding the role of PPARc
in the regulation of Adfp expression in human skele-
tal muscle [30,31].
In the present study, we searched for changes in the
proteome of muscle cells exposed to palmitic acid. The
C2C12 cell line, which is commonly used to study the
mouse skeletal muscle in vitro, was chosen as a model.
By using 2D gel electrophoresis, we identified 14 pro-
teins that are regulated by the incubation with palmitic
acid. The protein with the strongest regulation was
identified as Adfp. Additional experiments were per-
formed to obtain more insight into the regulation of
Adfp expression in muscle cells. We studied the effect
of palmitic acid and oleic acid on insulin signaling and
the accumulation of TAG in relation to Adfp protein
levels. Furthermore, we examined the responsiveness
of the C2C12 cell line to different PPAR agonists. To
assess the in vivo relevance of these findings, we mea-
sured the Adfp protein levels in two muscle groups of
mice fed an 8-week low-fat diet or high-fat diet based
on palm oil (LFD-P and HFD-P, respectively).
Finally, we studied Adfp protein levels in muscle of
mice fed a 4-week HFD based on palm oil (HFD-P),
olive oil (HFD-O) and safflower oil (HFD-S).
Results
Effect of palmitic acid on protein profiles of
C2C12 cells: identification of adipophilin
To search for palmitic acid-dependent changes in the
muscle proteome, we exposed differentiated C2C12
cells to 0–400 lm of palmitic acid for 16 h. Subse-
quently, proteins were isolated from the cells and sepa-
rated by 2D gel electrophoresis. pdquest was used to
reveal statistically significant differences in protein
expression between cells treated with or without pal-
mitic acid. A comparison of 2D gel electrophoresis
profiles resulted in 104 differentially expressed protein
spots from which 26 protein spots were selected for
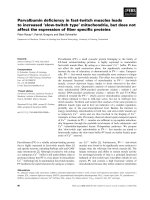
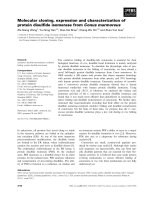
identification. Figure 1A shows a representative exam-
ple of the proteome of C2C12 cells treated with pal-
mitic acid in which the identified proteins (14 in total)
are indicated. Exposure to palmitic acid increased the
abundance of five proteins and decreased the abun-
dance of nine proteins (Table 1). The protein with the
strongest regulation was identified as Adfp, which was
highly expressed in palmitic acid-treated muscle cells
but completely absent in the untreated muscle cells
(Fig. 1B).
Oleic acid is a stronger inducer of Adfp than
palmitic acid in C2C12 cells
To obtain more insight in the effect of palmitic acid
on Adfp protein levels, C2C12 cells were exposed to
Adipophilin protein expression in muscle J. de Wilde et al.
762 FEBS Journal 277 (2010) 761–773 ª 2009 The Authors Journal compilation ª 2009 FEBS
different concentrations (0, 50, 100, 200 and 400 lm)
of palmitic acid. Western blotting showed that treating
C2C12 cells with 200 or 400 lm palmitic acid resulted
in significantly higher Adfp levels compared to 0, 50
and 100 lm palmitic acid, respectively (Fig. 2). Expo-
sure of C2C12 cells to various concentrations (50, 100,
200 and 400 lm) of oleic acid gave a different result.
No Adfp protein could be detected in C2C12 cells
treated with 50 lm palmitic acid, whereas Adfp protein
was expressed in C2C12 cells treated with 50 lm oleic
acid. Furthermore, at concentrations of 100 and
200 lm, we observed significantly higher Adfp levels in
the oleic acid-treated C2C12 cells compared to the pal-
mitic acid-treated cells. C2C12 cells treated with
400 lm oleic instead of 400 lm palmitic acid showed a
strong tendency (P = 0.06) for higher Adfp protein
levels (Fig. 3A).
Oleic acid induces higher TAG levels but less
impaired insulin signaling than palmitic acid in
C2C12 cells
Western blotting showed that the Adfp protein more
highly expressed in oleic acid-treated cells than in pal-
mitic acid-treated cells. Because increased Adfp levels
are associated with increased cellular TAG levels, we
hypothesized that oleic acid-treated cells accumulate
more TAG than palmitic acid-treated cells. To investi-
gate this further, we exposed C2C12 cells to 0 lm FA,
400 lm palmitic acid and 400 lm oleic acid and mea-
sured intracellular TAG levels. Cellular TAG levels
were significantly higher in both palmitic acid-treated
and oleic acid-treated C2C12 cells compared to the
control condition ( P < 0.05 and P < 0.001, respec-
tively), although oleic acid-treated C2C12 cells
A
pl 3.3
3.5
4.0
4.5
5.5
6.5
6.0 7.0 7.5 8.5 9.59.0 10.08.05.0
0603
3405
4303
3308
4505
5610
6605
8414
8306
7416
3505
2617
3902
0701
250
150
100
75
50
37
25
20
m (kDa)
I
II III
VIVIV
B
Fig. 1. A representative example of the
proteome map of C2C12 cells treated with
palmitic acid. C2C12 cells were incubated
with or without 400 l
M palmitic acid for
16 h. Total protein was isolated and used
for 2D gel electrophoresis analysis.
A representative example of proteome map
of C2C12 cells treated with palmitic acid,
including molecular weight markers and the
iso-electric range, is shown. The encircled
spots indicate spots that could be identified
by MALDI-TOF-MS. The square indicates
the area in which Adfp was found (A). This
area is enlarged and shown for cells treated
without (I–III) and with (IV–VI) palmitic acid.
Three biological replicates are shown (B).
J. de Wilde et al. Adipophilin protein expression in muscle
FEBS Journal 277 (2010) 761–773 ª 2009 The Authors Journal compilation ª 2009 FEBS 763
accumulated significantly more cellular TAG than pal-
mitic acid-treated cells (P < 0.001) (Fig. 3B). Because
increased TAG levels in muscle cells are implicated in
the development of insulin resistance, we studied the
effect of palmitic acid and oleic acid on insulin signal-
ing. A critical step in the translocation of glucose
transporter 4 to the cell membrane is the full activa-
tion of Akt ⁄ protein kinase B by the phosphorylation
of serine residue 473 [6]. Western blotting was per-
formed for total Akt and phosphorylated Akt at serine
residue 473 [pAkt(Ser473)]. The ratio between pAkt
and total Akt was calculated as an indicator of insulin
sensitivity. Figure 3C shows that the ratio pAkt(-
Ser473) ⁄ total Akt is significantly lower in palmitic
acid-treated cells than in oleic acid-treated cells at con-
centrations of 200 and 400 lm. A strong tendency for
a lower pAkt(Ser473) ⁄ total Akt ratio in palmitic acid-
treated cells was observed at a concentration of 50 lm
(P = 0.07). Taken together, these results demonstrate
less impairment of insulin signaling in oleic acid-
treated cells than in palmitic acid treated-cells.
PPARa, PPARb ⁄ d and PPARc increase Adfp
protein expression in C2C12 cells
To further elaborate on the regulation of Adfp in
muscle cells, we cultured C2C12 cells in differentiation
medium containing one of the following agonists:
GW7647 (PPARa), WY14643 (PPARa), GW501516
(PPARb ⁄ d) and rosiglitazone (PPARc). Because Adfp
is degraded in the absence of FA, we added the pro-
teasome inhibitor MG132 [32]. The Gapdh protein was
not stably expressed and so we used Acta1 as a load-
ing control in this experiment. Figure 4 shows that
GW7647, GW501516 and rosiglitazone significantly
increased Adfp protein expression. A strong tendency
for increased Adfp protein expression was observed
when C2C12 cells were treated with WY14643. The
strongest up-regulation was found in GW7647-stimu-
lated cells, followed by GW501516-stimulated cells and
WY1463-stimulated cells. The lowest up-regulation of
Adfp protein expression was observed in rosiglitazone-
stimulated cells.
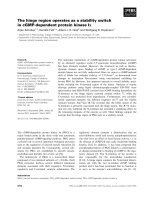
Mouse muscle expresses an N-terminally
truncated form of Adfp
By using a C-terminal specific antibody, we detected
Adfp as a truncated protein with a molecular weight
of 37 kDa in the skeletal muscle of mice, whereas
mouse liver and C2C12 cells expressed the full-length
protein of 50 kDa (Fig. 5A). Recently, it was reported
that mammary glands of both Adfp knockout mice
and wild-type mice express a 37 kDa N-terminally
truncated form of Adfp [33]. The finding in the present
study raised the possibility that mouse skeletal muscle
also expresses an N-terminally truncated form of Adfp.
To investigate this, we performed an additional
Table 1. List of identified differentially expressed proteins in C2C12 cells treated with palmitic acid. Fold changes and P-values are calcu-
lated for differences in average spot intensities induced by palmitic acid incubation for 16 h.
Spot
Swiss-Prot
accession
number
Protein name
Gene
symbol
Mascot
score
Sequence
coverage
(%)
Matched
peptides
Fold
change P-value
603 Q9DAG4 Protein TSC21 (Testis-specific
conserved protein of 21 kDa)
Tsc21 66 42 6 )3.21 0.010
701 P14211 Calreticulin Calr 60 12 6 )2.49 0.036
2617 Q91W90 Thioredoxin domain-containing
protein 5 precursor
Txndc5 62 21 7 )2.16 0.024
3308 P67778 Prohibitin Phb 68 24 6 1.64 0.028
3405 Q9CY33 Tubulin beta-5 chain Tbb5 86 29 9 )1.69 0.043
3505 P68373 Tubulin alpha-1C chain Tuba1c 69 22 8 )2.26 0.045
3902 P63038 60 kDa heat shock protein,
mitochondrial precursor
Hspd1 67 28 12 2.40 0.001
4303 P10107 Annexin A1 Anxa1 64 29 9 )2.05 0.014
4505 P09411 Phosphoglycerate kinase 1 Pgk1 64 28 8 )1.68 0.038
5610 P17182 Alpha-enolase Eno1 90 48 10 1.51 0.029
7416 P05064 Fructose-bisphosphate aldolase A Aldoa 72 35 9 )2.36 0.008
8306 Q3U9G0 Heat shock cognate 71 kDa protein Hspa8 106 25 13 )2.47 0.015
8414 Q60932 Voltage-dependent anion-selective
channel protein 1
Vdac1 91 40 9 2.33 0.030
6605 P43883 Adipophilin Adfp 67 24 6 –
a
–
a
Spot 6605 was only present in palmitic acid-treated cells and, therefore, the fold change and P-value could not be calculated.
Adipophilin protein expression in muscle J. de Wilde et al.
764 FEBS Journal 277 (2010) 761–773 ª 2009 The Authors Journal compilation ª 2009 FEBS
western blot with an antibody directed against the
N-terminus of the Adfp protein. Figure 5B shows that
this antibody detected a single band at 50 kDa in
liver and C2C12 cells, although it failed to detect any
bands in protein extracts of quadriceps and gastrocne-
mius muscle of wild-type mice. Taken together, these
results indicate that mouse skeletal muscle does express
the Adfp protein as an N-terminally truncated form.
Adfp protein levels in mouse skeletal muscle are
affected by dietary fat and muscle type
To assess the in vivo relevance of our findings, we deter-
mined Adfp protein levels in the quadriceps and gas-
trocnemius of mice fed an LFD-P or HFD-P for
8 weeks. The Adfp protein was expressed at equal levels
in the LFD-P quadriceps and the HFD-P quadriceps.
Although not statistically significant, higher Adfp pro-
tein levels were observed in the HFD-P gastrocnemius
than in the LFD-P gastrocnemius. Significantly higher
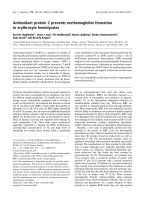
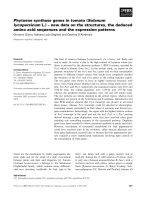
Fig. 2. Adfp protein levels in C2C12 cells treated with 0, 50, 100,
200 and 400 l
M palmitic acid, respectively. C2C12 cells were incu-
bated with 0, 50, 100, 200 and 400 l
M palmitic acid for 16 h. Wes-
tern blotting analysis was performed for the Adfp protein with
10 lg of total protein extracts The Gapdh protein signal was used
for normalization. Reported values are the mean ± SE of three bio-
logical replicates. ***P < 0.001 indicates statistical significance.
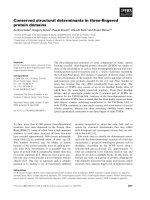
A
B
C
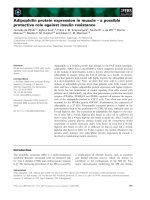
Fig. 3. Adfp protein levels, cellular triglyceride levels and pAkt(Ser
473) versus totalAkt ratio in C2C12 cells treated with 0, 50, 100,
200 and 400 l
M palmitic acid or oleic acid. (A) Adfp protein levels
in C2C12 cells incubated with 0, 50, 100, 200 and 400 l
M palmitic
acid or oleic acid for 16 h. Western blotting analysis was performed
with 10 lg of total protein extracts. The Gapdh protein signal was
used for normalization. (B) Cellular triglyceride levels in C2C12 cells
incubated with 0 l
M fatty acid (control), 400 lM palmitic acid and
400 l
M oleic acid. Triglyceride levels are expressed as mgÆmL
)1
per
mg protein. (C) The pAkt(Ser473) versus totalAkt ratio in C2C12
cells incubated with 0, 50, 100, 200 and 400 l
M palmitic acid or
oleic acid for 16 h. Western blotting analysis was performed with
10 lg of total protein extracts. The pAkt(Ser473) versus totalAkt
ratio was calculated after normalization of the protein signals with
the Gapdh protein signal. Reported values are the mean ± SE of
three biological replicates. *P < 0.05, **P < 0.01 and ***P < 0.001
indicate statistical significance. Dashed bars, black bars and white
bars represent the control condition, palmitic acid-treated cells and
oleic acid-treated cells, respectively.
J. de Wilde et al. Adipophilin protein expression in muscle
FEBS Journal 277 (2010) 761–773 ª 2009 The Authors Journal compilation ª 2009 FEBS 765
Adfp protein levels were observed in the gastrocnemius
than in the quadriceps of LFD-P mice as well as
HFD-P mice (Fig. 6). Additionally, we measured Adfp
protein expression in the quadriceps muscle of mice fed
an HFD-P, HFD-O or HFD-S for 4 weeks. The unsat-
urated ⁄ saturated FA ratio and FA composition of diets
is shown in Table 2. After 2 weeks, fasting plasma
glucose and insulin level were measured. Although not
statistically significant different, glucose and insulin
plasma levels tended to be lower in both mice fed
the HFD-O and HFD-S than in mice fed the HFD-P
(glucose: 14.5 ± 0.7 versus 12.7 ± 0.8 versus 12.1 ±
0.5 mmolÆL
)1
; insulin: 9.1 ± 2.0 versus 5.3 ± 1.6 ver-
sus 5.9 ± 1.1 lUÆmL
)1
; both in HFD-P versus HFD-O
versus HFD-S). As a result, the homeostasis model
assessment of insulin resistance (HOMA-IR) index (cal-
culated from fasting glucose and fasting insulin levels:
fasting glucose · fasting insulin ⁄ 22.5) was decreased in
both HFD-O mice and HFD-S mice compared to
HFD-P mice (HOMA-IR: 5.6 ± 1.0 versus 3.2 ± 1.1
AB
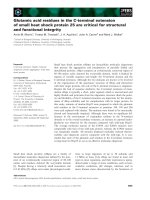
Fig. 5. Mouse skeletal muscle expresses an N-terminally truncated form of Adfp. Western blotting of equal amounts of liver (lanes 1 and 2),
quadriceps (lanes 3 and 4), gastrocnemius (lanes 5 and 6) and C2C12 cell (lanes 7 and 8) protein extracts. (A) The C-terminal specific Adfp
antibody detects a single band at 50 kDa in liver and C2C12 cell protein extracts, whereas a single band is detected at 37 kDa in mus-
cle protein extracts. (B) The N-terminal specific Adfp antibody detected a single band at 50 kDa in liver and C2C12 cells protein extracts
but failed to detect any bands in the muscle protein extracts.
Fig. 4. Adfp protein levels in C2C12 cells treated with different
PPAR agonists. To study the responsiveness of C2C12 cells to
different PPAR agonists, C2C12 cells were incubated with agonists
for 16 h. Western blotting analysis was performed with 10 lgof
total protein extracts. The Acta1 protein signal was used for nor-
malization. Reported values are the mean ± SE of two biological
replicates. DMSO, dimethylsulfoxide; GW 7647; PPARa agonist,
WY 14643; PPARa agonist, GW 501516; PPARb ⁄ d agonist and
Rosi(glitazone); PPARc agonist.
Muscle
Diet
Adfp
Gapdh
4
LFD
***
*
HFD
3
2
Adfp (AU)
1
0
Gastrocnemius
HFD
Gastrocnemius
LFD
Quadriceps
HFD
Gastrocnemius
Quadriceps
Quadriceps
LFD
Fig. 6. Adfp protein levels in the quadriceps and gastrocnemius of
LFD-P mice and HFD-P mice. Male C57BL ⁄ 6J mice were fed a
low-fat diet or a high-fat diet for 8 weeks. Both diets contained fat
in the form of palm oil. Western blotting analysis was performed
with 10 lg of total protein extracts from quadriceps or gastrocne-
mius muscle. The Gapdh protein signal was used for normalization.
Reported values are the mean ± SE of six biological replicates.
*P < 0.05 and ***P < 0.001 indicate statistical significance.
Adipophilin protein expression in muscle J. de Wilde et al.
766 FEBS Journal 277 (2010) 761–773 ª 2009 The Authors Journal compilation ª 2009 FEBS
versus 3.2 ± 0.6 in HFD-P versus HFD-O versus
HFD-S). However, this was not significantly different.
After 4 weeks, Adfp protein levels were measured in the
quadriceps muscle of these mice. Figure 7 shows that
Adfp protein expression was increased in both HFD-O
mice and HFD-S mice compared to HFD-P mice. How-
ever, this was only significant for HFD-O compared to
HFD-P. Adfp protein levels were comparable between
HFD-O mice and HFD-S mice.
Discussion
In the present study, we searched for changes in the
proteome of muscle cells exposed to palmitic acid.
A comparison of 2D cellular protein profiles resulted
in 104 differentially expressed protein spots. A total of
26 protein spots were selected for further analysis by
MS, yielding a total of 14 protein identities. Among
these proteins, we found that the protein levels of
Aldoa1 and Pgk1, which are two enzymes that play a
role in the glycolysis, were reduced in the palmitic
acid-treated cells. Additionally, the protein level of
prohibitin was increased in palmitic acid-treated cells.
Prohibitin is involved in the inhibition pyruvate carboxy-
lase, which is the enzyme that catalyzes the conversion
from pyruvate to oxaloactetate [34]. Prohibitin is
increased when pyruvate is preferably converted to
acetyl-CoA at conditions of low pyruvate production
[35]. Taken together, these observations indicate
reduced glucose metabolism, which is implicated in
insulin resistance. As shown in the present study,
palmitic acid indeed impaired insulin signaling in
C2C12 cells, which is in line with numerous studies
addressing the effect of palmitic acid on various
aspects of insulin sensitivity [36–38].
The protein with the strongest regulation was identi-
fied as Adfp. Adfp was highly expressed in palmitic
acid-treated muscle cells but completely absent in the
untreated muscle cells. Although it has been demon-
strated that Adfp is physically associated with intra-
muscular triglycerides in both rat and human muscle
[39,40], less is known about the functional role of Adfp
in skeletal muscle. We found that oleic acid-treated
cells have higher intracellular TAG levels together with
higher Adfp levels but less impairment of insulin sig-
naling than palmitic acid-treated cells. This may be
explained by differences in cellular metabolic fate
between palmitic acid and oleic acid. Listenberger
et al. [41] demonstrated that oleic acid leads to TAG
accumulation and is well tolerated, whereas palmitic
acid is poorly incorporated in TAG and causes apop-
tosis [41]. In addition, experiments with C2C12 cells
revealed that palmitic acid induces increased levels of
diacylglycerol and impairment of insulin signaling,
whereas oleic acid did not [42,43]. Co-incubation of
C2C12 cells with palmitic acid and oleic acid reversed
the impairment of insulin signaling by channeling pal-
mitic acid into TAG, thus reducing the incorporation
of palmitic acid in diacylglycerol [43]. Because we also
observed higher Adfp levels in oleic acid-treated cells
than in palmitic acid-treated cells, we hypothesize that
Adfp protects the muscle against the detrimental
effects of FA on insulin signaling via their incorpora-
tion in LDs as TAG.
Table 2. Unsaturation level and fatty acid composition of the three high-fat diets.
Fat source Unsaturated ⁄ saturated fatty acid ratio
Fatty acid composition (%)
16:0 18:0 18:1 18:2
HFD-P Palm oil 1.0 45 4 40 10
HFD-O Olive oil 4.6 13 3 71 10
HFD-S Safflower oil 10.1 7 2 13 78
HFD-P
Adfp
Gapdh
4
3
2
Adfp (AU)
1
0
HFD-O
HFD-S
HFD-P
HFD-O
*
HFD-S
Fig. 7. Adfp protein levels in the quadriceps of HFD-P, HFD-O and
HFD-S mice. Male C57BL ⁄ 6J mice were fed a high-fat diet based
on palm oil, olive oil and safflower oil for 8 weeks. Western blotting
analysis was performed with 10 lg of total protein extracts from
quadriceps muscle. The Gapdh protein signal was used for normali-
zation. Reported values are the mean ± SE of six biological repli-
cates. *P < 0.05 and ***P < 0.001 indicate statistical significance.
J. de Wilde et al. Adipophilin protein expression in muscle
FEBS Journal 277 (2010) 761–773 ª 2009 The Authors Journal compilation ª 2009 FEBS 767
The expression of Adfp is regulated by nuclear
hormone receptors of the PPAR family. PPARa,
PPARb ⁄ d and PPARc all increase Adfp expression
but in a tissue-specific way [28]. In liver and hepato-
cyte-derived cell lines Adfp is transcriptionally regu-
lated by PPARa [44,45], whereas PPARb ⁄ d activates
Adfp in macrophages [46–48]. In mouse skeletal mus-
cle, PPARa is involved in the regulation of Adfp
expression [29]. Indeed, the strongest up-regulation of
Adfp protein expression in C2C12 cells was achieved
through activation of PPARa. A more pronounced
effect for GW7647 than WY14643 was observed. This
can be explained by differences in the half maximal
effective concentration (EC
50
GW7647 = 0.006 lm;
EC
50
WY14643 = 5.0 lm) [49], indicating that GW7647
is a more potent PPARa agonist than WY14643.
Furthermore, the PPARb ⁄ d agonist GW501516
increased Adfp protein expression in C2C12 cells.
PPARb ⁄ d plays a role in the generation of the more
oxidative fiber types [50,51]. In human and rat muscle,
Adfp expression is particularly high in the more
oxidative fibers that have a higher capacity to store
lipids [30,40]. Accordingly, the increase of Adfp
protein levels induced by activation of PPARb ⁄ d may
be the consequence of a switch towards a more oxida-
tive fiber type. The smallest up-regulation was induced
by the PPARc agonist rosiglitazone. Rosiglitazone
belongs to the thiazolidinediones, which have antidia-
betic effects and are therefore commonly used for
insulin-sensitizer therapy in T2D subjects [52]. On the
basis of the putative functions of Adfp in lipid storage
and the control of lipolysis [15,28], it has been hypo-
thesized that higher Adfp protein levels can be
expected after insulin-sensitizer therapy with thiazo-
lidinediones. Indeed, Philips et al. [31] demonstrated
that an improved insulin sensitivity induced by trog-
litazone occurs together with increased Adfp protein
expression in the skeletal muscle of obese diabetic
subjects. However, Minnaard et al. [30] found that
rosiglitazone improved insulin sensitivity but decreased
skeletal muscle Adfp protein expression in T2D
patients. The finding in the present study of increased
Adfp protein expression after stimulating C2C12 cells
with rosiglitazone is in contrast to the latter finding.
To assess the in vivo relevance of our findings, we
analyzed the effect of muscle type (gastrocnemius versus
quadriceps) and the amount of dietary fat (10 kcal%
versus 45 kcal%) on Adfp protein levels. The gastrocne-
mius and quadriceps are both muscle groups that pre-
dominantly consist of type II fibers [51,53]. However,
we found significantly higher Adfp protein levels in
the gastrocnemius than in the quadriceps, which was
especially evident under HFD-P conditions. Recently,
Minnaard et al. [30] found that Adfp protein levels in
rat skeletal muscle are highest in type IIA fibers, inter-
mediate in type I fibers and almost absent in type IIB
fibers, and that this corresponded well with the intra-
muscular triglyceride content of these fibers. Western
blotting revealed higher Myh2 protein levels (a marker
for oxidoglycolytic type IIA fibers) in the gastrocnemius
than in the quadriceps (data not shown). In line with
Minnaard et al. [30], we hypothesize that the differences
in Adfp protein content between muscle types can be
explained by differences in fiber type composition.
Additionally, we analyzed the effect of the type of die-
tary fat on Adfp protein levels (palm oil versus olive oil
versus safflower oil). Palm oil contains large amounts of
palmitic acid and oleic acid and the ratio between unsat-
urated FA and saturated FA is 1.0. The predominant
FA in olive oil is oleic acid and the unsaturated ⁄ satu-
rated FA ratio is 4.6. Safflower oil contains oleic acid
and linoleic acid and the ratio between unsaturated FA
and saturated FA is 10.1. We found increased Adfp pro-
tein levels in the quadriceps muscle of the olive oil-based
or safflower-based HFD compared to the palm oil-
based HFD. Interestingly, fasting glucose levels, fasting
insulin levels and HOMA-IR all suggested better insulin
sensitivity in mice fed the olive oil-based or safflower
oil-based HFD than in mice fed the palm oil-based
HFD. Thus, in line with the in vitro experiments, we
were able to show in vivo that a high level of Adfp pro-
tein is associated with an improved insulin sensitivity.
Surprisingly, we found that the Adfp protein is
expressed as a 37 kDa N-terminally truncated form in
mouse skeletal muscle. Two domains that are
N-terminally located are the PAT domain and the
11-mer repeat regions [7]. Although it has been clearly
demonstrated that the PAT domain is not a prerequisite
for targeting Adfp to LDs, the results obtained for the
11-mer repeat region are less unambiguous [54–56].
Recently, Russell et al. [33] reported the finding that
Adfp-null mice as well as wild-type C57BL ⁄ 6J mice also
express a 37 kDa N-terminal truncated form of Adfp in
mammary glands. Interestingly, this truncated form
localized correctly to LDs in mammary glands and these
LDs were correctly secreted as milk fat globules [33].
Thus, we consider that this N-terminally truncated form
of Adfp is still functionally active in muscle, although a
reduced affinity for LDs cannot be excluded.
To summarize, by using 2D gel electrophoresis, we
identified Adfp as a highly regulated protein in C2C12
cells treated with palmitic acid. Further in vitro experi-
ments revealed that cells treated with oleic acid have
higher Adfp protein levels, higher cellular TAG levels
and less impairment of the insulin signaling pathway
than cells treated with palmitic acid. In vivo, we found
Adipophilin protein expression in muscle J. de Wilde et al.
768 FEBS Journal 277 (2010) 761–773 ª 2009 The Authors Journal compilation ª 2009 FEBS
that Adfp protein expression in the skeletal muscle of
mice is influenced by muscle type, with higher levels
being present in muscle types with a more oxidative
character. Additionally, we found that when mice are
fed an HFD with a higher unsaturated⁄ saturated FA
ratio, Adfp protein expression in muscle is increased,
accompanied by indications for better insulin sensitiv-
ity. Taken together, the results obtained in the present
study indicate that Adfp expression in muscle plays a
role in maintaining insulin sensitivity.
Materials and methods
Materials
The C2C12 cell line was obtained from the American Type
Culture Collection (ATCC; order number: CRL-1772).
DMEM, streptomycin and penicillin were obtained from
Invitrogen (Leek, The Netherlands). Fetal bovine serum was
obtained from Bodinco (Alkmaar, The Netherlands) and
matrigel was obtained from Beckton Dickinson (Nieuwegein,
The Netherlands). Urea, SYPRO Ruby Protein Stain and all
other reagents for SDS–PAGE and blotting were obtained
from Bio-Rad (Veenendaal, The Netherlands). The C-termi-
nal specific Adfp antibody was obtained from Bio-connect
(Huissen, The Netherlands). The N-terminal specific Adfp
antibody was obtained from Fitzgerald Industries Inter-
national (Conrad, MA, USA). The total Akt, pAkt(Ser473)
and GAPDH antibodies were obtained from Cell Signaling
Technologies (Bioke
´
, Leiden, The Netherlands). Secondary
antibodies were purchased from Dako (Glostrup, Denmark).
Cellular accumulation of triglycerides was determined in cell
lysates using an enzymatic triglyceride assay (Sigma,
Zwijndrecht, The Netherlands). Unless otherwise indicated,
all chemicals were obtained from Sigma.
C2C12 cell culture
C2C12 cells were cultured in DMEM with 10% (v ⁄ v) fetal
bovine serum supplemented with penicillin (100 lgÆmL
)1
)
and streptomycin (100 lgÆmL
)1
)at37°C in a humidified
atmosphere of 5% CO
2
in air. Differentiation was induced as
described and experiments were performed in 7-day differen-
tiated myotubes [57]. All experiments were performed in trip-
licate with the exception of the transcriptional regulatory
pathway experiment, which was performed in duplicate.
Fatty acid incubations
Stock solutions (40 mm) were made in ethanol for both
palmitic acid and oleic acid. FA were conjugated to BSA
by diluting the FA stock solution 1 : 100 with differentia-
tion medium containing 0.1% FA-free BSA. After incu-
bating at 37 °C for 1 h, solutions were filter-sterilized.
Before applying to cells, solutions were diluted with differ-
entiation medium containing 0.1% FA-free BSA to appro-
priate concentrations (50–400 lm). As a control condition,
we used differentiation medium with 0.1% FA-free BSA.
Examination of palmitic acid effects on protein
expression profiles of C2C12 cells
C2C12 cells were incubated with 0 or 400 lm palmitic acid
for 16 h. C2C12 cells were harvested in classical lysis buffer
(CLB; 8 m urea, 2% w ⁄ v Chaps, 65 mm dithiothreitol). The
protein concentrations of the samples were measured with a
protein assay kit (Bio-Rad), based on the method of Brad-
ford. Aliquots were stored at )80 °C. Protein samples were
analyzed by 2D gel electrophoresis, as described previously
[58], but using 24-cm pH 3–10 NL strips. Gels were stained
with SYPRO Ruby Protein Stain according to the manufac-
turer’s protocol. Proteins were visualized by gel scanning
using the Molecular Imager FX (Bio-Rad). Examination of
differentially expressed proteins was performed using image
analysis software pdquest 8.0 (Bio-Rad). Data were normal-
ized with respect to total density of the gel image. A spot was
considered to be significantly differentially expressed if the
average spot density differed ‡ 1.5 fold with P < 0.05
(obtained from an unpaired t-test) or when the spot was
absent in one of the two conditions. Differentially expressed
spots were excised from the gel with an automated Spot
Cutter (Bio-Rad). Excised protein spots were subjected to
tryptic in-gel digestion and MALDI-TOF-MS (Waters, Man-
chester, UK). A peptide mass list was generated by masslynx
4.0.5 (Waters) for subsequent database search. This peptide
mass list was searched with the mascot search engine, ver-
sion 2.2.04 (Matrix Science, London, UK) against the Swiss-
Prot database (Swiss-Prot release 56.5; 402 482 sequences)
for protein identification. One miss-cleavage was tolerated
and carbamidomethylation was set as a fixed modification
with the oxidation of methionine as an optional modification.
The peptide mass tolerance was set to 100 p.p.m. No restric-
tions were made on the protein molecular weight and the iso-
electric point. Taxonomy was set to Mus musculus and
mascot probability scores were calculated using the peaks
with highest signal intensity, excluding trypsin peaks. A pro-
tein was regarded as identified with a significant mascot
probability score, namely protein scores greater than 54
(P < 0.05) and with at least four peptides, excluding differ-
ent forms of the same peptide, assigned to the protein.
The effect of palmitic acid and oleic acid on Adfp
protein levels
C2C12 cells were incubated with 0, 50, 100, 200 and
400 lm palmitic acid or oleic acid for 16 h. C2C12 cells
were harvested in CLB and western blotting was performed
as described previously [59]. Briefly, total protein was sepa-
J. de Wilde et al. Adipophilin protein expression in muscle
FEBS Journal 277 (2010) 761–773 ª 2009 The Authors Journal compilation ª 2009 FEBS 769
rated by SDS–PAGE on 4–12% Bis-Tris Criterion gels
(Bio-Rad, Veenendaal, The Netherlands) at 150 V and
transferred to a polyvinylidene fluoride membrane for
90 min at 100 V. Blocking steps were performed in TBST
[NaCl ⁄ Tris HCl containing 0.1% (w ⁄ v) Tween 20] supple-
mented with 5% nonfat dry milk. Antibody incubation
steps of the membrane were performed in TBST supple-
mented with 5% BSA. Membranes were incubated over-
night with C-terminal specific Adfp and GAPDH
antibodies at 4 °C. After washing with TBST, membranes
were incubated with a horseradish peroxidase-conjugated
secondary antibody and signals were detected by enhanced
chemiluminescence using Pierce reagents (Pierce, Rockford,
IL, USA). Films were scanned with a GS800 densitometer
(Bio-Rad) and signals were quantified with Quantity One
software (Bio-Rad). The signal intensity of Gapdh or Acta1
was used to calculate the relative protein level.
Determination of insulin signaling
C2C12 cells were incubated with 0, 50, 100, 200 and
400 lm palmitic acid or oleic acid for 16 h. During the final
15 min of the FA incubation period, C2C12 cells were
exposed to insulin (17.2 nm). C2C12 cells were harvested in
CLB and protein levels of total Akt and pAkt(Ser473) were
analyzed by western blotting as described above.
Measurement of intracellular triglycerides
C2C12 cells were incubated with 400 lm palmitic acid,
400 lm oleic acid or 0.1% BSA (control) for 16 h. C2C12
cells were harvested in NaCl ⁄ P
i
containing 1% NP-40 and
1% deoxycholaat. Intracellular triglyceride levels were mea-
sured in cell lysates using an enzymatic triglyceride assay
according the manufacturer’s instructions (Sigma). Triglyc-
eride levels were corrected for endogenous glycerol levels.
The protein concentration of a sample was used to normal-
ize for the number of cells. The results are reported as
triglycerides per mg of protein.
The effect of PPAR agonists on Adfp protein
levels in C2C12 cells
All three PPAR subtypes (a, b ⁄ d and c) have been reported
to increase Adfp expression but with significant differences
between tissues. Therefore, we analyzed the responsiveness of
C2C12 cells to different PPAR agonists. For 16 h, C2C12
cells were cultured in differentiation medium containing one
of the following agonists: 1 lm GW7647 (PPARa; Sigma),
10 lm WY14643 (PPARa; BIOMOL, Heerhugowaard, The
Netherlands), 1 lm GW501516 (PPARb ⁄ d; Bio-connect) and
10 lM rosiglitazone (PPARc; LKT Laboratories, Lausen,
Switzerland). The proteasome inhibitor MG132 (VWR,
Amsterdam, The Netherlands) was added to prevent
degradation of Adfp [32]. C2C12 cells were harvested in CLB
and western blotting was performed as described above.
Adfp protein levels in muscle tissue from diet-
induced obese mice
Study 1
Male C57BL ⁄ 6J mice were obtained from Harlan (Horst,
The Netherlands). At 9 weeks of age, mice were switched
to the LFD-P (10 kcal% fat) for 3 weeks. After the run-in
period, mice were randomly assigned to the LFD-P or
HFD-P (45 kcal% fat) for 8 weeks (n = 6 per diet). Both
diets contained fat in the form of palm oil (based on
D12450B and D12451; Research Diet Services, Wijk bij
Duurstede, The Netherlands), as described previously [60].
Study 2
Male C57BL ⁄ 6J mice were obtained from Harlan. At 6 weeks
of age, mice were switched to a run-in diet consisting of a
LFD-P (10 kcal% fat) for 3 weeks. After the run-in period,
mice were randomly assigned to HFD-P, HFD-O or HFD-S
(45 kcal% fat) for 4 weeks (n = 6 per diet). Diets contained
fat in the form of palm oil (HFD-P), olive oil (HFD-O) or
safflower oil (HFD-S) (based on D12451; Research Diet
Services). After 2 weeks, mice were fasted for 6 h and plasma
glucose levels were measured with the Accu-Chek (Roche
Diagnostics, Almere, The Netherlands). Additionally, blood
was collected in EDTA-containing tubes (Sarstedt AG&CO,
Nu
¨
mbrecht, Germany). Plasma was obtained after centrifu-
gation at 11 000 g for 10 min and stored at )80 °C for
further analysis. Plasma insulin levels were detected by the
Insulin (Mouse) Ultrasensitive EIA (Alpco Diagnostics,
Salem, NH, USA). Finally, we calculated the HOMA-IR
index from fasting glucose and fasting insulin levels.
Mice were fasted for 6 h and anaesthetized with a mix-
ture of isofluorane (1.5%), nitrous oxide (70%) and oxygen
(30%). Mice were killed by cervical dislocation and quadri-
ceps and gastrocnemius muscles were dissected, snap-frozen
in liquid nitrogen and stored at )80 °C until further analy-
sis. Protein samples were obtained as described previously
[59] with minor adaptations for the lysis buffer [10%
(wt ⁄ vol) SDS, 5 mm dithiothreitol, 20 mm Tris base, 1 mm
phenylmethanesulfonyl fluoride, phosphatase inhibitor
cocktail 1 (1 : 100) and protease inhibitor cocktail
(1 : 100)]. Total protein was used for western blotting of
Adfp with C-terminal specific and N-terminal specific anti-
bodies as described above. The animal studies were
approved by the Local Committee for Care and Use of
Laboratory Animals at Wageningen University.
Statistical analysis
All data are expressed as the mean ± SEM. All statistical
analyses were performed using prism software (GraphPad
Adipophilin protein expression in muscle J. de Wilde et al.
770 FEBS Journal 277 (2010) 761–773 ª 2009 The Authors Journal compilation ª 2009 FEBS
Software, San Diego, CA, USA). An unpaired t-test was
used: (a) to compare spot intensities between cells treated
with and without palmitic acid (2D gel electrophoresis
analysis); (b) to compare Adfp and pAkt(Ser473) ⁄ total
Akt protein levels between palmitic acid-treated and oleic
acid-treated C2C12 cells; and (c) to compare Adfp protein
levels in untreated C2C12 cells with the PPAR agonist-
treated C2C12 cells. A one-way analysis of variance
(ANOVA) was used: (a) to analyze the concentration
effect of palmitic acid on Adfp protein levels; (b) to com-
pare the differences in TAG accumulation between the
control condition, the 400 lm palmitic acid-treated cells
and the 400 lm oleic acid-treated cells; and (c) to compare
Adfp protein levels in mice fed an HFD-P, HFD-O and
HFD-S for 4 weeks, respectively. When significant differ-
ences were found, a Tukey’s post-hoc test was used to
determine the exact location of the difference. A two-way
ANOVA was performed for statistical analysis of differ-
ences in Adfp protein levels between quadriceps and
gastrocnemius muscles of mice fed an LFD-P or HFD-P
for 8 weeks. When significant differences were found, a
Bonferroni post-hoc test was used to determine the exact
location of the difference. P < 0.05 was considered statis-
tically significant.
Acknowledgements
This study was funded by the Top Institute Food and
Nutrition, with financial support by the Dutch govern-
ment. We thank Freek Bouwman for excellent techni-
cal support with the MALDI-TOF-MS (Department
of Human Biology, Maastricht University, The
Netherlands). We greatly appreciate the gift of the
PPARa, PPARb ⁄ d and PPARc agonists from
Dr Heleen de Vogel-van den Bosch (Department of
Physiology, Maastricht University, The Netherlands).
References
1 Alberti KG, Zimmet P & Shaw J (2006) Metabolic
syndrome – a new world-wide definition. A Consensus
Statement from the International Diabetes Federation.
Diabet Med 23, 469–480.
2 Zimmet P, Magliano D, Matsuzawa Y, Alberti G &
Shaw J (2005) The metabolic syndrome: a global public
health problem and a new definition. J Atheroscler
Thromb 12, 295–300.
3 Laaksonen DE, Niskanen L, Lakka HM, Lakka TA &
Uusitupa M (2004) Epidemiology and treatment of the
metabolic syndrome. Ann Med 36, 332–346.
4 Eckel RH, Grundy SM & Zimmet PZ (2005) The
metabolic syndrome. Lancet 365, 1415–1428.
5 Kahn BB & Flier JS (2000) Obesity and insulin
resistance. J Clin Invest 106, 473–481.
6 Taniguchi CM, Emanuelli B & Kahn CR (2006) Critical
nodes in signalling pathways: insights into insulin
action. Nat Rev 7, 85–96.
7 Jacob S, Machann J, Rett K, Brechtel K, Volk A, Renn
W, Maerker E, Matthaei S, Schick F, Claussen CD
et al. (1999) Association of increased intramyocellular
lipid content with insulin resistance in lean nondiabetic
offspring of type 2 diabetic subjects. Diabetes 48,
1113–1119.
8 Krssak M, Falk Petersen K, Dresner A, DiPietro L,
Vogel SM, Rothman DL, Roden M & Shulman GI
(1999) Intramyocellular lipid concentrations are
correlated with insulin sensitivity in humans: a 1H
NMR spectroscopy study. Diabetologia 42, 113–116.
9 Pan DA, Lillioja S, Kriketos AD, Milner MR, Baur
LA, Bogardus C, Jenkins AB & Storlien LH (1997)
Skeletal muscle triglyceride levels are inversely related
to insulin action. Diabetes 46, 983–988.
10 Sinha R, Dufour S, Petersen KF, LeBon V, Enoksson
S, Ma YZ, Savoye M, Rothman DL, Shulman GI &
Caprio S (2002) Assessment of skeletal muscle triglycer-
ide content by (1)H nuclear magnetic resonance
spectroscopy in lean and obese adolescents: relation-
ships to insulin sensitivity, total body fat, and central
adiposity. Diabetes 51, 1022–1027.
11 Goodpaster BH, He J, Watkins S & Kelley DE (2001)
Skeletal muscle lipid content and insulin resistance:
evidence for a paradox in endurance-trained athletes.
J Clin Endocrinol Metab 86, 5755–5761.
12 Phillips SM, Green HJ, Tarnopolsky MA, Heigenhauser
GJ & Grant SM (1996) Progressive effect of endurance
training on metabolic adaptations in working skeletal
muscle. Am J Physiol 270, E265–E272.
13 Petersen KF & Shulman GI (2006) Etiology of insulin
resistance. Am J Med 119, S10–S16.
14 Hegarty BD, Furler SM, Ye J, Cooney GJ & Kraegen
EW (2003) The role of intramuscular lipid in insulin
resistance. Acta Physiol Scand 178, 373–383.
15 Brasaemle DL (2007) Thematic review series: adipocyte
biology. The perilipin family of structural lipid droplet
proteins: stabilization of lipid droplets and control of
lipolysis. J Lipid Res 48, 2547–2559.
16 Ducharme NA & Bickel PE (2008) Lipid droplets in
lipogenesis and lipolysis. Endocrinology 149, 942–949.
17 Martin S & Parton RG (2006) Lipid droplets: a unified
view of a dynamic organelle. Nat Rev 7, 373–378.
18 Brasaemle DL, Rubin B, Harten IA, Gruia-Gray J,
Kimmel AR & Londos C (2000) Perilipin A increases
triacylglycerol storage by decreasing the rate of
triacylglycerol hydrolysis. J Biol Chem 275, 38486–
38493.
19 Mottagui-Tabar S, Ryden M, Lofgren P, Faulds G,
Hoffstedt J, Brookes AJ, Andersson I & Arner P (2003)
Evidence for an important role of perilipin in the
J. de Wilde et al. Adipophilin protein expression in muscle
FEBS Journal 277 (2010) 761–773 ª 2009 The Authors Journal compilation ª 2009 FEBS 771
regulation of human adipocyte lipolysis. Diabetologia
46, 789–797.
20 Miyoshi H, Souza SC, Zhang HH, Strissel KJ,
Christoffolete MA, Kovsan J, Rudich A, Kraemer FB,
Bianco AC, Obin MS et al. (2006) Perilipin promotes
hormone-sensitive lipase-mediated adipocyte lipolysis
via phosphorylation-dependent and -independent
mechanisms. J Biol Chem 281, 15837–15844.
21 Tansey JT, Sztalryd C, Gruia-Gray J, Roush DL, Zee
JV, Gavrilova O, Reitman ML, Deng CX, Li C,
Kimmel AR et al. (2001) Perilipin ablation results in a
lean mouse with aberrant adipocyte lipolysis, enhanced
leptin production, and resistance to diet-induced
obesity. Proc Natl Acad Sci USA 98, 6494–6499.
22 Sztalryd C, Xu G, Dorward H, Tansey JT, Contreras
JA, Kimmel AR & Londos C (2003) Perilipin A is
essential for the translocation of hormone-sensitive
lipase during lipolytic activation. J Cell Biol 161,
1093–1103.
23 Murphy DJ (2001) The biogenesis and functions of lipid
bodies in animals, plants and microorganisms.
Prog Lipid Res 40, 325–438.
24 Gao J & Serrero G (1999) Adipose differentiation
related protein (ADRP) expressed in transfected COS-7
cells selectively stimulates long chain fatty acid uptake.
J Biol Chem 274, 16825–16830.
25 Listenberger LL, Ostermeyer-Fay AG, Goldberg EB,
Brown WJ & Brown DA (2007) Adipocyte differentia-
tion-related protein reduces the lipid droplet association
of adipose triglyceride lipase and slows triacylglycerol
turnover. J Lipid Res 48, 2751–2761.
26 Imamura M, Inoguchi T, Ikuyama S, Taniguchi S,
Kobayashi K, Nakashima N & Nawata H (2002)
ADRP stimulates lipid accumulation and lipid droplet
formation in murine fibroblasts. Am J Physiol
Endocrinol Metab 283, E775–E783.
27 Larigauderie G, Furman C, Jaye M, Lasselin C,
Copin C, Fruchart JC, Castro G & Rouis M (2004)
Adipophilin enhances lipid accumulation and prevents
lipid efflux from THP-1 macrophages: potential role
in atherogenesis. Arterioscler Thromb Vasc Biol 24,
504–510.
28 Bickel PE, Tansey JT & Welte MA (2009) PAT pro-
teins, an ancient family of lipid droplet proteins that
regulate cellular lipid stores. Biochim Biophys Acta
1791, 419–440.
29 Yamaguchi T, Matsushita S, Motojima K, Hirose F &
Osumi T (2006) MLDP, a novel PAT family protein
localized to lipid droplets and enriched in the heart, is
regulated by peroxisome proliferator-activated receptor
alpha. J Biol Chem 281, 14232–14240.
30 Minnaard R, Schrauwen P, Schaart G, Jorgensen JA,
Lenaers E, Mensink M & Hesselink MK (2009)
Adipocyte differentiation-related protein and OXPAT
in rat and human skeletal muscle: involvement in lipid
accumulation and type 2 diabetes mellitus. J Clin
Endocrinol Metab 94, 4077–4085.
31 Phillips SA, Choe CC, Ciaraldi TP, Greenberg AS,
Kong AP, Baxi SC, Christiansen L, Mudaliar SR &
Henry RR (2005) Adipocyte differentiation-related
protein in human skeletal muscle: relationship to insulin
sensitivity. Obes Res 13, 1321–1329.
32 Xu G, Sztalryd C, Lu X, Tansey JT, Gan J, Dorward
H, Kimmel AR & Londos C (2005) Post-translational
regulation of adipose differentiation-related protein by
the ubiquitin ⁄ proteasome pathway. J Biol Chem 280,
42841–42847.
33 Russell TD, Palmer CA, Orlicky DJ, Bales ES, Chang
BH, Chan L & McManaman JL (2008) Mammary
glands of adipophilin-null mice produce an amino-
terminally truncated form of adipophilin that mediates
milk lipid droplet formation and secretion. J Lipid Res
49, 206–216.
34 Vessal M, Mishra S, Moulik S & Murphy LJ (2006)
Prohibitin attenuates insulin-stimulated glucose and
fatty acid oxidation in adipose tissue by inhibition of
pyruvate carboxylase. FEBS J 273
, 568–576.
35 Claessens M, Saris WHM, Bouwman FG, Evelo CTA,
Hul GBJ, Blaak EE & Mariman ECM (2007) Differen-
tial valine metabolism in adipose tissue of low and high
fat-oxidizing obese subjects. Proteomics Clin Appl 1,
1306–1355.
36 Hirabara SM, Curi R & Maechler P (2010) Saturated
fatty acid-induced insulin resistance is associated with
mitochondrial dysfunction in skeletal muscle cells.
J Cell Physiol 222, 187–194.
37 Ragheb R, Shanab GM, Medhat AM, Seoudi DM,
Adeli K & Fantus IG (2009) Free fatty acid-induced
muscle insulin resistance and glucose uptake dysfunc-
tion: evidence for PKC activation and oxidative stress-
activated signaling pathways. Biochem Biophys Res
Commun 389, 211–216.
38 Wang C, Liu M, Riojas RA, Xin X, Gao Z, Zeng R,
Wu J, Dong LQ & Liu F (2009) Protein kinase C theta
(PKCtheta)-dependent phosphorylation of PDK1 at
Ser504 and Ser532 contributes to palmitate-induced
insulin resistance. J Biol Chem 284, 2038–2044.
39 Prats C, Donsmark M, Qvortrup K, Londos C,
Sztalryd C, Holm C, Galbo H & Ploug T (2006)
Decrease in intramuscular lipid droplets and
translocation of HSL in response to muscle contraction
and epinephrine. J Lipid Res 47, 2392–2399.
40 Shaw CS, Sherlock M, Stewart PM & Wagenmakers AJ
(2009) Adipophilin distribution and colocalisation with
lipid droplets in skeletal muscle. Histochem Cell Biol
131, 575–581.
41 Listenberger LL, Han X, Lewis SE, Cases S, Farese RV
Jr, Ory DS & Schaffer JE (2003) Triglyceride accumula-
tion protects against fatty acid-induced lipotoxicity.
Proc Natl Acad Sci USA 100, 3077–3082.
Adipophilin protein expression in muscle J. de Wilde et al.
772 FEBS Journal 277 (2010) 761–773 ª 2009 The Authors Journal compilation ª 2009 FEBS
42 Chavez JA & Summers SA (2003) Characterizing the
effects of saturated fatty acids on insulin signaling and
ceramide and diacylglycerol accumulation in 3T3-L1
adipocytes and C2C12 myotubes. Arch Biochem Biophys
419, 101–109.
43 Coll T, Eyre E, Rodriguez-Calvo R, Palomer X,
Sanchez RM, Merlos M, Laguna JC & Vazquez-
Carrera M (2008) Oleate reverses palmitate-induced
insulin resistance and inflammation in skeletal muscle
cells. J Biol Chem 283, 11107–11116.
44 Dalen KT, Ulven SM, Arntsen BM, Solaas K & Nebb
HI (2006) PPARalpha activators and fasting induce the
expression of adipose differentiation-related protein in
liver. J Lipid Res 47, 931–943.
45 Targett-Adams P, McElwee MJ, Ehrenborg E, Gustafs-
son MC, Palmer CN & McLauchlan J (2005) A PPAR
response element regulates transcription of the gene for
human adipose differentiation-related protein. Biochim
Biophys Acta 1728, 95–104.
46 Chawla A, Lee CH, Barak Y, He W, Rosenfeld J, Liao
D, Han J, Kang H & Evans RM (2003) PPARdelta is a
very low-density lipoprotein sensor in macrophages.
Proc Natl Acad Sci USA 100, 1268–1273.
47 Lee CH, Chawla A, Urbiztondo N, Liao D, Boisvert
WA, Evans RM & Curtiss LK (2003) Transcriptional
repression of atherogenic inflammation: modulation by
PPARdelta. Science (New York, NY) 302 , 453–457.
48 Vosper H, Patel L, Graham TL, Khoudoli GA, Hill A,
Macphee CH, Pinto I, Smith SA, Suckling KE, Wolf
CR et al. (2001) The peroxisome proliferator-activated
receptor delta promotes lipid accumulation in human
macrophages. J Biol Chem 276, 44258–44265.
49 Brown PJ, Stuart LW, Hurley KP, Lewis MC, Winegar
DA, Wilson JG, Wilkison WO, Ittoop OR & Willson
TM (2001) Identification of a subtype selective human
PPAR[alpha] agonist through parallel-array synthesis.
Bioorg Med Chem Lett 11, 1225–1227.
50 Luquet S, Lopez-Soriano J, Holst D, Fredenrich A,
Melki J, Rassoulzadegan M & Grimaldi PA (2003)
Peroxisome proliferator-activated receptor delta
controls muscle development and oxidative capability.
FASEB J 17, 2299–2301.
51 Wang YX, Zhang CL, Yu RT, Cho HK, Nelson MC,
Bayuga-Ocampo CR, Ham J, Kang H & Evans RM
(2004) Regulation of muscle fiber type and running
endurance by PPARdelta. PLoS Biol 2, e294.
52 Kersten S, Desvergne B & Wahli W (2000) Roles of
PPARs in health and disease. Nature 405, 421–424.
53 Chanseaume E, Malpuech-Brugere C, Patrac V, Bielicki
G, Rousset P, Couturier K, Salles J, Renou JP, Boirie
Y & Morio B (2006) Diets high in sugar, fat, and
energy induce muscle type-specific adaptations in
mitochondrial functions in rats. J Nutr 136, 2194–2200.
54 McManaman JL, Zabaronick W, Schaack J & Orlicky
DJ (2003) Lipid droplet targeting domains of adipophi-
lin. J Lipid Res 44, 668–673.
55 Nakamura N & Fujimoto T (2003) Adipose differentia-
tion-related protein has two independent domains for
targeting to lipid droplets. Biochem Biophys Res Com-
mun 306, 333–338.
56 Targett-Adams P, Chambers D, Gledhill S, Hope RG,
Coy JF, Girod A & McLauchlan J (2003) Live cell
analysis and targeting of the lipid droplet-binding
adipocyte differentiation-related protein. J Biol Chem
278, 15998–16007.
57 Langen RC, Schols AM, Kelders MC, Wouters EF &
Janssen-Heininger YM (2003) Enhanced myogenic
differentiation by extracellular matrix is regulated at the
early stages of myogenesis. In Vitro Cell Dev Biol 39,
163–169.
58 Bouwman F, Renes J & Mariman E (2004) A combina-
tion of protein profiling and isotopomer analysis using
matrix-assisted laser desorption ⁄ ionization-time of flight
mass spectrometry reveals an active metabolism of the
extracellular matrix of 3T3-L1 adipocytes Proteomics 4,
3855–3863.
59 de Wilde J, Mohren R, van den Berg S, Boekschoten
M, Dijk KW, de Groot P, Muller M, Mariman E &
Smit E (2008) Short-term high fat-feeding results in
morphological and metabolic adaptations in the skeletal
muscle of C57BL ⁄ 6J mice. Physiol Genomics 32,
360–369.
60 de Wit NJ, Bosch-Vermeulen H, de Groot PJ,
Hooiveld GJ, Bromhaar MM, Jansen J, Muller M &
van der Meer R (2008) The role of the small intestine in
the development of dietary fat-induced obesity and
insulin resistance in C57BL ⁄ 6J mice. BMC Med
Genomics 1, 14.
J. de Wilde et al. Adipophilin protein expression in muscle
FEBS Journal 277 (2010) 761–773 ª 2009 The Authors Journal compilation ª 2009 FEBS 773