Báo cáo khoa học: Functional dissection of Escherichia coli phosphotransacetylase structural domains and analysis of key compounds involved in activity regulation potx
Bạn đang xem bản rút gọn của tài liệu. Xem và tải ngay bản đầy đủ của tài liệu tại đây (334.63 KB, 10 trang )
Functional dissection of Escherichia coli
phosphotransacetylase structural domains and analysis
of key compounds involved in activity regulation
Valeria Alina Campos-Bermudez, Federico Pablo Bologna, Carlos Santiago Andreo and
Marı
´
a Fabiana Drincovich
Centro de Estudios Fotosinte
´
ticos y Bioquı
´
micos (CEFOBI), Universidad Nacional de Rosario, Argentina
Introduction
The successful adaptation of Escherichia coli to nutri-
tional changes depends primarily on metabolic
switches from programs that allow rapid growth on
abundant nutrients to others that permit survival in
their absence. One important switch, called ‘the acetate
switch’, involves the transition from the production to
the utilization of acetate from the medium [1]. During
exponential growth on rich medium, E. coli cells
excrete acetate into the environment as a way, among
other reasons, to recycle CoA and regenerate NAD
+
,
Keywords
acetyl-phosphate; activity regulation;
Escherichia coli; phosphotransacetylase;
protein domain
Correspondence
M. F. Drincovich, Suipacha 531, 2000
Rosario, Argentina
Fax: +54 341 4370044
Tel: +54 341 4371955
E-mail:
(Received 15 January 2010, revised
11 February 2010, accepted 12 February
2010)
doi:10.1111/j.1742-4658.2010.07617.x
Escherichia coli phosphotransacetylase (Pta) catalyzes the reversible inter-
conversion of acetyl-CoA and acetyl phosphate. Both compounds are
critical in E. coli metabolism, and acetyl phosphate is also involved in
the regulation of certain signal transduction pathways. Along with acetate
kinase, Pta plays an important role in acetate production when E. coli
grows on rich medium; alternatively, it is involved in acetate utilization
at high acetate concentrations. E. coli Pta is composed of three different
domains, but only the C-terminal one, called PTA_PTB, is specific for
all Ptas. In the present work, the characterization of E. coli Pta and
deletions from the N-terminal region were performed. E. coli Pta acetyl
phosphate-forming and acetyl phosphate-consuming reactions display dif-
ferent maximum activities, and are differentially regulated by pyruvate
and phosphoenolpyruvate. These compounds activate acetyl phosphate
production, but inhibit acetyl-CoA production, thus playing a critical
role in defining the rates of the two Pta reactions. The characterization
of three truncated Ptas, which all display Pta activity, indicates that the
substrate-binding site is located at the C-terminal PTA_PTB domain.
However, the N-terminal P-loop NTPase domain is involved in expres-
sion of the maximal catalytic activity, stabilization of the hexameric
native state, and Pta activity regulation by NADH, ATP, phosphoenol-
pyruvate, and pyruvate. The truncated protein Pta-F3 was able to com-
plement the growth on acetate of an E. coli mutant defective in acetyl-
CoA synthetase and Pta, indicating that, although not regulated by
metabolites, the Pta C-terminal domain is active in vivo.
Abbreviations
AckA, acetate kinase; Acs, acetyl-CoA synthetase; CDD, Conserved Domain Database; IPTG, isopropyl thio-b-
D-galactoside;
PEP, phosphoenolpyruvate; Pta, phosphotransacetylase.
FEBS Journal 277 (2010) 1957–1966 ª 2010 The Authors Journal compilation ª 2010 FEBS 1957
producing ATP [1]. On the other hand, during the
transition to the stationary growth phase, the machin-
ery responsible for acetate assimilation is activated,
and the cells begin to utilize acetate instead of excret-
ing it.
Acetate production and utilization are catalyzed by
different metabolic pathways in E. coli. Whereas ace-
tate utilization depends primary on acetyl-CoA synthe-
tase (Acs; EC 6.2.1.1), acetate production is catalyzed
by two enzymes: acetate kinase (AckA; EC 2.7.2.1)
and phosphotransacetylase (Pta; EC 2.3.1.8) (Fig. 1A).
Acs is the high-affinity system for acetyl-CoA synthe-
sis, and the enzyme catalyzes an irreversible pathway,
owing to intracellular pyrophosphatases that remove
pyrophosphate (Fig. 1) [2]. However, the Pta–AckA
pathway is reversible, acetyl phosphate being an inter-
mediate of this pathway (Fig. 1A). On the other hand,
the reversible Pta–AckA pathway can also assimilate
acetate [3], but only at high concentrations of this
compound.
Two classes of Ptas can be found among micro-
organisms: PtaIs, which are nearly 350 amino acids
in length; and PtaIIs, which are twice as long as
PtaIs (nearly 700 amino acids in length) [4,5]. These
two types of protein share about 40% identity.
Although several crystal structures of PtaIs have
been analyzed [6–8], there is as yet no crystal study
on the larger isoenzymes. From sequence alignment
among the different Ptas, it is clear that PtaIs share
homology with the C-terminal domain of PtaIIs.
Thus, the active site of PtaIIs is probably located at
the C-terminal end of the protein, and the role of
the PtaII N-terminal domain has not yet been com-
pletely resolved.
Recently, PtaII from Salmonella enterica and sev-
eral single amino acid variants were characterized
[5]. With regard to the biochemical characterization
of PtaII from E. coli, an earlier investigation showed
activity regulation by nucleotides, NADH, and pyru-
vate [9]. The study of this enzyme is relevant
because, together with AckA, it catalyzes the conver-
sion of acetyl-CoA to acetate via acetyl phosphate.
Acetyl phosphate participates in the regulation of
certain two-component signal transduction pathways,
and also protects cells against carbon starvation
[1,10]. Moreover, Pta has been suggested to act as a
sensor and ⁄ or response regulator for the intracellular
acetyl-CoA ⁄ CoA concentration ratio [3]. Thus, in
this work, we focused on the biochemical character-
ization of E. coli Pta and set out to investigate the
function of its N-terminal domain by the construc-
tion and analysis of three E. coli Ptas with deletions
from the N-terminal region. The results obtained
indicate that, although the substrate-binding site is
located in the C-terminal domain, the E. coli Pta
N-terminal domain is involved in stabilization of the
hexameric native structure, in expression of the max-
imum catalytic activity, and in allosteric regulation
by NADH, ATP, pyruvate, and phosphoenolpyruvate
(PEP).
Acetyl-CoA
Acetate
Pta
Acetyl-AMPAcetyl-P
Ack
Acs
Acs
P
i
CoA
ADP
ATP
AMP
CoA
PP
i
ATP
2P
i
PPasa
Glucose
PEP
Pyruvate
Acetyl-CoA
Acetate
CoA
NADH
NAD
+
CO
2
Acetyl-P
Pta
P
i
CoA
P
i
CoA
ADP
ATP
+
-
Acetate excretion
Acetate assimilatio
n
AB
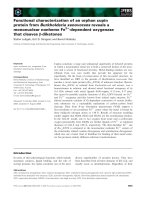
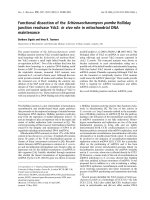
Fig. 1. (A) Pathways of acetate activation
and production in E. coli. Acs catalyzes an
irreversible pathway for high-affinity acetate
activation, and AckA and Pta catalyze a
reversible pathway involved in acetate
production or assimilation at high acetate
concentration. (B) Regulation of the forward
and reverse Pta reactions. Pta catalyzes
both the synthesis and degradation of
acetyl-CoA. These two reactions are
differentially regulated by pyruvate and PEP,
which activate acetyl-CoA degradation and
inhibit acetyl-CoA synthesis. Acetyl-P, acetyl
phosphate.
Escherichia coli phosphotransacetylase V. A. Campos-Bermudez et al.
1958 FEBS Journal 277 (2010) 1957–1966 ª 2010 The Authors Journal compilation ª 2010 FEBS
Results
Expression and purification of E. coli Pta and
truncated Ptas containing the C-terminal end
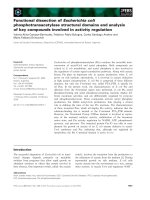
By analysis of the protein domain architecture of
E. coli Pta, three conserved domains can be detected
[Conserved Domain Database (CDD)] [11]: the P-loop,
containing NTPase at the N-terminal end
(CDD cl09099; Fig. 2); a DRTGG domain
(CDD pfam07085; Fig. 2); and a domain shared by
the phosphate acetyl ⁄ butaryl transferases (PTA_PTB;
CDD cl00390; Fig. 2) at the C-terminal end. The
members of the P-loop NTPase domain superfamily
(N-terminal domain in E. coli Pta; Fig. 2) are charac-
terized by a conserved nucleotide phosphate-binding
motif, and are involved in diverse cellular functions.
The second domain found in Pta (DRTGG
domain; Fig. 2) has been associated with cystathione-
beta-synthase domain pfam00571 and cobyrinic acid
a,c-diamide synthase domain pfam01656. This domain
has been named according to some of the most
conserved residues, but its function is unknown.
Finally, the domain at the C-terminal end (PTA_PTB;
Fig. 2) is found in phosphate acetyltransferase and
phosphate butaryltransferase. Moreover, PtaI-type
Ptas, found in several microorganisms, are composed
only of this PTA_PTB protein domain. Thus, this is
the only domain in E. coli Pta that can be directly
associated with the catalytic activity of the enzyme. In
this way, in order to elucidate the functionality of the
N-terminal end of E. coli Pta, three different truncated
Ptas that span the C-terminal domain of this protein
were generated (Pta-F1, Pta-F2, and Pta-F3; Fig. 2).
Pta-F1 was designed in order to contain only the
domain found in phosphate acetyltransferase and to
exclude the extra domains with unknown function in
E. coli Pta. Pta-F2 is 30 amino acids longer than
Pta-F1, whereas Pta-F3 was designed to contain the
DRTGG domain and the PTA_PTB domains, while
excluding the P-loop NTPase domain (Fig. 2).
E. coli recombinant Pta fused to a His-tag was
purified to homogeneity by an affinity approach,
using an Ni
2+
–agarose column. The monomer molec-
ular mass of the purified protein was 77 kDa, which
corresponds to the predicted molecular mass of the
protein [12] (Fig. 3A). The three truncated Ptas
(Pta-F1, Pta-F2, and Pta-F3) were also successfully
overexpressed as N-terminal fusion proteins with
His-tags. The truncated Ptas were purified to homo-
geneity, and the molecular mass of each of them,
assessed by SDS ⁄ PAGE, was in agreement with that
predicted from the protein constructs, i.e. 36 kDa for
Pta-F1, 38 kDa for Pta-F2, and 51 kDa for Pta-F3
(Fig. 3A).
CD spectra of the truncated Ptas
Besides the good expression levels as soluble proteins
of the truncated Ptas, their folding state was evaluated
with CD spectroscopy. Despite the absence of an
important portion of the protein, all of the truncated
Ptas conserved the secondary structure (Fig. 4). In this
respect, CD spectra for Pta-F1, Pta-F2 and Pta-F3
were comparable, but not identical, to the spectrum of
the entire protein (Fig. 4). The differences among the
spectra may be due to the lack of different regions of
the N-terminal end in the truncated Ptas.
Pta-F1
Pta-F2
Pta-F3
100
200 300 400 500 600 700
Pta
PTA_PTB
DRTGG
P-loop NTPase
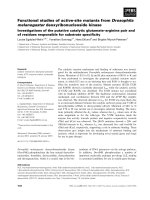
Fig. 2. Recombinant E. coli Pta and truncated Ptas characterized in
the present work. The ruler indicates the number of amino acids in
each protein. In boxes, the putative conserved domains (CDD pro-
tein classification) in E. coli Pta: P-loop NTPase domain; DRTGG
domain; and PTA_PTB domain. The truncated Ptas, Pta-F1, Pta-F2,
and Pta-F3 (326, 352 and 470 amino acids, respectively), have the
C-terminal domain alone or the C-terminal domain plus 30 amino
acids of the DRTGG domain or the complete DRTGG domain,
respectively.
1234
MM
51-
38-
36-
77-
-116
-66
-45
-35
kDa
-25
-18
1234
MM
-660
-440
-232
-140
-66
kDa
AB
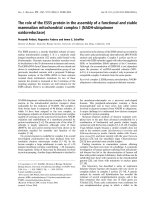
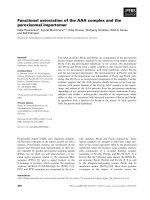
Fig. 3. Purified recombinant E. coli Pta and truncated Ptas. (A)
Coomassie Blue-stained SDS ⁄ PAGE (5 lg of each protein) of
recombinant purified Pta (lane 1), Pta-F3 (lane 2), Pta-F2 (lane 3),
and Pta-F1 (lane 4). The calculated molecular masses of the purified
proteins are indicated on the left. Molecular mass markers (MM)
were loaded on the right. (B) Coomassie Blue-stained native gel
(5 lg of each protein) of purified recombinant Pta (lane 1), Pta-F1
(lane 2), Pta-F2 (lane 3), and Pta-F3 (lane 4). Native molecular mass
markers (MM) were loaded on the right.
V. A. Campos-Bermudez et al. Escherichia coli phosphotransacetylase
FEBS Journal 277 (2010) 1957–1966 ª 2010 The Authors Journal compilation ª 2010 FEBS 1959
Kinetic characterization of E. coli Pta and
truncated Ptas
The three truncated Ptas displayed Pta catalytic activ-
ity. Thus, the kinetic parameters of the entire Pta and
Pta-F1, Pta-F2 and Pta-F3 were determined using the
conditions in which the in vitro Pta activity was opti-
mal, and compared for both the forward (acetyl-CoA
synthesis) and reverse (acetyl phosphate synthesis)
directions of the Pta reaction (Fig. 1B).
Kinetic parameters for the Pta forward reaction
(acetyl-CoA-forming)
Different kinetic responses of E. coli Pta were observed
for acetyl phosphate and CoA. Whereas the kinetic
response in the case of acetyl phosphate was hyperbolic,
sigmoidal kinetics were observed with respect to CoA,
with a Hill coefficient of 1.7 (Table 1). The enzyme
displayed measurably higher affinity for CoA than for
acetyl phosphate, with a relatively high k
cat
value
(227.6 s
)1
; Table 1).
On the other hand, despite the absence of the N-ter-
minal end in the three truncated Ptas, the affinity for
the two substrates, CoA and acetyl phosphate, was
almost the same when Pta was compared with the
three truncated Ptas (Table 1). This result indicates
that the binding site for the substrates has not been
significantly modified by the deletions. Moreover, in
the case of Pta-F3, the sigmoidal response when the
CoA concentration was varied was maintained, with a
Hill coefficient of 1.6 (Table 1). However, in the case
of Pta-F2 and Pta-F1, the sigmoidal response was lost
(Table 1). On the other hand, the k
cat
values for
Pta-F1, Pta-F2 and Pta-F3 were significantly reduced
with respect to the complete Pta, displaying values
lower than 1% of the k
cat
estimated for the complete
Pta (Table 1).
Kinetic parameters for the E. coli Pta reverse
reaction (acetyl phosphate-forming)
With regard to the reverse reaction catalyzed by E. coli
Pta, a nearly eight-fold lower k
cat
value than for ace-
tyl-CoA synthesis was observed (Table 1). Sigmoidal
kinetics with respect to acetyl-CoA were obtained, with
a Hill coefficient of 1.3 (Table 1).
On the other hand, when the truncated Ptas were
analyzed, very low k
cat
values were measured, from
1.5% to 0.1% of the estimated k
cat
for the complete
Pta (Table 1). However, as the case of the acetyl-CoA
synthesis reaction, the affinity for the substrate was
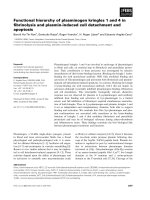
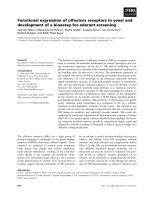
Fig. 4. Comparative CD spectra of E. coli Pta and truncated Ptas.
CD spectra of Pta, Pta-F1 and Pta-F2 were recorded in the far-UV
range (190–260 nm). Five repetitive scans were obtained using
10 l
M each enzyme. The Pta-F3 CD spectrum (not shown) was
practically the same as those obtained for the other truncated Ptas.
Table 1. Kinetic parameters for the forward reaction (acetyl-CoA-forming) and reverse reaction (acetyl phosphate-forming) of E. coli Pta and
truncated Ptas. Kinetic values are given as average ± standard deviation. Each value is averaged over at least two different enzyme prepara-
tions. Ac-P, acetyl phosphate; Ac-CoA, acetyl-CoA; NA, not applicable.
Acetyl-CoA-forming reaction
K
m, Ac-P
(mM) K
m, CoA
(lM) Hill constant for CoA V
max
(UI ⁄ mg) k
cat
(s
)1
)
Pta 0.9 ± 0.1 67.2 ± 5.3
a
1.7 ± 0.2 177.4 ± 6.2 227.6 ± 9.3
Pta–F1 1.7 ± 0.2 59.6 ± 3.5 NA 2.6 ± 0.4 1.56 ± 0.5
Pta–F2 2.4 ± 0.4 62.3 ± 2.5 NA 0.24 ± 0.05 0.15 ± 0.03
Pta–F3 1.1 ± 0.1 65.8 ± 2.2
a
1.6 ± 0.1 2.6 ± 0.2 2.16 ± 0.3
Acetyl phosphate-forming reaction
S
0.5, Ac-CoA
(lM) Hill constant K
m
, phosphate (m M) V
max
(UI ⁄ mg) K
cat
(s
)1
)
Pta 44.9 ± 4.1 1.3 ± 0.3 2.1 ± 0.2 23.1 ± 2.1 29.6 ± 2.3
Pta–F1 28.5 ± 5.2 2.1 ± 0.4 1.5 ± 0.1 0.38 ± 0.1 0.23 ± 0.1
Pta–F2 39.1 ± 5.5 1.3 ± 0.2 1.9 ± 0.2 0.05 ± 0.02 0.029 ± 0.01
Pta–F3 58.3 ± 6.1 1.8 ± 0.1 3.0 ± 0.3 0.51 ± 0.2 0.43 ± 0.2
a
Kinetics for these reactions are sigmoidal, and the reported values are S
0.5
values, not true K
m
values.
Escherichia coli phosphotransacetylase V. A. Campos-Bermudez et al.
1960 FEBS Journal 277 (2010) 1957–1966 ª 2010 The Authors Journal compilation ª 2010 FEBS
not significantly modified in the truncated versions in
relation to the complete Pta (Table 1). Moreover, in
some cases (such as Pta-F1), even higher affinity for
acetyl-CoA was observed, with an increase in the Hill
coefficient value (Table 1).
Regulation of E. coli Pta and truncated Pta
activity by metabolic effectors
The effects of several metabolites that acted as meta-
bolic effectors of different Ptas were analyzed for the
recombinant E. coli Pta and the three truncated Ptas
in both the forward and reverse reactions (Fig. 5A).
NADH and ATP substantially inhibited the activ-
ity of E. coli Pta in both directions (Fig. 5A). On the
other hand, pyruvate and PEP displayed differential
behavior, depending on the direction of the Pta reac-
tion analyzed (Fig. 5A). In this way, these com-
pounds acted as activators of the acetyl phosphate-
forming reaction while inhibiting the formation of
acetyl-CoA (Fig. 5A). The activation of the E. coli
Pta acetyl phosphate-forming reaction was analyzed
at different pyruvate and PEP concentrations
(Fig. 5B). The results obtained indicate that the maxi-
mum percentage of activation is reached at concen-
trations higher than 0.5 mm PEP or 10 mm pyruvate
(Fig. 5B).
On the other hand, E. coli Pta acetyl phosphate-
forming activity was measured in the presence of acti-
vators (pyruvate or PEP) and inhibitors (NADH or
ATP) (Fig. 5A). The results indicate that PEP is able
to reverse, in part, the inhibitory effects of both
NADH and ATP (Fig. 5A). In the case of pyruvate,
although partial reversal of NADH inhibition was
observed, total reversal of ATP inhibition was found
(Fig. 5A).
The regulatory properties of the truncated Ptas were
also studied (Fig. 5A). For the three polypeptides, any
of the compounds analyzed (NADH, pyruvate, ATP,
and PEP) was able to modify the enzyme activity, at
different concentrations, in both the forward and
reverse reactions.
Pta-F3
Ac-CoA synthesis activity (%)
0
20
40
60
80
100
120
0
20
40
60
80
100
120
Ac-P synthesis activity (%)
No
addition
NADH Pyr ATP PEP
[PEP] (mM)
100
105
110
115
120
0 0.5 1.0 1.5 2.0
[Pyruvate] (m
M
)
0 5 10 15 20 25 30
Ac-P synthesis activity (%)
Ac-P synthesis activity (%)
100
110
120
130
140
Ac-CoA synthesis activity (%)
0
20
40
60
80
100
120
140
0
20
40
60
80
100
120
140
Ac-P synthesis activity (%)
No
addition
NADH Pyr ATP PEP Pyr
+
NADH
PEP
+
NADH
PEP
+
ATP
Pyr
+
ATP
Pta
A
B
Fig. 5. Regulatory properties of the recombinant E. coli Pta and Pta-F3 in the acetyl-CoA (Ac-CoA)-forming or acetyl phosphate (Ac-P)-forming
directions. (A) The activities of Pta and Pta-F3 in the forward and reverse reactions were monitored in the absence or presence of 0.8 m
M
NADH, ATP, and ⁄ or PEP, and ⁄ or 15 mM pyruvate (Pyr), as indicated on the axes. Substrate concentrations were maintained at the K
m
for each
enzyme (Table 1). Results are presented as percentage activity in the presence of the effectors relative to the activity measured in the absence
of the metabolites. Assays were performed at least in triplicate, and error bars indicate standard deviations. Similar results to that obtained for
Pta-F3 were obtained for Pta-F2 and Pta-F1. (B) Activation of the acetyl phosphate synthesis activity of E. coli Pta by different concentrations of
pyruvate and PEP. Results are presented as percentage of activity in the presence of PEP or pyruvate relative to the activity measured in the
absence of the metabolites. Assays were performed at least in triplicate, and error bars indicate standard deviations.
V. A. Campos-Bermudez et al. Escherichia coli phosphotransacetylase
FEBS Journal 277 (2010) 1957–1966 ª 2010 The Authors Journal compilation ª 2010 FEBS 1961
Oligomeric state of Pta and the truncated Ptas
The native oligomeric state of recombinant E. coli Pta
was analyzed by size exclusion chromatography. With
this technique, a native molecular mass of
484 ± 5 kDa was obtained, indicating that E. coli Pta
assembles as a hexamer (77 kDa per subunit; Fig. 3A).
Native electrophoresis of recombinant E. coli Pta was
also performed (Fig. 3B). In this case, the estimated
molecular mass obtained (nearly 475 kDa) was similar
to that obtained by size exclusion chromatography,
validating the use of this technique for estimating the
native assembly of this protein.
On the other hand, in order to evaluate the contri-
bution of the N-terminal end to the formation of the
final oligomeric state of Pta, the native conformational
state of the truncated polypeptides was analyzed. By
size exclusion chromatography, several different pro-
tein peaks were obtained (not shown), indicating that
Pta-F1, Pta-F2 and Pta-F3 displayed different aggre-
gates, ranging from dimers to hexamers, in similar pro-
portions. The results with native electrophoresis were
same as those obtained by exclusion chromatography,
and the truncated Ptas presented a mixture of different
oligomers (Fig. 3B). Thus, the profiles obtained suggest
the existence of dimers and hexamers in equilibrium
for the truncated Ptas. Therefore, the absence of the
N-terminal domain is unfavorable for the formation of
the native hexameric structure of Pta.
Complementation experiments on the E. coli
acs pta mutant growing on acetate
The E. coli acs pta double mutant (FB22) is not able
to grow on a minimal medium with acetate as a sole
carbon source (Fig. 6). In order to evaluate the ability
of Pta-F3 to complement FB22 when growing on a
high acetate concentration, complete E. coli Pta or
Pta-F3 were introduced into this mutant strain, and
the growth on acetate was evaluated.
The results obtained indicate that the introduction
of complete E. coli Pta or Pta-F3 was able to comple-
ment FB22 growth on acetate (Fig. 6), giving similar
final attenuance values after 90 h of incubation at
37 °C.
Discussion
Biochemical properties of E. coli Pta in relation to
its physiological role
In the present work, detailed biochemical characteriza-
tion of E. coli Pta was performed. The enzyme was
nearly eight-fold more active in the direction of acetyl-
CoA synthesis than in the direction of acetyl phosphate
formation (Table 1). However, these two activities are
differentially regulated by pyruvate and PEP, which
both act as positive effectors of the acetyl phosphate-
forming reaction and as negative effectors of the
opposite reaction (Fig. 5). Thus, these compounds
highly favor E. coli Pta acetyl phosphate synthesis
activity. This differential Pta activity regulation by
pyruvate and PEP may be important in vivo, as this
enzyme is involved in balancing pyruvate flux when
E. coli grows on rich medium, by opting for acetate
excretion [13]. Thus, high levels of pyruvate and ⁄ or PEP
activate acetate excretion by favoring the Pta acetyl
phosphate reaction (Fig. 1B). On the other hand, E. coli
Pta was negatively modified by NADH and ATP in both
directions of the reaction, which is in accord with the
fact that when the tricarboxylic acid cycle is operating,
acetate excretion by the Pta–AckA pathway is reduced.
However, in the presence of pyruvate or PEP, the
inhibitory effect of NADH or ATP is partially or totally
reversed (Fig. 5A), indicating the relevance of these
compounds in the activation of acetate excretion
(Fig. 1B).
E. coli Pta K
m
values for the substrates (Table 1)
were compared with the absolute metabolite concentra-
tions in E. coli growing on glucose or acetate [14], as
these concentrations are critical for understanding the
in vivo rate of the Pta reaction. In this regard, the
acetyl-CoA concentration in E. coli is far higher than
the estimated Pta K
m
, indicating that Pta is operating
at the maximum rate when catalyzing acetyl phosphate
Time (h)
0 20406080
D
600 nm
0.6
0.4
0.2
0
Fig. 6. Growth on acetate of the E. coli acs pta double mutant (•)
transformed with E. coli Pta (s) or Pta-F3 (.). The culture medium
contained M9 salts supplemented with 15 m
M acetate. Results are
the mean of at least three independent studies with no more than
5% standard deviation.
Escherichia coli phosphotransacetylase V. A. Campos-Bermudez et al.
1962 FEBS Journal 277 (2010) 1957–1966 ª 2010 The Authors Journal compilation ª 2010 FEBS
formation for acetate excretion (Fig. 1B). However, for
the reverse reaction, the estimated K
m
for acetyl phos-
phate is almost equal to the absolute concentration of
this compound in E. coli growing on glucose [14].
Thus, although E. coli Pta is more active in the direc-
tion of acetyl-CoA synthesis (Table 1), the in vivo con-
centrations of Pta substrates and products when
E. coli grows on glucose favor acetyl phosphate syn-
thesis (Fig. 1B). On the other hand, the acetyl phos-
phate concentration significantly increases when E. coli
grows on acetate [14], allowing Pta to operate at the
maximum rate for acetate assimilation (Fig. 1B).
By size exclusion chromatography, E. coli Pta was
found to assemble as a hexamer. Practically the same
native molecular mass was estimated for S. enterica
Pta [5]. In this way, the positive cooperative effect
found in CoA and acetyl-CoA binding (Table 1) would
be due to interactions among the active sites in the
oligomeric Pta.
Recently, a detailed biochemical characterization of
S. enterica Pta was performed [5]. When the kinetic
performance of the enzymes is compared, although
the maximum activities in both directions of the
reaction are in the same order of magnitude, there is
a notably higher affinity of E. coli Pta for both CoA
and acetyl-CoA. Thus, E. coli Pta K
m
values for CoA
and acetyl-CoA are 2.4-fold and 7.3-fold lower than
the K
m
values for S. enterica Pta, respectively
(Table 1 [5]). Thus, although the two proteins share
95% identity, specific changes in amino acids may be
involved in the affinity differences. With regard to
metabolic regulation, acetyl phosphate synthesis by
S. enterica Pta is also activated by pyruvate and
inhibited by NADH [5], as in E. coli (Fig. 5),
although these compounds were not tested in the
acetyl-CoA synthesis direction.
Pta-F3 is able to complement E. coli acs pta
growth on acetate
E. coli employs two different mechanisms for the
incorporation of acetate into the cell, either directly
through the activity of Acs (high-affinity pathway), or
in a way involving AckA and Pta enzymes (low-affinity
pathway) (Fig. 1A). Therefore, an acs pta double
mutant strain is unable to grow on minimal medium
with acetate as a sole carbon source (Fig. 6). In the
present work, we have found that this deficiency can
be corrected not only by complementation with the
complete E. coli Pta, but also by complementation
with Pta-F3 (Fig. 6), which displays very low activity
and is not regulated by metabolites at all. It is thus
possible that the metabolic regulation of E. coli Pta is
relevant for E. coli metabolic fitness when growing on
glucose.
The E. coli Pta N-terminal end is involved in
native protein stabilization and metabolic
regulation
In the present work, three truncated Ptas with deletions
in the N-terminal region were constructed: Pta-F1, con-
taining only the PTA_PTB domain; Pta-F3, containing
the DRTGG and the PTA_PTB domains; and Pta-F2,
which is 30 amino acids longer than Pta-F1 (Fig. 2). The
three truncated Ptas were successfully purified to homo-
geneity (Fig. 3), and conserved the secondary structure
of the complete Pta, as assessed by CD spectroscopy
(Fig. 4). Moreover, the truncated Ptas displayed Pta
activity in both reaction directions, with comparable
affinity for the substrates relative to the complete Pta
(Table 1). However, they displayed notably lower maxi-
mum activity (Table 1). Consequently, although the
binding sites for the substrates are conserved in the trun-
cated Ptas and are thus located in the PTA_PTB
domain, residues from the N-terminal domain, specifi-
cally from the P-loop NTPase domain (Fig. 2), are
needed for maximal catalytic activity, participating
either directly in the catalytic mechanism, or indirectly
in the conformation of the catalytic site.
The oligomeric state of the truncated Ptas was eval-
uated by gel filtration chromatography and native gel
electrophoresis (Fig. 3B). The results indicate that the
N-terminal domain is important for stabilization of
hexameric native Pta, as none of the truncated Ptas
was able to assemble as a hexamer (Fig. 3B). Specifi-
cally, the P-loop NTPase domain is important for
native hexameric stabilization, as Pta-F3 did not dis-
play a stable native conformation (Figs 2 and 3B).
Therefore, another possible explanation for the low
activity displayed by the truncated Ptas is that the for-
mation of a hexameric protein is critical for maximal
catalytic activity.
On the other hand, the activity of the truncated Ptas
was not regulated by any of the metabolites that were
able to modify the activity of the complete Pta
(Fig. 5A). Thus, the N-terminal domain, specifically
the P-loop NTPase domain (Fig. 1), is involved in the
metabolic regulation of E. coli Pta. Two explanations
may account for this result: the first is that the binding
site of the effectors is located at the N-terminal end of
E. coli Pta; and the second is that the native hexameric
structure of E. coli Pta is important for the metabolic
regulation.
Recently, analysis of several S. enterica Pta mutants
with single amino acid changes in the N-terminal
V. A. Campos-Bermudez et al. Escherichia coli phosphotransacetylase
FEBS Journal 277 (2010) 1957–1966 ª 2010 The Authors Journal compilation ª 2010 FEBS 1963
domain revealed specific amino acids involved in meta-
bolic regulation and stabilization of this Pta [5]. On
the other hand, crystal structure analysis of several
PtaIs, which lack the N-terminal end of PtaII, revealed
that these enzymes form homodimers [8]. Moreover,
the activity of these shorter Ptas is not modulated at
all by the metabolite effectors of larger Ptas [5]. These
results are in agreement with the characterization of
the truncated E. coli Pta performed in the present
work, indicating that the N-terminal end is involved in
metabolic regulation and the hexameric conformation.
The full characterization of more PtaIIs, as well as
three-dimensional structure analysis, would reveal spe-
cific N-terminal residues involved in the particular
properties of this enzyme and also the function of the
DRTGG domain. Taking into account the important
role of Ptas, the results obtained in the present work,
dissecting the different domains forming E. coli Pta,
will help in the future manipulation of these enzymes
by protein engineering in order to obtain Ptas better
suited for particular metabolic purposes.
Experimental procedures
Bacterial strains and growth media
E. coli DH5a was used as a general cloning host. E. coli
K-12 AG1, containing the plasmid pCA24N–Pta (ASKA
clone JW2294), was obtained from the ASKA library [15].
Strains were routinely cultured aerobically in LB broth with
appropriate antibiotics. Alternatively, the different E. coli
strains were grown on minimal medium M9 containing
15 mm acetate. For expression and purification, different
strains, depending on the expression vector, were used:
E. coli K-12 AG1 for pCA24N–Pta; E. coli BL21(DE3) for
pET28–F1 and pET28–F2; and E. coli M15 for pQE30–F3.
Construction of the E. coli acs pta deletion strain
The E. coli acs pta deletion strain (FB22) was constructed
using the pta single-gene deletion mutant JW2294, obtained
from the NIG Collection [16], as recipient strain. The acs
deletion in JW2294 was performed as described by
Datsenko and Wanner [17]. The cat
+
cassette in plasmid
pKD3 was amplified using primers with 60 bp of perfect
identity for the 5¢-end and 3¢-end of acs: delacs P1
(forward), 5¢-GAGAACAAAAGCATGAGCCAAATTCA
CAAACACACCA TTGTG TAGGC TGGAGCT GCTTC G-3¢;
and delacs P2 (reverse), 5¢-GGCAATTGTGGGTTAC
GATGGCATCGCGATAGCCTGCTTCATATGAATATC
CTCCTTA-3¢. The presence of the acs pta deletion was
confirmed by sequencing. The mutated acs pta E. coli
strain, called FB22, was transformed with plasmids
pCA24N–Pta or pQE–F3 for complementation analysis.
Induction of the introduced plasmids was performed by
the addition of 0.5 mm isopropyl thio-b-d-galactoside
(IPTG).
Gene amplification and cloning of the truncated
Ptas
Pta fragments were amplified by PCR from plasmid
pCA24N–Pta, hereafter called pPta, containing the entire
coding sequence of pta from E. coli. Different sets of primers
were used to amplify different E. coli Pta fragments from
the 3¢-end: Pta-F1 (F1 Fw_NcoI, 5¢-CCATGGTCC
GTTATCAGCTGACTGAACT-3¢; and F1 Rv_XhoI, 5¢-C
TCGAGCTGCTGCTGTGCAGACTGAAT-3¢); Pta-F2
(F2 Fw_NcoI, 5¢-CCATGGCTAACTACATCAACGCT
GAC-3¢; and F2 Rv_XhoI, 5¢-CTCGAGCTGCTGCTGTG
CAGACTGAAT-3¢); and Pta-F3 (F3 Fw_SacI, 5¢-CCGA
GCTCCGCGTTAAATCCGTCAC-3¢; and F3 Rv_HindIII,
5¢-GGGAAGCTTACTGCTGTGCAGACTGAA-3¢). Each
primer includes the restriction sites at the 5¢-end and 3¢-end
of the fragment, as indicated. The primers were designed in
order to generate three different truncated Ptas, containing
the last 326 amino acids in the case of Pta-F1, the last 352
amino acids in the case of Pta-F2, and the last 470 amino
acids in the case of Pta-F3 (Fig. 2).
PCR reactions performed in a final volume of 25 lL, and
using the following components: 0.2 mm each dNTP,
0.2 pmolÆlL
)1
each primer, 100 ng of DNA template, 5 lL
of 5· GoTaq DNA polymerase buffer, and 0.6 U of
GoTaq DNA polymerase (Promega, Madison, WI, USA).
The amplification protocol was as follows: one cycle of
2 min at 94 °C; 30 cycles of 1 min at 94 ° C, 30 s at 55 °C,
and 1 min 30 s at 72 °C; and one cycle of 5 min at 72 °C.
The amplified PCR fragments were cloned using pGEM
T-Easy (Promega), and digested with the corresponding
restriction enzymes. The resulting fragments were purified
from a 1% agarose gel using a Qiaex band purification kit
(Qiagen, Hilden, Germany), and cloned between the
corresponding restriction sites in pET28 (Novagen, EMD
Chemicals Inc., Gibbstown, NJ, USA) for Pta-F1 and Pta-
F2, or in pQE30 (Qiagen) for Pta-F3. The plasmids were
finally introduced into E. coli DH5a cells by electropora-
tion using a Bio-Rad apparatus, following the manufac-
turer’s recommendations.
Protein expression and purification
E. coli Pta and Pta-F1, Pta-F2 and Pta-F3 were produced
in E. coli K-12 AG1, E. coli BL21(DE3) or E. coli M15
containing the corresponding expression vectors (p–Pta,
pET28–F1, pET28–F2, and pQE30–F3). The systems used
yield high-level expression of the recombinant proteins
fused to a His-tag sequence at the N-terminal end codified
by the pET and pQE vectors used. All chromatographic
Escherichia coli phosphotransacetylase V. A. Campos-Bermudez et al.
1964 FEBS Journal 277 (2010) 1957–1966 ª 2010 The Authors Journal compilation ª 2010 FEBS
steps were performed on an A
¨
KTA purifier (GE Health-
care, Uppsala, Sweden).
Optimal induction conditions for the expression of each
protein were achieved using IPTG as an induction agent,
and different induction temperatures were tried. Optimal
overexpression of the fusion proteins was achieved by induc-
ing each E. coli culture at D
600
0.4–0.6 with 0.5 mm IPTG,
and growing for 4 h at 30 °C.
In a typical protein preparation, a 500 mL culture of
E. coli transformed with the corresponding expression vec-
tor (p–Pta, pET28–F1, pET28–F2, or pQE30–F3) was
grown in LB medium and induced as described above. The
bacteria were harvested by centrifugation at 5000 g for 15
min, and resuspended in 50 mm Tris ⁄ HCl (pH 8.0), 1 mm
phenylmethanesulfonyl fluoride, 0.01 mg ⁄ mL DNase, and
5mm MgCl
2
. Sonication was performed four times for
30 s, and this was followed by centrifugation for 10 min at
7000 g at 4 °C. The bacterial lysate was applied to a col-
umn of Ni
2+
–agarose (Qiagen). After washing with 50 mm
Tris ⁄ HCl (pH 8.0), 300 mm NaCl, and 20 mm imidazole,
the fusion protein was eluted with 50 mm Tris ⁄ HCl
(pH 8.0), 300 mm NaCl, and 250 mm imidazole. The fusion
protein was diafiltrated in a concentrator (Millipore, MA,
USA) and stored in buffer 50 mm Tris ⁄ HCl (pH 8.0).
Protein concentration
The protein concentration was determined by the method
of Sedmak and Grossberg [18], using BSA as standard.
Steady-state kinetics
Pta activity in the direction of acetyl-CoA synthesis
(forward reaction; Fig. 1B) was assayed at 30 °Cby
monitoring the thioester bond formation of acetyl-CoA at
233 nm (e
233 nm
= 5.55 mm
)1
Æcm
)1
). The assay mixture
contained 50 mm Tris ⁄ HCl (pH 8.0), 20 mm KCl, 10 mm
lithium acetyl phosphate, 0.2 mm lithium-CoA, and 2 mm
dithiothreitol.
The reverse Pta activity (Fig. 1B) was monitored by mea-
suring the phosphate-dependent CoA release from acetyl-
CoA with Ellman’s thiol reagent, 5¢,5-dithiobis(2-nitroben-
zoic acid), as the formation of thiophenolate anion at
412 nm (e
412 nm
= 13 600 m
)1
Æcm
)1
). The assay mixture
contained 50 mm Tris ⁄ HCl (pH 8.0), 20 mm KCl, 0.1 mm
5¢,5-dithiobis(2-nitrobenzoic acid), 0.1 mm acetyl-CoA, and
5mm KH
2
PO
4
.
Steady-state kinetic parameters were determined for both
the forward and the reverse reactions by measuring the
initial rates of acetyl-CoA or CoA formation, respectively.
The measurements were performed at least in triplicate.
Kinetic constants were determined by fitting the data of
initial rates to the Michaelis–Menten equation by nonlinear
regression [19]. When sigmoidal curves were observed,
initial rates were fitted to the Hill equation [19].
Different compounds were tested as potential inhibitors
or activators of Pta. Pta activity was measured in the
absence or presence of 0.8 mm each effector (NADH, ATP,
and PEP) or 15 mm pyruvate, while the substrate concen-
trations were maintained at the K
m
for each enzyme
(Table 1). The results are presented as the percentages of
activity in the presence of the effectors relative to the activ-
ity measured in the absence of the metabolites.
Gel electrophoresis
SDS ⁄ PAGE was performed in 10% (w ⁄ v) or 12% (w ⁄ v)
polyacrylamide gels, according to the method of Laemmli
[20]. Proteins were visualized with Coomassie Blue stain-
ing. Native PAGE was performed according to the
method of Davis [21], employing a 6% or 8% acrylamide
separating gel. Electrophoresis was performed at 150 V
and 10 °C. The gels were analyzed by Coomassie Blue
staining.
Gel filtration chromatography
The molecular masses of recombinant native Pta variants
were evaluated by gel filtration chromatography on an
FPLC system with a Biosep-Sec S3000 (Phenomenex, CA,
USA). The column was equilibrated with 100 mm phos-
phate buffer at pH 7.4, and calibrated using molecular
mass standards (Sigma-Aldrich, St Louis, MO, USA). The
sample and the standards were applied separately in a final
volume of 50 lL at a constant flow rate of 1 mLÆmin
)1
. All
chromatographic steps were performed on an A
¨
KTA
purifier (GE Healthcare).
CD
CD spectra of purified Pta variants were obtained with a
Jasco J-810 spectropolarimeter, using a 0.2 cm pathlength
cell and averaging five repetitive scans between 260 nm and
200 nm. Typically, 10 lm protein in 10 mm Tris (pH 8.0)
was used for each assay.
Acknowledgements
This work was funded by grants from CONICET and
Agencia Nacional de Promocio
´
n Cientı
´
fica y Tecnolo
´
g-
ica. M. F. Drincovich and C. S. Andreo are mem-
bers of the Researcher Career of CONICET, and
V. A. Campos-Bermu´ dez and F. P. Bologna are
fellows of the same institution.
References
1 Wolfe AJ (2005) The acetate switch. Microbiol Mol Biol
Rev 69, 12–50.
V. A. Campos-Bermudez et al. Escherichia coli phosphotransacetylase
FEBS Journal 277 (2010) 1957–1966 ª 2010 The Authors Journal compilation ª 2010 FEBS 1965
2 Kumari S, Beatty CM, Browing DF, Busby SJW, Simel
EJ, Hovel-Miner G & Wolfe AJ (2007) The intracellular
concentration of acetyl phosphate in Escherichia coli is
sufficient for direct phosphorylation of two-component
response regulators. J Bacteriol 189, 5574–5581.
3 El-Mansi M, Cozzone AJ, Shiloach J & Eikmanns BJ
(2006) Control of carbon flux through enzymes of cen-
tral and intermediary metabolism during growth of
Escherichia coli on acetate. Curr Opin Microbiol 9,
173–179.
4 Brinsmade SR & Escalante-Semerena JC (2004) The
eutD gene of Salmonella enterica encodes a protein with
phosphotransacetylase enzyme activity. J Bacteriol 186,
1890–1892.
5 Brinsmade SR & Escalante-Semerena JC (2007) In vivo
and in vitro analyses of single-amino acid variants of
the Salmonella enterica phosphotransacetylase enzyme
provide insights into the function of its N-terminal
domain. J Biol Chem 282, 12629–12640.
6 Iyer PP, Lawrence SH, Luther KB, Rajashankar KR,
Yennawar HP, Ferry JG & Schindelin H (2004) Crystal
structure of phosphotransacetylase from the methano-
genic archaeon Methanosarcina thermophila. Structure
12, 559–567.
7 Xu QS, Shin D-H, Pufan R, Yokota H, Kim R & Kim
S-H (2004) Crystal structure of a phosphotransacetylase
from Streptococcus pyogenes. Proteins 55, 479–481.
8 Xu QS, Jancarik J, Lou Y, Kusnetsova K, Yakunin
AF, Yokota H, Adams P, Kim R & Kim S-H (2005)
Crystal structure of a phosphotransacetylase from Bacil-
lus subtilis and its complex with acetyl phosphate.
J. Struct. Funct. Genomics 6, 269–279.
9 Suzuki T (1969) Phosphotransacetylase of Escherichia
coli B, activation by pyruvate and inhibition by NADH
and certain nucleotides. Biochim Biophys Acta 191, 559–
569.
10 Klein AH, Shulla A, Reimann SA, Keating DH &
Wolfe AJ (2007) The intracellular concentration of ace-
tyl phosphate in Escherichia coli is sufficient for direct
phosphorylation of two-component response regulators.
J Bacteriol 189, 5574–5581.
11 Marchler-Bauer A, Anderson JB, Chitsaz F, Derbyshire
MK, DeWeese-Scott C, Fong JH, Geer LY, Geer RC,
Gonzales NR, Gwadz M et al. (2009) CDD: specific
functional annotation with the Conserved Domain
Database. Nucleic Acids Res 37(D), 205–210.
12 Kakuda H, Hosono K, Shiroishi K & Ichihara S (1994)
Identification and characterization of the ackA (acetate
kinase A)–pta (phosphotransacetylase) operon and com-
plementation analysis of acetate utilization by an ackA–
pta deletion mutant of Escherichia coli. J Biochem 116,
916–922.
13 Chang DE, Shin S, Rhee JS & Pan JG (1999) Acetate
metabolim in a pta mutant of Escherichia coli W3110:
importance of maintaining acetyl coenzyme A flux for
growth and survival. J Bacteriol 181, 6656–6663.
14 Bennet BD, Kimball EH, Gao M, Osterhour R, Van
Dien SJ & Rabinowitz JD (2009) Absolute metabolite
concentrations and implied enzyme active site occu-
pancy in Escherichia coli. Nat Chem Biol 5, 593–599.
15 Kitagawa M, Ara T, Arifuzzaman M, Ioka-Nakamichi
T, Inamoto E, Toyonaga H & Mori H (2005) Complete
set of ORF clones of Escherichia coli ASKA library.
(A Complete Set of E. coli K-12 ORF Archive): unique
resources for biological research. DNA Res 12, 291–299.
16 Baba T, Ara T, Hasegawa M, Takai Y, Okumura Y,
Baba M, Datsenko KA, Tomita M, Wanner BL &
Mori H (2006) Construction of Escherichia coli K-12
in-frame, single-gene knockout mutants: the Keio
collection. Mol Syst Biol 2, 2006.
17 Datsenko KA & Wanner BL (2000) One-step inactiva-
tion of chromosomal genes in Escherichia coli K-12
using PCR products. Proc Natl Acad Sci U S A 97,
6640–6645.
18 Sedmak JJ & Grossberg SE (1977) A rapid, sensitive,
and versatile assay for protein using Coomassie brilliant
blue G250. Anal Biochem 79, 544–552.
19 Bologna F, Andreo CS & Drincovich MF (2007)
Escherichia coli malic enzymes: two isoforms with
substantial differences in kinetic properties, metabolic
regulation and structure. J Bacteriol 189, 5937–5946.
20 Laemmli UK (1970) Cleavage of structural proteins
during the assembly of the head of bacteriophage T
4
.
Nature 227, 680–685.
21 Davis BJ (1964) Disc electrophoresis. II. Method and
application to human serum proteins. Ann NY Acad Sci
121, 404–427.
Escherichia coli phosphotransacetylase V. A. Campos-Bermudez et al.
1966 FEBS Journal 277 (2010) 1957–1966 ª 2010 The Authors Journal compilation ª 2010 FEBS