Báo cáo khoa học: A new bright green-emitting fluorescent protein – engineered monomeric and dimeric forms pptx
Bạn đang xem bản rút gọn của tài liệu. Xem và tải ngay bản đầy đủ của tài liệu tại đây (435.76 KB, 12 trang )
A new bright green-emitting fluorescent protein –
engineered monomeric and dimeric forms
Robielyn P. Ilagan
1
, Elizabeth Rhoades
1
, David F. Gruber
2
, Hung-Teh Kao
3
, Vincent A. Pieribone
4
and Lynne Regan
1,5
1 Department of Molecular Biophysics and Biochemistry, Yale University, New Haven, CT, USA
2 Department of Natural Sciences, Baruch College and The Graduate Center, City University of New York, NY, USA
3 Department of Psychiatry and Human Behavior, Brown University, Providence, RI, USA
4 The John B. Pierce Laboratory, Yale University, New Haven, CT, USA
5 Department of Chemistry, Yale University, New Haven, CT, USA
Introduction
Fluorescent proteins (FPs) have become ubiquitous
tools in biological and biomedical research. Since the
cloning and exogenous expression of green fluorescent
protein (GFP) from the jellyfish Aequorea victoria,
researchers have sought new variants of this protein,
as well as of other FPs, with properties that are
well-suited for a particular application [1–3]. Extensive
mutagenesis has been performed on FPs to better
Keywords
detection marker; fluorescence correlation
spectroscopy; fluorescent protein;
oligomeric states; relative brightness
Correspondence
L. Regan Department of Molecular
Biophysics and Biochemistry, Yale
University, New Haven, CT 06520, USA
Fax: (203) 432 5175
Tel: (203) 432 9843
E-mail:
Note
The nucleotide sequence data are available
in the DDBJ ⁄ EMBL ⁄ GenBank databases
under the accession number FN597286 and
the protein sequence data are in Uni-
ProtKB ⁄ TrEMBL with the accession number
D1J6P8.
(Received 22 December 2009, revised 5
February 2010, accepted 15 February 2010)
doi:10.1111/j.1742-4658.2010.07618.x
Fluorescent proteins have become essential tools in molecular and biologi-
cal applications. Here, we present a novel fluorescent protein isolated from
warm water coral, Cyphastrea microphthalma. The protein, which we
named vivid Verde fluorescent protein (VFP), matures readily at 37 °C and
emits bright green light. Further characterizations revealed that VFP has a
tendency to form dimers. By creating a homology model of VFP, based on
the structure of the red fluorescent protein, DsRed, we were able to make
mutations that alter the protein’s oligomerization state. We present two
proteins, mVFP and mVFP1, that are both exclusively monomeric, and
one protein, dVFP, which is dimeric. We characterized the spectroscopic
properties of VFP and its variants in comparison with enhanced green fluo-
rescent protein (EGFP), a widely used variant of GFP. All the VFP vari-
ants are at least twice as bright as EGFP. Finally, we demonstrated the
effectiveness of the VFP variants in both in vitro and in vivo detection
applications.
Structured digital abstract
l
MINT-7709188: VFP (uniprotkb:D1J6P8) and VFP (uniprotkb:D1J6P8) bind (MI:0407)by
classical fluorescence spectroscopy (
MI:0017)
l
MINT-7709201: VFP (uniprotkb:D1J6P8) and VFP (uniprotkb:D1J6P8) bind (MI:0407)by
fluorescence correlation spectroscopy (
MI:0052)
l
MINT-7709216, MINT-7709247, MINT-7709237: VFP (uniprotkb:D1J6P8) and VFP (uni-
protkb:
D1J6P8) bind (MI:0407)bymolecular sieving (MI:0071)
Abbreviations
dVFP, dimeric VFP; EC, extinction coefficient; EGFP, enhanced GFP; FCS, fluorescence correlation spectroscopy; FMRP, fragile X mental
retardation protein; FP, fluorescent protein; GFP, green fluorescent protein; GST, glutathione S-transferase; hpf, hours post-fertilization;
mVFP, monomeric VFP; QY, quantum yield; t
D,
diffusion time; t
½,
half time; T-Mod, TPR-based recognition module; TPR, tetratricopeptide
repeats; VFP, vivid Verde fluorescent protein.
FEBS Journal 277 (2010) 1967–1978 ª 2010 The Authors Journal compilation ª 2010 FEBS 1967
tailor their properties to the needs of biologists
[1,2,4,5]. Of special interest are FPs with new excita-
tion and emission wavelengths, FPs with increased
brightness, FPs that are monomeric and FPs that
mature rapidly at 37 °C.
GFP is a 238-amino-acid protein, whose chromo-
phore is formed by the post-translational re-arrange-
ment of an internal Ser-Tyr-Gly sequence to a
4-(p-hydroxybenzylidene)-imidazolidine-5-one structure
[6]. The crystal structure of GFP revealed that the
chromophore is buried in the center of a b-barrel
structure [7,8]. Amino acid mutagenesis and protein
engineering were carried out on GFP to improve its
spectral characteristics, oligomeric state and chromo-
phore-maturation at 37 °C [6,9–12]. A broad range of
GFP variants with fluorescence emission ranging from
blue to yellow regions of the visible spectrum was cre-
ated [1,2]. Enhanced green fluorescent protein (EGFP)
is a widely used variant of GFP, which has mutations
at two positions: F64L and S65T [9,10]. EGFP is
brighter and matures more rapidly at 37 °C than wild-
type GFP [1,9]. Protein engineering of EGFP has
yielded several green variants with improved character-
istics, such as Emerald FP. This Emerald FP has
improved photostability and brightness compared with
EGFP [11]. Another GFP variant is the ‘superfolder’
GFP that is designed to fold faster at 37 °C. This ‘su-
perfolder’ GFP is also brighter and more acid resistant
than either EGFP or Emerald FP [12]. A weak ten-
dency of GFP and its variants to dimerize was com-
pletely eliminated using point mutations at F223K,
L221K, or A206K [13,14].
Another FP, DsRed, from the sea anemone Disco-
soma striata, is also of great interest to researchers
because its intrinsic fluorescence is red rather than green
[15,16]. The chromophore of DsRed is closely related to
that of GFP, being formed by the re-arrangement of an
internal Gln-Tyr-Gly tripeptide [15]. The extended
conjugation in the chromophore causes the red-shift
observed in DsRed and other red FPs [4]. DsRed forms
a strong tetramer both in solution and in crystal and its
chromophore maturation is very slow [17–19]. As a
result of these limitations, DsRed has been a target of
protein engineering and mutations to improve its
chromophore maturation rate and to reduce oligomeri-
zation [20–22]. A directed evolution approach was
performed on DsRed to make a monomeric version,
mRFP1, which has a total of 33 amino acid mutations
[21]. In addition to DsRed, there are many other FPs,
ranging from blue-, cyan-, green- and yellow- to
red-emitting, which have different spectral properties,
brightness, and stabilities, that have been isolated from
reef corals and other Anthozoa species [1,2]. Most of
these FPs display a higher degree of oligomerization,
which is detrimental for cellular labeling [17,18,23]. To
overcome FP oligomerization, mutations must be made
at the monomer–monomer interface. The exact nature
of such interfaces varies depending on the nature and
origin of the FP [2].
Many FPs, either isolated from natural sources or
engineered from GFP or DsRed, are known and avail-
able [1,2]. However, only a few of the current FPs are
widely used in various cell-imaging applications and
most of them have certain limitations [1,2,24].
A continuing effort must be made to improve the
spectral characteristics and stabilities of the FPs, or
alternatively, to search for new FPs with optimal
properties, for maximum utility in cellular imaging.
The natural habitat of A. victoria is the cool waters
off the northwest coast of Washington State. One
might expect organisms that inhabit warmer waters to
have evolved FPs that mature more rapidly at higher
temperatures. Here we describe the characterization
and modification of a novel FP that was isolated from
Cyphastrea microphthalma, a scleractinian coral found
in the warmer waters of the Australian Great Barrier
Reef (Fig. 1). Several new fluorescent organisms were
identified by diving at night with UV illumination, and
the FPs were cloned from these organisms and
expressed in Escherichia coli [25,26]. We found that the
vast majority of proteins characterized indeed mature
robustly and rapidly at 37 °C. Here we report the
properties of one of the novel green-emitting FPs,
vivid Verde FP (VFP), which exhibits useful proper-
ties. VFP is very bright, matures rapidly at 37 °C and
we have engineered exclusively monomeric or dimeric
variants of it. These properties are particularly well
suited to a variety of molecular and biological applica-
tions.
Results
Sequence of the new FP and relation to other
known FPs
A new FP, VFP, was isolated and cloned from the
C. microphthalma coral, collected in 1.2 m of water off
Lizard Island on the Australian Great Barrier Reef
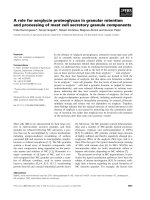
[25,26]. The alignment of the amino acid sequences of
VFP, DsRed and EGFP is shown in Fig. 1A. The
amino acid residues that form the chromophore are in
bold and underlined. The chromophore residues at
positions 66, 67 and 68, following the amino acid resi-
dues numbering in DsRed, are QYG in VFP, QYG in
DsRed and TYG in EGFP. VFP shows greater
sequence identity overall to DsRed than to EGFP,
Monomeric and dimeric forms of green-emitting FP R. P. Ilagan et al.
1968 FEBS Journal 277 (2010) 1967–1978 ª 2010 The Authors Journal compilation ª 2010 FEBS
with 53% sequence identity to DsRed and only 20%
sequence identity to EGFP. Sequence alignment dem-
onstrates the conservation of many positions in VFP,
which are presumably structurally and ⁄ or functionally
important. Arg96 and Glu222 of GFP, which were
proposed to participate in chromophore maturation
[27], are also conserved in DsRed and VFP. The VFP
coding sequence was deposited in the EMBL nucleo-
tide sequence database under the accession number
FN597286. Using the Swiss Institute of Bioinformatics
BLAST Network Service, the VFP sequence was found
to have the highest sequence identity, of 83%, to a
GFP isolated from coral Montastraea cavernosa [28].
Sequence alignment also showed that there are several
cyan, green, or red FPs and chromoproteins from
coral in which the chromophore is formed by amino
acids QYG, the same as in VFP.
VFP exhibits maximum excitation and emission
peaks at 491 and 503 nm, respectively, as shown in
Fig. 1C. These spectral properties are more similar to
those of EGFP rather than to those of DsRed, despite
the fact that the sequence of VFP is more closely
related to DsRed than to EGFP. The chromophore
formation in GFP involves cyclization, oxidation and
dehydration, and in DsRed and other coral FPs, an
additional oxidation step occurs [4,29–31]. Previously,
DsRed chromophore maturation has been shown to
proceed through a green-emitting anionic GFP-like
intermediate, which has excitation and emission peaks
at 475 and 499 nm, respectively [17]. However, it has
also been proposed that the red-emitting chromophore
of DsRed and of related chromoproteins is produced
from a blue-emitting neutral form of a GFP-like
chromophore, the green anionic species being the
dead-end product [32]. The GFP-like chromophore
of VFP is stable and further conversion into the
red-emitting chromophore was not observed.
Two tryptophan residues at positions 93 and 143 of
DsRed, located in the immediate vicinity of the chro-
mophore, are conserved in VFP (corresponding to
positions 89 and 139). Thus, the absorption spectrum
of VFP showed a peak at 280 nm (Fig. 1C) as a result
of the presence of these Trp residues, and excitation at
280 nm gave an emission peak at 503 nm.
Oligomeric state of VFP
For many applications, it is essential that the FP used
to ‘tag’ another protein is monomeric [24]. If an FP is
not monomeric, then its oligomerization may influence
the behavior of the tagged protein, thus perturbing the
system under study. We used gel-filtration chromatog-
raphy to assess the oligomeric state of VFP. To allow
direct comparison with a known protein, we also puri-
fied EGFP, which is monomeric at concentrations
of < 1 mgÆmL
)1
[33]. A gel-filtration chromatogram
of VFP showed a major peak and a shoulder, indi-
cating a mixture of dimer and monomer species
A
BC
Fig. 1. (A) Amino acid sequence alignment
of VFP with DsRed and EGFP. The chromo-
phore-forming amino acid residues are
shown in bold and are underlined. The
amino acid residues (N158 and T160) of
VFP, where the mutations were made, are
indicated by a bold letter. The conserved
Arg and Glu (corresponding to Arg96 and
Glu222 of GFP) residues are shown on a
gray background. (B) A scleractinian coral,
Cyphastrea microphthalma, collected in
1.2 m of water off Lizard Island on the Aus-
tralian Great Barrier Reef. (C) Overlay of the
absorption (abs), fluorescence-excitation (ex)
and fluorescence-emission (em) spectra of
VFP. The samples were excited at 450 nm
and the emission spectra were measured
from 465 to 650 nm. The fluorescence exci-
tation spectra were obtained from 250 to
515 nm by monitoring the emission at
530 nm. The spectra were normalized at the
maximum peak.
R. P. Ilagan et al. Monomeric and dimeric forms of green-emitting FP
FEBS Journal 277 (2010) 1967–1978 ª 2010 The Authors Journal compilation ª 2010 FEBS 1969
(Fig. S1). We therefore sought to design mutations
to shift the equilibrium to a fully monomeric state.
With this goal in mind, we aligned the sequences of
DsRed and VFP and created a homology model for
VFP.
It is known that DsRed forms a strong tetramer,
both in solution and in the crystal structure [17,18].
An examination of the crystal structure of the DsRed
tetramer shows that the monomers are arranged as a
dimer of dimers, with AB (or CD) and AC (or BD)
interfaces, as illustrated in Fig. 2A. The AB interface
is dominated by hydrophobic interactions, whereas the
AC interface is comprised predominantly of salt
bridges and hydrogen bonds [19]. Thus, the formation
of VFP dimer could be caused by the interaction of
either AB or AC. Several point mutations (such as
I125R, H162K, A164R and I180T) on the surface of
DsRed are documented in the literature, which convert
the DsRed tight tetramer into a monomer [1,21]. We
compared the residues at these positions in VFP with
those in DsRed to identify mutations in VFP that
might shift the monomer–dimer equilibrium towards
monomer. The corresponding amino acid residues in
VFP are H121, N158, T160 and T176, allowing us to
identify possible mutations in VFP as H121R, N158K
and T160R. We focused on examining the N158K and
T160R mutations. The locations of these mutations in
the AC interface are indicated in Fig. 2B. The ratio-
nale for the N158K mutation is that it replaces a polar
uncharged Asn with a positively charged Lys and this
mutation should disrupt the AC dimerization interface.
In DsRed, His162 of the A monomer is involved in
a stacking interaction with His162 of the adjacent
C monomer, whilst simultaneously making an electro-
static interaction with Glu176 of the C monomer,
forming what appears to be an important part of the
AC interface [19]. In VFP, residue 158 (corresponding
to residue 162 in DsRed) is Asn and residue 172
(corresponding to residue 176 in DsRed) is Asp. By
contrast, in T160R mutations, the polar uncharged
Thr was replaced with the positively charged Arg. In
DsRed, position 164 is occupied by Ala, which creates
small hydrophobic patches in the AC interface and, by
replacing it with Arg, the AC interaction is disrupted.
Also, previous studies showed that substituting hydro-
philic or charged amino acids for hydrophobic and
neutral residues of the FP tetrameric interfaces could
generate the monomer form of the protein [13,21].
The mutations were made individually, with the
intention of combining any of them if an individual
mutation was insufficient to cause the VFP to mono-
merize. We expressed and purified each VFP mutant
(N158K or T160R) and assessed its oligomeric states
using gel-filtration chromatography. We found that
either the N158K mutation or the T160R mutation is
sufficient to convert VFP into an exclusively mono-
meric species (Fig. S1). We named these monomeric
N158K and T160R mutants as mVFP1 and mVFP,
respectively. In the course of the cloning, we also
serendipitously isolated the T160A mutant of VFP.
Gel-filtration chromatography revealed that the T160A
mutant is fully dimeric, with no evidence of the mono-
mer–dimer equilibrium that we observed for VFP
(Fig. S1). Presumably, the introduction of small hydro-
phobic patches on the surface of the protein promotes
strong dimer formation. We named this dimeric vari-
ant of VFP as dVFP.
Spectral properties of VFP and its variants
We proceeded with further characterizations of all four
proteins, namely VFP and its variants mVFP1
(N158K), mVFP (T160R) and dVFP (T160A). The
excitation and emission spectra for all four proteins
were identical, with an excitation maximum of 491 nm,
an emission maximum of 503 nm and a Stokes shift of
12 nm (Table 1, Fig. 1C and Fig. S2). The measured
extinction coefficient (EC) of VFP was 83 700 M
)1
Æ
cm
)1
, which was higher than that of EGFP
A
B
Fig. 2. (A) A cartoon illustration of DsRed tetramer arranged as a
dimer of dimers with AB (=CD) and AC (=BD) interfaces. (B)
Structure of two of the four subunits of the tetrameric DsRed
consisting of the AC polar interface. The positions of the amino
acid residues 158 and 160 (corresponding to amino acid residues
162 and 164, respectively, in DsRed) where mutations were
made, are indicated by lines. The chromophore at the center of
the b-barrel structure is shown in black sticks. Protein Data Bank
(PDB) code: 1GGX. [55]
Monomeric and dimeric forms of green-emitting FP R. P. Ilagan et al.
1970 FEBS Journal 277 (2010) 1967–1978 ª 2010 The Authors Journal compilation ª 2010 FEBS
(54 400 m
)1
Æcm
)1
). The ECs calculated for mVFP1 and
mVFP were 80 400 and 85 000 m
)1
Æcm
)1
, respectively.
However, a higher EC value of 107, 000 m
)1
Æcm
)1
was
observed for dVFP. The increase in the EC value of
dVFP compared with VFP might be caused by its tight
dimer formation. Table 1 summarizes these data,
alongside the measured results for EGFP and Venus
for comparison. Venus is a variant of yellow FP with
a fast maturation and high brightness [34]. The results
obtained for EGFP and Venus are consistent with the
values reported in the literature [34,35]. For compari-
son, Table 1 includes a list of selected green-emitting
FPs that have spectral properties relevant to VFP vari-
ants. We reported the fluorescence excitation and emis-
sion wavelength peaks, molar EC, quantum yield
(QY), oligomeric states, relative brightness and photo-
stability of these selected FPs.
The EC and QY for each FP were determined and
the product of these two parameters (EC x QY) pro-
vides the relative brightness (Table 1). We used the
reported EGFP QY of 0.60 [35] as a reference for cal-
culating the QY of VFP and its variants. The relative
QY values of VFP and its variants ranged from 0.84
to 1.0, which was higher than those of both EGFP
and Venus. Thus, as a result of having a high EC and
a high QY, VFP and its variants produced high rela-
tive brightness. It is evident that the dimeric form,
VFP or dVFP variant, is brighter than the monomeric
form of VFP. Either the mVFP1 or the mVFP variant
is at least twice as bright as EGFP, and the dVFP var-
iant is much brighter than Venus. To our knowledge,
there is no monomeric green-emitting FP available to
date that is at least twofold brighter than EGFP,
except for the photoswitchable Dronpa FP (Table 1).
Table 1. Spectral properties of VFP and its variants in comparison to EGFP, Venus and selected FPs. The excitation (Ex) and emission (Em)
wavelengths, the molar extinction coefficients (EC), the quantum yield (QY), the oligomeric states, the relative brightness and the photosta-
bility are listed. The relative brightness was calculated from the product of EC and QY. Photostability was calculated based on 100% EGFP
measured at the same time. ND, not determined.
Protein
Ex
(nm)
Em
(nm)
EC · 10
)3
(M
)1
Æcm
)1
)QY
Oligomeric
states
Relative
brightness
Photostability
(% EGFP) Reference
VFP 491 503 83.7 1.0 Weak dimer 84 33 This work
mVFP 491 503 85.0 0.86 Monomer 73 16 This work
mVFP1 491 503 80.4 0.84 Monomer 68 11 This work
dVFP 491 503 107.0 1.0 Dimer 107 39 This work
EGFP 488 509 54.4 0.60 Monomer 33 100 This work
Venus 515 527 93.3 0.75 Monomer 70 27 This work
GFPs – Anthozoa
AzamiGreen 492 505 55.0 0.74 Monomer 41 ND 44
mWasabi 493 509 70.0 0.80 Monomer 56 53 45
ZsGreen 493 505 43.0 0.91 Tetramer 39 ND 15
copGFP 482 502 70.0 0.60 Tetramer 42 ND 46
cmFP512 503 512 58.8 0.66 Tetramer 39 92 47
aacuGFP2 502 513 93.9 0.71 ND 67 ND 48
aeurGFP 504 515 145.7 0.67 ND 98 ND 48
eechGFP1 497 510 124.2 0.75 ND 93 ND 48
efasGFP 496 507 125.8 0.80 ND 101 ND 48
gfasGFP 492 506 102.5 0.73 ND 75 ND 48
plamGFP 502 514 98.6 0.96 ND 95 ND 48
sarcGFP 483 500 76.7 0.96 ND 74 ND 48
GFP – Aequorea derivatives
Superfolder 485 510 83.3 0.65 Monomer 54 90 12
mEmerald 487 509 57.5 0.68 Monomer 39 58 11
Cyan FPs – Anthozoa
mTFP1 462 492 64 0.85 Monomer 54 63 49
Photoconvertable FPs
Kaede 508 518 98.8 0.88 Tetramer 87 26 50
dEos (G) 506 516 84 0.66 Dimer 55 24 51
mEos2 (G) 506 519 56 0.84 Monomer 47 21 52
Photoswitchable FPs
Dronpa 503 517 95 0.85 Monomer 81 ND 53
mKikGR 505 515 49 0.69 Monomer 34 7 54
cerFP505 494 505 54 0.55 Tetramer 30 54 47
R. P. Ilagan et al. Monomeric and dimeric forms of green-emitting FP
FEBS Journal 277 (2010) 1967–1978 ª 2010 The Authors Journal compilation ª 2010 FEBS 1971
We also investigated the pH dependence of VFP
and its variants’ fluorescence emission at 503 nm
upon excitation at 491 nm, as shown in Fig. S3. VFP
and its variants were found to have pH stability
profiles similar to those of EGFP between pH 6 and
pH 10.
Fluorescence correlation spectroscopy
measurements of size and photostability
We used fluorescence correlation spectroscopy (FCS)
to investigate the photobleaching, molecular brightness
and oligomeric states of the FPs in more detail. The
traces of FCS autocorrelation curves obtained for
EGFP and mVFP are shown in Fig. 3A. No shifts in
the autocorrelation curves were observed for EGFP as
a function of laser power intensity. However, the diffu-
sion curves shifted to the left for VFP and its variants
as the laser power intensity was increased (Fig. 3A and
Fig. S4). This shift in autocorrelation curves to the
left, noted by shorter apparent diffusion times (t
D
), is
indicative of photobleaching.
The autocorrelation curves for each sample were fit-
ted using single-diffusion or two-diffusion component
equation. The best-fit curve was assessed based on the
residual of the fitting. A detailed analysis of the other
photophysical dynamics (e.g. triplet blinking), occur-
ring at the submillisecond timescale, is beyond the
scope of this paper and will be presented elsewhere.
The t
D
value and the average fluorescence intensity
were determined from the fitting of the autocorrelation
curves taken at 0.25 lW laser power, as reported in
Table 2. At this low laser power intensity, the effects
of other photophysical processes were minimized. The
relative molecular brightness of the FPs was calculated
by dividing the average fluorescence intensity by the
number of molecules within the illuminated region.
The results obtained support our earlier findings that
VFP and its variants are nearly twofold brighter than
EGFP, based on the counts per molecule (kHz ⁄ mole-
cule) in Table 2 and Table S1.
At 0.25 lW laser power intensity, the measured rela-
tive t
D
values of either mVFP1 or mVFP were compa-
rable to that of the EGFP, indicating that both
variants are monomeric. Furthermore, VFP and dVFP
have t
D
values greater than that of EGFP, indicating
higher oligomeric states (Table 2). These results sup-
ported our findings on the oligomeric states of the
VFP variants using gel-filtration chromatography, as
described earlier.
Based on our FCS results, we noticed that photoble-
aching occurs in VFP and its variants. This observation
prompted us to investigate, in greater detail, the rate of
photobleaching of VFP and its variants in comparison
to that of EGFP and Venus using wide-field microscopy,
as described in the Materials and methods. Figure 3B
depicts the relative photobleaching curves of EGFP,
Venus, mVFP and dVFP from 0 to 500 s. We deter-
mined the relative half time (t
½
) to photobleach the
VFP samples, EGFP and Venus (Fig. S5). Based on the
t
½
values, we calculated the percentage of photostability
of the VFP and its variants relative to 100% EGFP. We
also included, in Table 1, the reported photostability of
A
B
Fig. 3. (A) Representative FCS autocorrelation curves of EGFP and
mVFP taken at increasing laser power intensities from 0.25 to
5 lW. A shift in the autocorrelation curve to the left, to apparently
shorter t
D
values, as a function of laser power intensity, was
observed for VFP and its variants. The autocorrelation curves are
normalized to the number of molecules obtained from the fitting
autocorrelation function [G(t)]. (B) Photobleaching curves for the
EGFP, Venus, mVFP and dVFP under mercury arc lamp illumination
using a wide-field microscope. The relative photostability of VFP
and its variants are reported in Table 1.
Table 2. Summary of FCS analysis. The autocorrelation curves of
each FP obtained at 0.25 lW laser power intensity were fitted
using a single-diffusion component equation. The brightness,
expressed as counts per molecule, was calculated by dividing the
intensity by the number of molecules.
FPs
Diffusion time
(ms)
Intensity
(Hz) 1 · 10
4
Counts per
molecule
(kHzÆmolecule
)1
)
EGFP 0.486 ± 0.012 2.49 ± 0.05 0.262 ± 0.005
Venus 0.543 ± 0.019 3.25 ± 0.02 0.251 ± 0.002
VFP 0.646 ± 0.004 4.07 ± 0.14 1.76 ± 0.06
mVFP1 0.460 ± 0.007 3.40 ± 0.19 0.485 ± 0.028
mVFP 0.472 ± 0.007 3.70 ± 0.14 0.476 ± 0.018
dVFP 0.763 ± 0.004 3.00 ± 0.11 1.55 ± 0.06
Monomeric and dimeric forms of green-emitting FP R. P. Ilagan et al.
1972 FEBS Journal 277 (2010) 1967–1978 ª 2010 The Authors Journal compilation ª 2010 FEBS
some FPs relative to 100% EGFP measured at the same
time. The photostability data of other green-emitting
FPs have not yet been reported or determined. The
mVFP1 and mVFP variants, which have 11% and 16%
photostability, respectively, were less photostable than
VFP and dVFP. However, the dVFP variant has 39%
photostability, and thus exhibits greater photostability
than Venus and other photoconvertable or photoswitch-
able FPs. For other imaging applications [24], the differ-
ence in photostability has no relevance. Even with this
photostability, our VFP variants can be useful for
numerous in vitro and in vivo detection applications.
Application of VFP variants as detection markers
It has been shown previously in our laboratory that a
protein recognition domain, tetratricopeptide repeats
(TPR), fused to EGFP can be used to detect the pro-
tein–peptide interaction in a single step, completely
eliminating the use of primary and secondary antibodies
in western blot analysis [36]. The TPR-based recognition
module (T-Mod) was demonstrated to bind specifically
to MEEVF peptide fused to glutathione S-transferase
(GST) [36]. The fusion of FP to T-Mod can completely
eliminate the need for any antibodies or developing pro-
cedures, which makes western blotting faster, simpler
and less costly. We adapted this experiment to show the
usefulness of mVFP and dVFP brightness in compari-
son to EGFP. We expressed and purified the T-Mod
fused to EGFP, mVFP or dVFP. Following the
SDS ⁄ PAGE of E. coli-expressing GST–MEEVF lysate,
gels were transferred to poly(vinylidene difluoride)
membrane and processed as for western blotting. After
blocking the membrane, we incubated the blots sepa-
rately with different T-Mod–FPs for 1 h at room tem-
perature. The membrane was then visualized using a UV
transilluminator at 302 nm, as shown in Fig. 4A. The
visible band indicated by an arrow is the GST–MEEVF
protein detected by the binding of T-Mod–FP. The
bands from T-Mod–mVFP or T-Mod–dVFP were at
least two-fold brighter than that of the EGFP. Addi-
tional bands were visible in the membrane incubated
with T-Mod–dVFP as a result of the intense brightness
of the dVFP protein. This result illustrates the benefit of
having high brightness, in terms of sensitivity, in a prac-
tical detection application.
Application of mVFP as an in vivo marker
To demonstrate that our VFP can be used for in vivo
labeling, we chose the monomeric form, mVFP, and
fused it to the KH domains of fragile X mental retar-
dation protein (FMRP). We injected mRNA encoding
the KH–mVFP fusion protein into zebrafish embryos
at the one-cell stage. Live embryos at 6-h post-fertiliza-
tion (hpf) and at 14 hpf (10-somite) stages were
mounted on glass slides and visualized using a fluores-
cence microscope, as shown in Fig. 4B. The fluores-
cence signals from zebrafish embryos with KH–mVFP
were more intense than those of the control, which
showed a faint cellular autofluorescence.
Discussion
We have described a detailed characterization of a new
FP from the warm water coral, C. microphthalma,
collected off Lizard Island on the Australian Great
Barrier Reef. The protein, which we named VFP,
A
B
Fig. 4. (A) Comparison of the T-Mod fused to EGFP, mVFP, or dVFP
as a replacement for antibodies in western blot analysis. A duplicate
SDS-polyacrylamide gel used in western blotting was stained with
Coomassie Brilliant Blue. Lanes 1, precision plus protein standard
(BioRad); lane 2, lysate; lane 3, lysate supplemented with 1 mgÆmL
)1
of purified GST–MEEVF; lane 4, purified GST–MEEVF. The arrow
indicates the GST–MEEVF protein band. (B) Microinjection of
KH–mVFP fusion mRNA into zebrafish embryos. The expression
of KH–mVFP protein was monitored in the embryos at 6 and 14 hpf
using fluorescence microscopy. Zebrafish embryos without RNA
injections were used as a control.
R. P. Ilagan et al. Monomeric and dimeric forms of green-emitting FP
FEBS Journal 277 (2010) 1967–1978 ª 2010 The Authors Journal compilation ª 2010 FEBS 1973
matures rapidly at 37 °C and emits bright green fluo-
rescence. VFP, as isolated, showed a propensity to
form fairly weakly associating dimers. By creating a
homology model of VFP, we were able to create sur-
face mutations that convert VFP into either an exclu-
sively monomeric species (N158K or T160R) – which
we named mVFP1 and mVFP, respectively, or into an
exclusively dimeric species (T160A) – which we named
dVFP. This rational approach to creating monomeric
variants can be used as a guide for re-engineering
other coral FPs that have higher oligomeric forms.
These novel proteins have features that will be useful
for a variety of applications. The mVFP1 and mVFP
variants are both monomeric and fluoresce at least twice
as brightly as EGFP. The dimeric dVFP is even brighter,
being at least 1.5 times as bright as Venus. For applica-
tions where oligomerization is not critical, the use of the
dVFP variant would be advantageous because of its
high brightness. When a bright, monomeric protein is
desired, mVFP1 or mVFP would be the proteins of
choice. Based on the list of reported FPs (either wild-
type or engineered) (Table 1), none is both monomeric
and at least two-fold brighter than EGFP, except for
photoswitchable Dronpa. The data we presented should
allow investigators to choose which VFP variant is the
most appropriate for their specific research application.
With regards to photostability, VFP and its variants
photobleached at a faster rate than EGFP. The vast
majority of reports in the literature describing green-
emitting FPs isolated from corals do not include
photostability measurements, which makes it difficult
to assess the level of photostability of VFP variants in
relation to other coral FPs [2,24]. However, for many
imaging applications, this photobleaching property will
not be influential [24,34]. In conclusion, the monomeric
and the dimeric forms of VFP represent viable alterna-
tives to the widely used EGFP and Venus.
Materials and methods
Plasmid constructions and mutations
The plasmids encoding VFP, EGFP and Venus with poly-
histidine tags were constructed as previously described
[26,37]. The VFP coding sequence was deposited in the
EMBL nucleotide sequence database under the accession
number FN597286 and in the UniProtKBT ⁄ TrEMBL pro-
tein sequence database under the accession number D1J6P8.
Site-directed mutagenesis (QuikChange Site-Directed Muta-
genesis Kit; Stratagene, Cedar Creek, TX, USA) was used
to introduce the N158K and T160R mutations into VFP.
Mutations were verified by DNA sequencing (W. M. Keck,
Foundation Facility, Yale University, CT, USA).
Sequence alignment and homology modeling
Sequence alignment of VFP with EGFP and DsRed was
performed using clustalw
2 (EMBL-EBI). Homology
modeling was carried out using swiss-model [38].
Recombinant protein expression
The proteins were expressed in E. coli DH10b cells grown in
Luria–Bertani (LB) liquid medium for 24 h at 37 ° C. The cells
were harvested by centrifugation and the pellets were resus-
pended in lysis buffer (50 mm Tris ⁄ HCl, pH 7.4, 300 mm
NaCl) supplemented with a tablet of complete EDTA-free
protease inhibitor cocktail (Roche) and 5 mm b-mercapto-
ethanol. The lysate was sonicated, then centrifuged. The
supernatant solution was loaded into Ni-nitrilotriacetic acid
agarose (Qiagen, Valencia, CA, USA), and the pure protein
was eluted with 50 mm Tris ⁄ HCl, pH 7.4, 150 mm NaCl,
200 mm imidazole. The fractions containing the protein were
pooled and dialyzed into 50 mm Tris ⁄ HCl, pH 7.4, 150 mm
NaCl. The purity of the samples was determined by
SDS ⁄ PAGE. The proteins were concentrated by centriprep
YM-10 with 10 000 MWCO (Amicon, Billerica, MA, USA)
to about 100–200 mm then stored in aliquots at )20 °C. The
buffer used in all spectroscopic analyses was 50 mm
Tris ⁄ HCl, pH 7.4, 150 mm NaCl, unless otherwise noted.
Analytical gel-filtration chromatography
The molecular sizes of the purified FPs were analyzed using a
Superdex S200 10 ⁄ 30 gel-filtration column (Amersham Phar-
macia) by FPLC at room temperature. A 100 mL sample of
< 0.01 mgÆmL
)1
of each FP was injected into the column at
a flow rate of 0.5 mLÆmin
)1
and the absorbance was moni-
tored at 280 nm. The oligomeric states of the VFP and its
variants were determined based on the EGFP elution time
and protein standards (Bio-Rad, Hercules, CA, USA).
Absorption spectroscopy
The absorbance spectra of the FPs were recorded on a
Hewlett Packard 845X UV-visible Chemstation. The ECs
of the FPs were calculated based on the absorbance of the
native and acid-denatured or alkali-denatured proteins. The
ECs of the GFP-like chromophores used in the calculation
are 44 000 m
)1
Æcm
)1
at 447 nm in 1 m NaOH [33] and
28 500 m
)1
Æcm
)1
at 382 nm in 1 m HCl [39]. For yellow FP,
Venus, the EC of the chromophore was back-calculated
using 22 000 m
)1
Æcm
)1
at 280 nm in 10 mm Tris ⁄ HCl.
Fluorescence spectroscopy
Fluorescence excitation and emission measurements were
performed using a PTI Quantamaster C-61 two-channel
Monomeric and dimeric forms of green-emitting FP R. P. Ilagan et al.
1974 FEBS Journal 277 (2010) 1967–1978 ª 2010 The Authors Journal compilation ª 2010 FEBS
fluorescence spectrophotometer. The samples were excited
at 450 nm and emission spectra were measured from 465 to
650 nm with a 2 nm slit-width. Fluorescence excitation
spectra were obtained from 250 to 515 nm by monitoring
the emission at 530 nm with a 2 nm slit-width. The QY
values of the VFP and its variants were determined relative
to EGFP (QY = 0.60 [35]). The pH dependence of VFP
and its variants’ fluorescence emission at 503 nm were
measured upon excitation at 491 nm at room temperature.
pH titrations were performed using a series of 100–200 mm
citrate-phosphate buffer (pH 2.0–11.0) containing 150 mm
NaCl.
FCS
FCS measurements were made on a laboratory built instru-
ment, based around an inverted microscope with a 488 nm
DPSS laser for excitation, as previously described [40,41].
All measurements were carried out on FP samples of
approximately 100 nm using varying laser power intensities
from 5 to 0.25 lW measured on the table before entering
the microscope. The output of the detection channels was
autocorrelated in a digital correlator (Correlator.com).
Control measurements were performed using Alexa 488
solutions to ensure the proper alignment of the confocal
optics and the absence of artifacts in the FCS. The autocor-
relation curves were fitted using a single- or two-component
equation, as previously described [41]. The parameters
extracted from the fittings were relative t
D
number of mole-
cules, and fluorescence intensities.
Photobleaching
Photobleaching measurements of purified FP samples were
performed using a inverted wide-field microscope equipped
with a 100 W mercury arc lamp similar to those described
in the literature [42]. The FP samples were mixed with min-
eral oil, and about 5 lL of the mixture was sandwiched
between a glass slide and a cover slip. A neutral density
filter was used initially for sample alignment, which was
removed when the actual measurements were being
made. The FP samples were imaged using a 50 ms exposure
time and a frame rate of one image per second. The
measurement was taken in a 600 s time span under
constant illumination.
Western blot assays
The T-Mod–FP and GST–MEEVF constructs were pre-
pared as previously described [36]. The FP fused to
T-Mod was EGFP, mVFP, or dVFP. Each construct was
transformed into E. coli BL21(DE3) cells and the protein
was purified following the protocol previously described
[36]. The GST–MEEVF lysate was obtained from 6-mL
overnight culture cell pellet by adding 1 mL of B-Per
(Pierce, Rockford, IL, USA) and shaking, with occasional
vortexing, for 10 min. The lysate was supplemented either
with or without 1 mgÆmL
)1
of purified GST–MEEVF pro-
tein. The samples mixed with a reducing loading buffer
were loaded precisely into 4–12% gradient SDS-polyacryl-
amide gels together with an equivalent amount of purified
GST–MEEVF protein. The gels were run at room temper-
ature for 1 h at a voltage of 120 V using NuPAGE buffer
(Invitrogen, Carlsbad, CA, USA). One gel was stained
with Coomassie Brilliant Blue while the other gels were
transferred onto a poly(vinylidene difluoride) membrane
(Millipore, Billerica, MA, USA). Membrane transfer was
carried out in a cold room for 3 h at a constant current
of 380 mAmp. The transfer buffer used contained 24 mm
Tris-base, 192 mm glycine, 10% methanol and 0.01%
SDS. The membranes were blocked in 5% non-fat milk in
TBS-T (20 mm Tris-base, pH 8.0, 150 mm NaCl, 0.1%
Tween-20) overnight at 4 °C with shaking. The mem-
branes were then incubated individually with each 5 lm
T-Mod-FP fusion construct in TBS-T containing 0.1%
nonfat milk for 1 h at room temperature with shaking.
The membranes were washed three times with TBS-T, for
10 min each wash, visualized using a UV transilluminator
at 302 nm and the images captured using a digital camera
(Kodak, Rochester, NY, USA).
mRNA microinjection assay
To assemble the KH–mVFP fusion construct, the deleted
KH domain of human FMRP – hFMRP(KH1-KH2D)–
was fused with the N-terminus of mVFP and cloned into
the mammalian PCS2 + vector. The construct was
sequenced (W. M. Keck Foundation Facility, Yale Univer-
sity) and named KH–mVFP for simplicity. The in vitro
synthesis of large amounts of capped RNA was carried
out using the mMESSAGE mMACHINE kit (Applied
Biosystems ⁄ Ambion, Austin, TX, USA) following the
manufacturer’s protocols. The capped transcription reaction
was prepared at room temperature and then incubated at
37 °C for 2 h. TURBODNase (Ambion) was added to the
reaction and incubated at 37 °C for another 15 min to
remove the template DNA. The RNA was purified using
the RNeasy Mini kit (Qiagen). The concentration of the
RNA was determined using a UV-vis spectrometer and
then the RNA was stored at )80 °C until use.
The RNA microinjections were performed at the one-cell
stage using standard protocols [43]. The injection
solution consisted of 200 ngÆlL
)1
of KH–mVFP and 0.15%
Phenol Red in Danieau’s solution. Live embryos at 6
and 14 hpf stages were manually dechorionated and
mounted in methylcellulose. In parallel, we also mounted
embryos without RNA injections as a control. Fluorescent
images were acquired on a Zeiss Axioskop microscope
using a 20 · objective and an FITC filter. Color adjustment
of the fluorescent images was made equally for both
R. P. Ilagan et al. Monomeric and dimeric forms of green-emitting FP
FEBS Journal 277 (2010) 1967–1978 ª 2010 The Authors Journal compilation ª 2010 FEBS 1975
KH–mVFP-injected and control zebrafish using ImageJ
software.
Acknowledgements
We thank Dr. Joseph Wolenski of the MCDB Imaging
Facilities at Yale University for helping us with photo-
bleaching experiments; and Dr. Scott Holley and Jamie
Schwendinger-Schreck of the MCDB at Yale Univer-
sity for performing the RNA microinjection assay in
zebrafish. We also thank the members of the Regan
laboratory for comments and suggestions on the man-
uscript. This work is funded by HFSP (RGP44 ⁄ 2207
to L.R.), Leslie H. Warner Postdoctoral Fellowship (to
R.P.I.), NIH (GM070348 to H-T.K. and Earthwatch
Institute (Grant: ‘Luminous Life in the Great Barrier
Reef’ to V.A.P.)
References
1 Shaner NC, Patterson GH & Davidson MW (2007)
Advances in fluorescent protein technology. J Cell Sci
120, 4247–4260.
2 Day RN & Davidson MW (2009) The fluorescent pro-
tein palette: tools for cellular imaging. Chem Soc Rev
38, 2887–2921.
3 Lippincott-Schwartz J & Patterson GH (2009) Photoac-
tivatable fluorescent proteins for diffraction-limited and
super-resolution imaging. Trends Cell Biol 19, 555–565.
4 Nienhaus GU & Wiedenmann J (2009) Structure,
dynamics and optical properties of fluorescent proteins:
perspectives for marker development. Chemphyschem
10, 1369–1379.
5 Patterson GH & Lippincott-Schwartz J (2002) A
photoactivatable GFP for selective photolabeling of
proteins and cells. Science 297, 1873–1877.
6 Heim R, Prasher DC & Tsien RY (1994) Wavelength
mutations and posttranslational autoxidation of green
fluorescent protein. Proc Natl Acad Sci USA 91, 12501–
12504.
7 Ormo M, Cubitt AB, Kallio K, Gross LA, Tsien RY &
Remington SJ (1996) Crystal structure of the Aequorea
victoria green fluorescent protein. Science 273, 1392–
1395.
8 Yang F, Moss LG & Phillips GN Jr (1996) The molecu-
lar structure of green fluorescent protein. Nat Biotechnol
14, 1246–1251.
9 Heim R & Tsien RY (1996) Engineering green fluores-
cent protein for improved brightness, longer wave-
lengths and fluorescence resonance energy transfer. Curr
Biol 6, 178–182.
10 Brejc K, Sixma TK, Kitts PA, Kain SR, Tsien RY,
Ormo M & Remington SJ (1997) Structural basis for
dual excitation and photoisomerization of the Aequorea
victoria green fluorescent protein. Proc Natl Acad Sci
USA 94, 2306–2311.
11 Cubitt AB, Woollenweber LA & Heim R (1999) Under-
standing structure-function relationships in the Aequo-
rea victoria green fluorescent protein. Methods Cell Biol
58, 19–30.
12 Pedelacq JD, Cabantous S, Tran T, Terwilliger TC &
Waldo GS (2006) Engineering and characterization of a
superfolder green fluorescent protein. Nat Biotechnol 24,
79–88.
13 Zacharias DA & Tsien RY (2006) Molecular biology
and mutation of green fluorescent protein. In Green
Fluorescent Protein: Properties, Applications, and Proto-
cols (Chalfie M & Kain SR eds), pp. 83–120. John
Wiley & Sons, Inc., New Jersey.
14 Zhang J, Campbell RE, Ting AY & Tsien RY (2002)
Creating new fluorescent probes for cell biology. Nat
Rev Mol Cell Biol 3, 906–918.
15 Matz MV, Fradkov AF, Labas YA, Savitsky AP,
Zaraisky AG, Markelov ML & Lukyanov SA (1999)
Fluorescent proteins from nonbioluminescent Anthozoa
species. Nat Biotechnol 17, 969–973.
16 Davidson MW & Campbell RE (2009) Engineered fluo-
rescent proteins: innovations and applications. Nat
Methods 6, 713–717.
17 Baird GS, Zacharias DA & Tsien RY (2000) Biochemis-
try, mutagenesis, and oligomerization of DsRed, a red
fluorescent protein from coral. Proc Natl Acad Sci USA
97, 11984–11989.
18 Gross LA, Baird GS, Hoffman RC, Baldridge KK &
Tsien RY (2000) The structure of the chromophore
within DsRed, a red fluorescent protein from coral.
Proc Natl Acad Sci USA 97, 11990–11995.
19 Yarbrough D, Wachter RM, Kallio K, Matz MV &
Remington SJ (2001) Refined crystal structure of
DsRed, a red fluorescent protein from coral, at 2.0-A
resolution. Proc Natl Acad Sci USA 98, 462–467.
20 Bevis BJ & Glick BS (2002) Rapidly maturing variants
of the Discosoma red fluorescent protein (DsRed). Nat
Biotechnol 20, 83–87.
21 Campbell RE, Tour O, Palmer AE, Steinbach PA,
Baird GS, Zacharias DA & Tsien RY (2002) A mono-
meric red fluorescent protein. Proc Natl Acad Sci USA
99, 7877–7882.
22 Strongin DE, Bevis B, Khuong N, Downing ME,
Strack RL, Sundaram K, Glick BS & Keenan RJ
(2007) Structural rearrangements near the chromophore
influence the maturation speed and brightness of DsRed
variants. Protein Eng Des Sel 20, 525–534.
23 Verkhusha VV & Lukyanov KA (2004) The molecular
properties and applications of Anthozoa fluorescent
proteins and chromoproteins. Nat Biotechnol 22, 289–
296.
24 Shaner NC, Steinbach PA & Tsien RY (2005) A guide to
choosing fluorescent proteins. Nat Methods 2, 905–909.
Monomeric and dimeric forms of green-emitting FP R. P. Ilagan et al.
1976 FEBS Journal 277 (2010) 1967–1978 ª 2010 The Authors Journal compilation ª 2010 FEBS
25 Gruber DF, Desalle R, Lienau EK, Tchernov D,
Pieribone VA & Kao HT (2009) Novel internal regions
of fluorescent proteins undergo divergent evolutionary
patterns. Mol Biol Evol 26, 2841–2848.
26 Gruber DF, Kao HT, Janoschka S, Tsai J & Pieribone
VA (2008) Patterns of fluorescent protein expression in
Scleractinian corals. Biol Bull 215, 143–154.
27 Wood TI, Barondeau DP, Hitomi C, Kassmann CJ,
Tainer JA & Getzoff ED (2005) Defining the role of
arginine 96 in green fluorescent protein fluorophore bio-
synthesis. Biochemistry 44, 16211–16220.
28 Kelmanson IV & Matz MV (2003) Molecular basis and
evolutionary origins of color diversity in great star coral
Montastraea cavernosa (Scleractinia: Faviida). Mol Biol
Evol 20, 1125–1133.
29 Craggs TD (2009) Green fluorescent protein: structure,
folding and chromophore maturation. Chem Soc Rev
38, 2865–2875.
30 Pakhomov AA & Martynov VI (2008) GFP family:
structural insights into spectral tuning. Chem Biol 15,
755–764.
31 Remington SJ (2006) Fluorescent proteins: maturation,
photochemistry and photophysics. Curr Opin Struct Biol
16, 714–721.
32 Verkhusha VV, Chudakov DM, Gurskaya NG,
Lukyanov S & Lukyanov KA (2004) Common pathway
for the red chromophore formation in fluorescent
proteins and chromoproteins. Chem Biol 11, 845–854.
33 Ward WW (2006) Biochemical and physical properties
of green fluorescent protein. In Green Fluorescent Pro-
tein: Properties, Applications, and Protocols (Chalfie M
& Kain SR eds), pp. 39–65. John Wiley & Sons, Inc.,
New Jersey.
34 Nagai T, Ibata K, Park ES, Kubota M, Mikoshiba K
& Miyawaki A (2002) A variant of yellow fluorescent
protein with fast and efficient maturation for cell-bio-
logical applications. Nat Biotechnol 20, 87–90.
35 Patterson GH, Knobel SM, Sharif WD, Kain SR & Pis-
ton DW (1997) Use of the green fluorescent protein and
its mutants in quantitative fluorescence microscopy.
Biophys J 73, 2782–2790.
36 Jackrel ME, Valverde R & Regan L (2009) Redesign of
a protein-peptide interaction: characterization and
applications. Protein Sci 18, 762–774.
37 Kao HT, Sturgis S, DeSalle R, Tsai J, Davis D, Gruber
DF & Pieribone VA (2007) Dynamic regulation of fluo-
rescent proteins from a single species of coral. Mar Bio-
technol (NY) 9, 733–746.
38 Bordoli L, Kiefer F, Arnold K, Benkert P, Battey J &
Schwede T (2009) Protein structure homology modeling
using SWISS-MODEL workspace. Nat Protoc 4, 1–13.
39 Niwa H, Inouye S, Hirano T, Matsuno T, Kojima S,
Kubota M, Ohashi M & Tsuji FI (1996) Chemical nat-
ure of the light emitter of the Aequorea green fluores-
cent protein. Proc Natl Acad Sci USA 93, 13617–13622.
40 Trexler A & Rhoades E (2009) a-Synuclein binds large
unilamellar vesicles as an extended helix. Biochemistry
48, 2304–2306.
41 Chen H, Rhoades E, Butler JS, Loh SN & Webb WW
(2007) Dynamics of equilibrium structural fluctuations
of apomyoglobin measured by fluorescence correlation
spectroscopy. Proc Natl Acad Sci USA 104, 10459–
10464.
42 Subach OM, Gundorov IS, Yoshimura M, Subach FV,
Zhang J, Gruenwald D, Souslova EA, Chudakov DM
& Verkhusha VV (2008) Conversion of red fluorescent
protein into a bright blue probe. Chem Biol 15, 1116–
1124.
43 Gilmour DT, Jessen JR & Lin S (2002) Manipulating
gene expression in the zebrafish. In Zebrafish: a Practi-
cal Approach (Nusslein-Volhard C & Dahm R eds), pp.
121–143. Oxford University Press, New York.
44 Karasawa S, Araki T, Yamamoto-Hino M & Miyawaki
A (2003) A green-emitting fluorescent protein from
Galaxeidae coral and its monomeric version for use in
fluorescent labeling. J Biol Chem 278, 34167–34171.
45 Ai HW, Olenych SG, Wong P, Davidson MW &
Campbell RE (2008) Hue-shifted monomeric variants of
Clavularia cyan fluorescent protein: identification of the
molecular determinants of color and applications in
fluorescence imaging. BMC Biol 6, 13.
46 Shagin DA, Barsova EV, Yanushevich YG, Fradkov
AF, Lukyanov KA, Labas YA, Semenova TN, Ugalde
JA, Meyers A, Nunez JM et al. (2004) GFP-like pro-
teins as ubiquitous metazoan superfamily: evolution of
functional features and structural complexity. Mol Biol
Evol 21, 841–850.
47 Vogt A, D’Angelo C, Oswald F, Denzel A, Mazel CH,
Matz MV, Ivanchenko S, Nienhaus GU & Wiedenmann
J (2008) A green fluorescent protein with photoswitchable
emission from the deep sea. PLoS ONE 3, e3766.
48 Alieva NO, Konzen KA, Field SF, Meleshkevitch EA,
Hunt ME, Beltran-Ramirez V, Miller DJ, Wiedenmann
J, Salih A & Matz MV (2008) Diversity and evolution
of coral fluorescent proteins. PLoS ONE 3 , e2680.
49 Ai HW, Henderson JN, Remington SJ & Campbell RE
(2006) Directed evolution of a monomeric, bright and
photostable version of Clavularia cyan fluorescent pro-
tein: structural characterization and applications in fluo-
rescence imaging. Biochem J 400, 531–540.
50 Ando R, Hama H, Yamamoto-Hino M, Mizuno H &
Miyawaki A (2002) An optical marker based on the
UV-induced green-to-red photoconversion of a fluores-
cent protein. Proc Natl Acad Sci USA 99, 12651–
12656.
51 Wiedenmann J, Ivanchenko S, Oswald F, Schmitt F,
Rocker C, Salih A, Spindler KD & Nienhaus GU
(2004) EosFP, a fluorescent marker protein with UV-
inducible green-to-red fluorescence conversion. Proc
Natl Acad Sci USA 101, 15905–15910.
R. P. Ilagan et al. Monomeric and dimeric forms of green-emitting FP
FEBS Journal 277 (2010) 1967–1978 ª 2010 The Authors Journal compilation ª 2010 FEBS 1977
52 McKinney SA, Murphy CS, Hazelwood KL, Davidson
MW & Looger LL (2009) A bright and photostable
photoconvertible fluorescent protein. Nat Methods 6,
131–133.
53 Ando R, Mizuno H & Miyawaki A (2004) Regulated
fast nucleocytoplasmic shuttling observed by reversible
protein highlighting. Science 306, 1370–1373.
54 Habuchi S, Tsutsui H, Kochaniak AB, Miyawaki A &
van Oijen AM (2008) mKikGR, a monomeric photo-
switchable fluorescent protein. PLoS ONE 3, e3944.
55 Wall MA, Socolich M & Ranganathan R (2000) The
structural basis for red fluorescence in the tetrameric
GFP homolog DsRed. Nat Struct Biol 7, 1133–1138.
Supporting information
The following supplementary material is available:
This section includes the complete set of character-
ization of VFP and its variants in comparison to
EGFP and Venus:
Fig. S1. Gel filtration chromatography of VFP, mVFP,
dVFP, and EGFP using Superdex S200 10 ⁄ 30 gel fil-
tration column in FPLC at room temperature.
Fig. S2. Absorption, fluorescence excitation and emis-
sion spectra of VFP and its variants.
Fig. S3. pH dependence of the fluorescence of VFP
and its variants in comparison with EGFP and
Venus.
Fig. S4. Representative FCS autocorrelation curves of
Venus, VFP, mVFP1 and dVFP taken at increasing
laser power intensities from 0.25 to 5 mW.
Fig. S5. Photobleaching curves for EGFP, Venus,
VFP and its variants under mercury arc lamp illumi-
nation.
Table S1. Summary of fluorescence correlation spec-
troscopy (FCS) analysis.
This supplementary material can be found in the
online version of this article.
Please note: As a service to our authors and readers,
this journal provides supporting information supplied
by the authors. Such materials are peer-reviewed and
may be re-organized for online delivery, but are not
copy-edited or typeset. Technical support issues arising
from supporting information (other than missing files)
should be addressed to the authors.
Monomeric and dimeric forms of green-emitting FP R. P. Ilagan et al.
1978 FEBS Journal 277 (2010) 1967–1978 ª 2010 The Authors Journal compilation ª 2010 FEBS