Tài liệu Báo cáo khoa học: "A New Dataset and Method for Automatically Grading ESOL Texts" pdf
Bạn đang xem bản rút gọn của tài liệu. Xem và tải ngay bản đầy đủ của tài liệu tại đây (152.98 KB, 10 trang )
Proceedings of the 49th Annual Meeting of the Association for Computational Linguistics, pages 180–189,
Portland, Oregon, June 19-24, 2011.
c
2011 Association for Computational Linguistics
A New Dataset and Method for Automatically Grading ESOL Texts
Helen Yannakoudakis
Computer Laboratory
University of Cambridge
United Kingdom
Ted Briscoe
Computer Laboratory
University of Cambridge
United Kingdom
Ben Medlock
iLexIR Ltd
Cambridge
United Kingdom
Abstract
We demonstrate how supervised discrimina-
tive machine learning techniques can be used
to automate the assessment of ‘English as a
Second or Other Language’ (ESOL) examina-
tion scripts. In particular, we use rank prefer-
ence learning to explicitly model the grade re-
lationships between scripts. A number of dif-
ferent features are extracted and ablation tests
are used to investigate their contribution to
overall performance. A comparison between
regression and rank preference models further
supports our method. Experimental results on
the first publically available dataset show that
our system can achieve levels of performance
close to the upper bound for the task, as de-
fined by the agreement between human exam-
iners on the same corpus. Finally, using a set
of ‘outlier’ texts, we test the validity of our
model and identify cases where the model’s
scores diverge from that of a human examiner.
1 Introduction
The task of automated assessment of free text fo-
cuses on automatically analysing and assessing the
quality of writing competence. Automated assess-
ment systems exploit textual features in order to
measure the overall quality and assign a score to a
text. The earliest systems used superficial features,
such as word and sentence length, as proxies for
understanding the text. More recent systems have
used more sophisticated automated text processing
techniques to measure grammaticality, textual co-
herence, prespecified errors, and so forth.
Deployment of automated assessment systems
gives a number of advantages, such as the reduced
workload in marking texts, especially when applied
to large-scale assessments. Additionally, automated
systems guarantee the application of the same mark-
ing criteria, thus reducing inconsistency, which may
arise when more than one human examiner is em-
ployed. Often, implementations include feedback
with respect to the writers’ writing abilities, thus fa-
cilitating self-assessment and self-tutoring.
Implicitly or explicitly, previous work has mostly
treated automated assessment as a supervised text
classification task, where training texts are labelled
with a grade and unlabelled test texts are fitted to the
same grade point scale via a regression step applied
to the classifier output (see Section 6 for more de-
tails). Different techniques have been used, includ-
ing cosine similarity of vectors representing text in
various ways (Attali and Burstein, 2006), often com-
bined with dimensionality reduction techniques such
as Latent Semantic Analysis (LSA) (Landauer et al.,
2003), generative machine learning models (Rudner
and Liang, 2002), domain-specific feature extraction
(Attali and Burstein, 2006), and/or modified syntac-
tic parsers (Lonsdale and Strong-Krause, 2003).
A recent review identifies twelve different auto-
mated free-text scoring systems (Williamson, 2009).
Examples include e-Rater (Attali and Burstein,
2006), Intelligent Essay Assessor (IEA) (Landauer
et al., 2003), IntelliMetric (Elliot, 2003; Rudner et
al., 2006) and Project Essay Grade (PEG) (Page,
2003). Several of these are now deployed in high-
stakes assessment of examination scripts. Although
there are many published analyses of the perfor-
180
mance of individual systems, as yet there is no pub-
lically available shared dataset for training and test-
ing such systems and comparing their performance.
As it is likely that the deployment of such systems
will increase, standardised and independent evalua-
tion methods are important. We make such a dataset
of ESOL examination scripts available
1
(see Section
2 for more details), describe our novel approach to
the task, and provide results for our system on this
dataset.
We address automated assessment as a supervised
discriminative machine learning problem and par-
ticularly as a rank preference problem (Joachims,
2002). Our reasons are twofold:
Discriminative classification techniques often
outperform non-discriminative ones in the context of
text classification (Joachims, 1998). Additionally,
rank preference techniques (Joachims, 2002) allow
us to explicitly learn an optimal ranking model of
text quality. Learning a ranking directly, rather than
fitting a classifier score to a grade point scale after
training, is both a more generic approach to the task
and one which exploits the labelling information in
the training data efficiently and directly.
Techniques such as LSA (Landauer and Foltz,
1998) measure, in addition to writing competence,
the semantic relevance of a text written in response
to a given prompt. However, although our corpus
of manually-marked texts was produced by learners
of English in response to prompts eliciting free-text
answers, the marking criteria are primarily based on
the accurate use of a range of different linguistic
constructions. For this reason, we believe that an
approach which directly measures linguistic compe-
tence will be better suited to ESOL text assessment,
and will have the additional advantage that it may
not require retraining for new prompts or tasks.
As far as we know, this is the first application
of a rank preference model to automated assess-
ment (hereafter AA). In this paper, we report exper-
iments on rank preference Support Vector Machines
(SVMs) trained on a relatively small amount of data,
on identification of appropriate feature types derived
automatically from generic text processing tools, on
comparison with a regression SVM model, and on
the robustness of the best model to ‘outlier’ texts.
1
/>We report a consistent, comparable and replicable
set of results based entirely on the new dataset and
on public-domain tools and data, whilst also exper-
imentally motivating some novel feature types for
the AA task, thus extending the work described in
(Briscoe et al., 2010).
In the following sections we describe in more de-
tail the dataset used for training and testing, the sys-
tem developed, the evaluation methodology, as well
as ablation experiments aimed at studying the con-
tribution of different feature types to the AA task.
We show experimentally that discriminative models
with appropriate feature types can achieve perfor-
mance close to the upper bound, as defined by the
agreement between human examiners on the same
test corpus.
2 Cambridge Learner Corpus
The Cambridge Learner Corpus
2
(CLC), developed
as a collaborative project between Cambridge Uni-
versity Press and Cambridge Assessment, is a large
collection of texts produced by English language
learners from around the world, sitting Cambridge
Assessment’s English as a Second or Other Lan-
guage (ESOL) examinations
3
.
For the purpose of this work, we extracted scripts
produced by learners taking the First Certificate in
English (FCE) exam, which assesses English at an
upper-intermediate level. The scripts, which are
anonymised, are annotated using XML and linked
to meta-data about the question prompts, the candi-
date’s grades, native language and age. The FCE
writing component consists of two tasks asking
learners to write either a letter, a report, an article,
a composition or a short story, between 200 and 400
words. Answers to each of these tasks are anno-
tated with marks (in the range 1–40), which have
been fitted to a RASCH model (Fischer and Mole-
naar, 1995) to correct for inter-examiner inconsis-
tency and comparability. In addition, an overall
mark is assigned to both tasks, which is the one we
use in our experiments.
Each script has been also manually tagged with
information about the linguistic errors committed,
2
/>item3646603/Cambridge-International-Corpus-Cambridge-
Learner-Corpus/?site locale=en GB
3
/>181
using a taxonomy of approximately 80 error types
(Nicholls, 2003). The following is an example error-
coded sentence:
In the morning, you are <NS type = “TV”>
waken|woken</NS> up by a singing puppy.
In this sentence, TV denotes an incorrect tense of
verb error, where waken can be corrected to woken.
Our data consists of 1141 scripts from the year
2000 for training written by 1141 distinct learners,
and 97 scripts from the year 2001 for testing written
by 97 distinct learners. The learners’ ages follow
a bimodal distribution with peaks at approximately
16–20 and 26–30 years of age.
The prompts eliciting the free text are provided
with the dataset. However, in this paper we make
no use of prompt information and do not make any
attempt to check that the text answer is appropriate
to the prompt. Our focus is on developing an accu-
rate AA system for ESOL text that does not require
prompt-specific or topic-specific training. There is
no overlap between the prompts used in 2000 and in
2001. A typical prompt taken from the 2000 training
dataset is shown below:
Your teacher has asked you to write a story for the
school’s English language magazine. The story must
begin with the following words: “Unfortunately, Pat
wasn’t very good at keeping secrets”.
3 Approach
We treat automated assessment of ESOL text (see
Section 2) as a rank preference learning problem
(see Section 1). In the experiments reported here
we use Support Vector Machines (SVMs) (Vap-
nik, 1995) through the SVM
light
package (Joachims,
1999). Using the dataset described in Section 2, a
number of linguistic features are automatically ex-
tracted and their contribution to overall performance
is investigated.
3.1 Rank preference model
SVMs have been extensively used for learning clas-
sification, regression and ranking functions. In its
basic form, a binary SVM classifier learns a linear
threshold function that discriminates data points of
two categories. By using a different loss function,
the ε-insensitive loss function (Smola, 1996), SVMs
can also perform regression. SVMs in regression
mode estimate a function that outputs a real number
based on the training data. In both cases, the model
generalises by computing a hyperplane that has the
largest (soft-)margin.
In rank preference SVMs, the goal is to learn a
ranking function which outputs a score for each data
point, from which a global ordering of the data is
constructed. This procedure requires a set R consist-
ing of training samples x
n
and their target rankings
r
n
:
R = {(x
1
, r
1
), (x
2
, r
2
), , (x
n
, r
n
)} (1)
such that x
i
R
x
j
when r
i
< r
j
, where
1 ≤ i, j ≤ n and i = j.
A rank preference model is not trained directly on
this set of data objects and their labels; rather a set of
pair-wise difference vectors is created. The goal of
a linear ranking model is to compute a weight vec-
tor w that maximises the number of correctly ranked
pairs:
∀(x
i
R
x
j
) : w(x
i
− x
j
) > 0 (2)
This is equivalent to solving the following opti-
misation problem:
Minimise:
1
2
w
2
+ C
ξ
ij
(3)
Subject to the constraints:
∀(x
i
R
x
j
) : w(x
i
− x
j
) ≥ 1 − ξ
ij
(4)
ξ
ij
≥ 0 (5)
The factor C allows a trade-off between the train-
ing error and the margin size, while ξ
ij
are non-
negative slack variables that measure the degree of
misclassification.
The optimisation problem is equivalent to that for
the classification model on pair-wise difference vec-
tors. In this case, generalisation is achieved by max-
imising the differences between closely-ranked data
pairs.
The principal advantage of applying rank prefer-
ence learning to the AA task is that we explicitly
182
model the grade relationships between scripts and
do not need to apply a further regression step to fit
the classifier output to the scoring scheme. The re-
sults reported in this paper are obtained by learning
a linear classification function.
3.2 Feature set
We parsed the training and test data (see Section
2) using the Robust Accurate Statistical Parsing
(RASP) system with the standard tokenisation and
sentence boundary detection modules (Briscoe et al.,
2006) in order to broaden the space of candidate fea-
tures suitable for the task. The features used in our
experiments are mainly motivated by the fact that
lexical and grammatical features should be highly
discriminative for the AA task. Our full feature set
is as follows:
i. Lexical ngrams
(a) Word unigrams
(b) Word bigrams
ii. Part-of-speech (PoS) ngrams
(a) PoS unigrams
(b) PoS bigrams
(c) PoS trigrams
iii. Features representing syntax
(a) Phrase structure (PS) rules
(b) Grammatical relation (GR) distance mea-
sures
iv. Other features
(a) Script length
(b) Error-rate
Word unigrams and bigrams are lower-cased and
used in their inflected forms. PoS unigrams, bigrams
and trigrams are extracted using the RASP tagger,
which uses the CLAWS
4
tagset. The most proba-
ble posterior tag per word is used to construct PoS
ngram features, but we use the RASP parser’s op-
tion to analyse words assigned multiple tags when
the posterior probability of the highest ranked tag is
less than 0.9, and the next n tags have probability
greater than
1
50
of it.
4
/>Based on the most likely parse for each identified
sentence, we extract the rule names from the phrase
structure (PS) tree. RASP’s rule names are semi-
automatically generated and encode detailed infor-
mation about the grammatical constructions found
(e.g. V1/modal bse/+-, ‘a VP consisting of a modal
auxiliary head followed by an (optional) adverbial
phrase, followed by a VP headed by a verb with base
inflection’). Moreover, rule names explicitly repre-
sent information about peripheral or rare construc-
tions (e.g. S/pp-ap s-r, ‘a S with preposed PP with
adjectival complement, e.g. for better or worse, he
left’), as well as about fragmentary and likely extra-
grammatical sequences (e.g. T/txt-frag, ‘a text unit
consisting of 2 or more subanalyses that cannot be
combined using any rule in the grammar’). There-
fore, we believe that many (longer-distance) gram-
matical constructions and errors found in texts can
be (implicitly) captured by this feature type.
In developing our AA system, a number of dif-
ferent grammatical complexity measures were ex-
tracted from parses, and their impact on the accuracy
of the system was explored. For the experiments re-
ported here, we use complexity measures represent-
ing the sum of the longest distance in word tokens
between a head and dependent in a grammatical re-
lation (GR) from the RASP GR output, calculated
for each GR graph from the top 10 parses per sen-
tence. In particular, we extract the mean and median
values of these distances per sentence and use the
maximum values per script. Intuitively, this feature
captures information about the grammatical sophis-
tication of the writer. However, it may also be con-
founded in cases where sentence boundaries are not
identified through, for example, poor punctuation.
Although the CLC contains information about the
linguistic errors committed (see Section 2), we try
to extract an error-rate in a way that doesn’t require
manually tagged data. However, we also use an
error-rate calculated from the CLC error tags to ob-
tain an upper bound for the performance of an auto-
mated error estimator (true CLC error-rate).
In order to estimate the error-rate, we build a tri-
gram language model (LM) using ukWaC (ukWaC
LM) (Ferraresi et al., 2008), a large corpus of En-
glish containing more than 2 billion tokens. Next,
we extend our language model with trigrams ex-
tracted from a subset of the texts contained in the
183
Features
Pearson’s Spearman’s
correlation correlation
word ngrams 0.601 0.598
+PoS ngrams 0.682 0.687
+script length 0.692 0.689
+PS rules 0.707 0.708
+complexity 0.714 0.712
Error-rate features
+ukWaC LM 0.735 0.758
+CLC LM 0.741 0.773
+true CLC error-rate 0.751 0.789
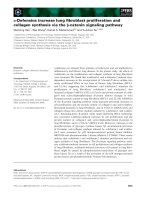
Table 1: Correlation between the CLC scores and the AA
system predicted values.
CLC (CLC LM). As the CLC contains texts pro-
duced by second language learners, we only extract
frequently occurring trigrams from highly ranked
scripts to avoid introducing erroneous ones to our
language model. A word trigram in test data is
counted as an error if it is not found in the language
model. We compute presence/absence efficiently us-
ing a Bloom filter encoding of the language models
(Bloom, 1970).
Feature instances of types i and ii are weighted
using the tf*idf scheme and normalised by the L2
norm. Feature type iii is weighted using frequency
counts, while iii and iv are scaled so that their final
value has approximately the same order of magni-
tude as i and ii.
The script length is based on the number of words
and is mainly added to balance the effect the length
of a script has on other features. Finally, features
whose overall frequency is lower than four are dis-
carded from the model.
4 Evaluation
In order to evaluate our AA system, we use two cor-
relation measures, Pearson’s product-moment cor-
relation coefficient and Spearman’s rank correla-
tion coefficient (hereafter Pearson’s and Spearman’s
correlation respectively). Pearson’s correlation de-
termines the degree to which two linearly depen-
dent variables are related. As Pearson’s correlation
is sensitive to the distribution of data and, due to
outliers, its value can be misleading, we also re-
port Spearman’s correlation. The latter is a non-
parametric robust measure of association which is
Ablated Pearson’s Spearman’s
feature correlation correlation
none 0.741 0.773
word ngrams 0.713 0.762
PoS ngrams 0.724 0.737
script length 0.734 0.772
PS rules 0.712 0.731
complexity 0.738 0.760
ukWaC+CLC LM 0.714 0.712
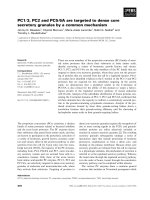
Table 2: Ablation tests showing the correlation between
the CLC and the AA system.
sensitive only to the ordinal arrangement of values.
As our data contains some tied values, we calculate
Spearman’s correlation by using Pearson’s correla-
tion on the ranks.
Table 1 presents the Pearson’s and Spearman’s
correlation between the CLC scores and the AA sys-
tem predicted values, when incrementally adding
to the model the feature types described in Sec-
tion 3.2. Each feature type improves the model’s
performance. Extending our language model with
frequent trigrams extracted from the CLC improves
Pearson’s and Spearman’s correlation by 0.006 and
0.015 respectively. The addition of the error-rate ob-
tained from the manually annotated CLC error tags
on top of all the features further improves perfor-
mance by 0.01 and 0.016. An evaluation of our best
error detection method shows a Pearson correlation
of 0.611 between the estimated and the true CLC er-
ror counts. This suggests that there is room for im-
provement in the language models we developed to
estimate the error-rate. In the experiments reported
hereafter, we use the ukWaC+CLC LM to calculate
the error-rate.
In order to assess the independent as opposed to
the order-dependent additive contribution of each
feature type to the overall performance of the sys-
tem, we run a number of ablation tests. An ablation
test consists of removing one feature of the system
at a time and re-evaluating the model on the test set.
Table 2 presents Pearson’s and Spearman’s correla-
tion between the CLC and our system, when remov-
ing one feature at a time. All features have a positive
effect on performance, while the error-rate has a big
impact, as its absence is responsible for a 0.061 de-
crease of Spearman’s correlation. In addition, the
184
Model
Pearson’s Spearman’s
correlation correlation
Regression 0.697 0.706
Rank preference 0.741 0.773
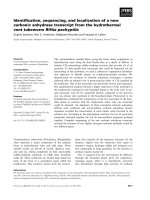
Table 3: Comparison between regression and rank pref-
erence model.
removal of either the word ngrams, the PS rules, or
the error-rate estimate contributes to a large decrease
in Pearson’s correlation.
In order to test the significance of the improved
correlations, we ran one-tailed t-tests with a = 0.05
for the difference between dependent correlations
(Williams, 1959; Steiger, 1980). The results showed
that PoS ngrams, PS rules, the complexity measures,
and the estimated error-rate contribute significantly
to the improvement of Spearman’s correlation, while
PS rules also contribute significantly to the improve-
ment of Pearson’s correlation.
One of the main approaches adopted by previ-
ous systems involves the identification of features
that measure writing skill, and then the application
of linear or stepwise regression to find optimal fea-
ture weights so that the correlation with manually
assigned scores is maximised. We trained a SVM
regression model with our full set of feature types
and compared it to the SVM rank preference model.
The results are given in Table 3. The rank preference
model improves Pearson’s and Spearman’s correla-
tion by 0.044 and 0.067 respectively, and these dif-
ferences are significant, suggesting that rank prefer-
ence is a more appropriate model for the AA task.
Four senior and experienced ESOL examiners re-
marked the 97 FCE test scripts drawn from 2001 ex-
ams, using the marking scheme from that year (see
Section 2). In order to obtain a ceiling for the perfor-
mance of our system, we calculate the average corre-
lation between the CLC and the examiners’ scores,
and find an upper bound of 0.796 and 0.792 Pear-
son’s and Spearman’s correlation respectively.
In order to evaluate the overall performance of our
system, we calculate its correlation with the four se-
nior examiners in addition to the RASCH-adjusted
CLC scores. Tables 4 and 5 present the results ob-
tained.
The average correlation of the AA system with the
CLC and the examiner scores shows that it is close
CLC E1 E2 E3 E4 AA
CLC - 0.820 0.787 0.767 0.810 0.741
E1 0.820 - 0.851 0.845 0.878 0.721
E2 0.787 0.851 - 0.775 0.788 0.730
E3 0.767 0.845 0.775 - 0.779 0.747
E4 0.810 0.878 0.788 0.779 - 0.679
AA 0.741 0.721 0.730 0.747 0.679 -
Avg 0.785 0.823 0.786 0.782 0.786 0.723
Table 4: Pearson’s correlation of the AA system predicted
values with the CLC and the examiners’ scores, where E1
refers to the first examiner, E2 to the second etc.
CLC E1 E2 E3 E4 AA
CLC - 0.801 0.799 0.788 0.782 0.773
E1 0.801 - 0.809 0.806 0.850 0.675
E2 0.799 0.809 - 0.744 0.787 0.724
E3 0.788 0.806 0.744 - 0.794 0.738
E4 0.782 0.850 0.787 0.794 - 0.697
AA 0.773 0.675 0.724 0.738 0.697 -
Avg 0.788 0.788 0.772 0.774 0.782 0.721
Table 5: Spearman’s correlation of the AA system pre-
dicted values with the CLC and the examiners’ scores,
where E1 refers to the first examiner, E2 to the second
etc.
to the upper bound for the task. Human–machine
agreement is comparable to that of human–human
agreement, with the exception of Pearson’s correla-
tion with examiner E4 and Spearman’s correlation
with examiners E1 and E4, where the discrepancies
are higher. It is likely that a larger training set and/or
more consistent grading of the existing training data
would help to close this gap. However, our system is
not measuring some properties of the scripts, such as
discourse cohesion or relevance to the prompt elicit-
ing the text, that examiners will take into account.
5 Validity tests
The practical utility of an AA system will depend
strongly on its robustness to subversion by writers
who understand something of its workings and at-
tempt to exploit this to maximise their scores (in-
dependently of their underlying ability). Surpris-
ingly, there is very little published data on the ro-
bustness of existing systems. However, Powers et
al. (2002) invited writing experts to trick the scoring
185
capabilities of an earlier version of e-Rater (Burstein
et al., 1998). e-Rater (see Section 6 for more de-
tails) assigns a score to a text based on linguistic fea-
ture types extracted using relatively domain-specific
techniques. Participants were given a description of
these techniques as well as of the cue words that the
system uses. The results showed that it was easier
to fool the system into assigning higher than lower
scores.
Our goal here is to determine the extent to which
knowledge of the feature types deployed poses a
threat to the validity of our system, where certain
text generation strategies may give rise to large pos-
itive discrepancies. As mentioned in Section 2, the
marking criteria for FCE scripts are primarily based
on the accurate use of a range of different grammati-
cal constructions relevant to specific communicative
goals, but our system assesses this indirectly.
We extracted 6 high-scoring FCE scripts from the
CLC that do not overlap with our training and test
data. Based on the features used by our system and
without bias towards any modification, we modified
each script in one of the following ways:
i. Randomly order:
(a) word unigrams within a sentence
(b) word bigrams within a sentence
(c) word trigrams within a sentence
(d) sentences within a script
ii. Swap words that have the same PoS within a
sentence
Although the above modifications do not ex-
haust the potential challenges a deployed AA system
might face, they represent a threat to the validity of
our system since we are using a highly related fea-
ture set. In total, we create 30 such ‘outlier’ texts,
which were given to an ESOL examiner for mark-
ing. Using the ‘outlier’ scripts as well as their origi-
nal/unmodified versions, we ran our system on each
modification separately and calculated the correla-
tion between the predicted values and the examiner’s
scores. Table 6 presents the results.
The predicted values of the system have a high
correlation with the examiner’s scores when tested
on ‘outlier’ texts of modification types i(a), i(b) and
Modification
Pearson’s Spearman’s
correlation correlation
i(a) 0.960 0.912
i(b) 0.938 0.914
i(c) 0.801 0.867
i(d) 0.08 0.163
ii 0.634 0.761
Table 6: Correlation between the predicted values and the
examiner’s scores on ‘outlier’ texts.
i(c). However, as i(c) has a lower correlation com-
pared to i(a) and i(b), it is likely that a random order-
ing of ngrams with N > 3 will further decrease per-
formance. A modification of type ii, where words
with the same PoS within a sentence are swapped,
results in a Pearson and Spearman correlation of
0.634 and 0.761 respectively.
Analysis of the results showed that our system
predicted higher scores than the ones assigned by the
examiner. This can be explained by the fact that texts
produced using modification type ii contain a small
portion of correct sentences. However, the marking
criteria are based on the overall writing quality. The
final case, where correct sentences are randomly or-
dered, receives the lowest correlation. As our sys-
tem is not measuring discourse cohesion, discrepan-
cies are much higher; the system’s predicted scores
are high whilst the ones assigned by the examiner
are very low. However, for a writer to be able to
generate text of this type already requires significant
linguistic competence, whilst a number of generic
methods for assessing text and/or discourse cohe-
sion have been developed and could be deployed in
an extended version of our system.
It is also likely that highly creative ‘outlier’ essays
may give rise to large negative discrepancies. Recent
comments in the British media have focussed on this
issue, reporting that, for example, one deployed es-
say marking system assigned Winston Churchill’s
speech ‘We Shall Fight on the Beaches’ a low score
because of excessive repetition
5
. Our model pre-
dicted a high passing mark for this text, but not the
highest one possible, that some journalists clearly
feel it deserves.
5
/>186
6 Previous work
In this section we briefly discuss a number of the
more influential and/or better described approaches.
P
´
erez-Mar
´
ın et al. (2009), Williamson (2009), Dikli
(2006) and Valenti et al. (2003) provide a more de-
tailed overview of existing AA systems.
Project Essay Grade (PEG) (Page, 2003), one of
the earliest systems, uses a number of manually-
identified mostly shallow textual features, which are
considered to be proxies for intrinsic qualities of
writing competence. Linear regression is used to as-
sign optimal feature weights that maximise the cor-
relation with the examiner’s scores. The main is-
sue with this system is that features such as word
length and script length are easy to manipulate in-
dependently of genuine writing ability, potentially
undermining the validity of the system.
In e-Rater (Attali and Burstein, 2006), texts
are represented using vectors of weighted features.
Each feature corresponds to a different property of
texts, such as an aspect of grammar, style, discourse
and topic similarity. Additional features, represent-
ing stereotypical grammatical errors for example,
are extracted using manually-coded task-specific de-
tectors based, in part, on typical marking criteria. An
unmarked text is scored based on the cosine simi-
larity between its weighted vector and the ones in
the training set. Feature weights and/or scores can
be fitted to a marking scheme by stepwise or lin-
ear regression. Unlike our approach, e-Rater mod-
els discourse structure, semantic coherence and rel-
evance to the prompt. However, the system contains
manually developed task-specific components and
requires retraining or tuning for each new prompt
and assessment task.
Intelligent Essay Assessor (IEA) (Landauer et al.,
2003) uses Latent Semantic Analysis (LSA) (Lan-
dauer and Foltz, 1998) to compute the semantic sim-
ilarity between texts, at a specific grade point, and
a test text. In LSA, text is represented by a ma-
trix, where rows correspond to words and columns
to context (texts). Singular Value Decomposition
(SVD) is used to obtain a reduced dimension matrix
clustering words and contexts. The system is trained
on topic and/or prompt specific texts while test texts
are assigned a score based on the ones in the training
set that are most similar. The overall score, which is
calculated using regression techniques, is based on
the content score as well as on other properties of
texts, such as style, grammar, and so forth, though
the methods used to assess these are not described
in any detail in published work. Again, the system
requires retraining or tuning for new prompts and
assessment tasks.
Lonsdale and Strong-Krause (2003) use a mod-
ified syntactic parser to analyse and score texts.
Their method is based on a modified version of
the Link Grammar parser (Sleator and Templerley,
1995) where the overall score of a text is calculated
as the average of the scores assigned to each sen-
tence. Sentences are scored on a five-point scale
based on the parser’s cost vector, which roughly
measures the complexity and deviation of a sentence
from the parser’s grammatical model. This approach
bears some similarities to our use of grammatical
complexity and extragrammaticality features, but
grammatical features represent only one component
of our overall system, and of the task.
The Bayesian Essay Test Scoring sYstem
(BETSY) (Rudner and Liang, 2002) uses multino-
mial or Bernoulli Naive Bayes models to classify
texts into different classes (e.g. pass/fail, grades A–
F) based on content and style features such as word
unigrams and bigrams, sentence length, number of
verbs, noun–verb pairs etc. Classification is based
on the conditional probability of a class given a set
of features, which is calculated using the assumption
that each feature is independent of the other. This
system shows that treating AA as a text classifica-
tion problem is viable, but the feature types are all
fairly shallow, and the approach doesn’t make effi-
cient use of the training data as a separate classifier
is trained for each grade point.
Recently, Chen et al. (2010) has proposed an un-
supervised approach to AA of texts addressing the
same topic, based on a voting algorithm. Texts are
clustered according to their grade and given an ini-
tial Z-score. A model is trained where the initial
score of a text changes iteratively based on its sim-
ilarity with the rest of the texts as well as their Z-
scores. The approach might be better described as
weakly supervised as the distribution of text grades
in the training data is used to fit the final Z-scores to
grades. The system uses a bag-of-words represen-
tation of text, so would be easy to subvert. Never-
187
theless, exploration of the trade-offs between degree
of supervision required in training and grading ac-
curacy is an important area for future research.
7 Conclusions and future work
Though many of the systems described in Section
6 have been shown to correlate well with examin-
ers’ marks on test data in many experimental con-
texts, no cross-system comparisons are available be-
cause of the lack of a shared training and test dataset.
Furthermore, none of the published work of which
we are aware has systematically compared the con-
tribution of different feature types to the AA task,
and only one (Powers et al., 2002) assesses the ease
with which the system can be subverted given some
knowledge of the features deployed.
We have shown experimentally how rank prefer-
ence models can be effectively deployed for auto-
mated assessment of ESOL free-text answers. Based
on a range of feature types automatically extracted
using generic text processing techniques, our sys-
tem achieves performance close to the upper bound
for the task. Ablation tests highlight the contribu-
tion of each feature type to the overall performance,
while significance of the resulting improvements in
correlation with human scores has been calculated.
A comparison between regression and rank prefer-
ence models further supports our approach. Prelim-
inary experiments based on a set of ‘outlier’ texts
have shown the types of texts for which the system’s
scoring capability can be undermined.
We plan to experiment with better error detection
techniques, since the overall error-rate of a script is
one of the most discriminant features. Briscoe et
al. (2010) describe an approach to automatic off-
prompt detection which does not require retraining
for each new question prompt and which we plan
to integrate with our system. It is clear from the
‘outlier’ experiments reported here that our system
would benefit from features assessing discourse co-
herence, and to a lesser extent from features as-
sessing semantic (selectional) coherence over longer
bounds than those captured by ngrams. The addition
of an incoherence metric to the feature set of an AA
system has been shown to improve performance sig-
nificantly (Miltsakaki and Kukich, 2000; Miltsakaki
and Kukich, 2004).
Finally, we hope that the release of the training
and test dataset described here will facilitate further
research on the AA task for ESOL free text and, in
particular, precise comparison of different systems,
feature types, and grade fitting methods.
Acknowledgements
We would like to thank Cambridge ESOL, a division
of Cambridge Assessment, for permission to use and
distribute the examination scripts. We are also grate-
ful to Cambridge Assessment for arranging for the
test scripts to be remarked by four of their senior ex-
aminers. Finally, we would like to thank Marek Rei,
Øistein Andersen and the anonymous reviewers for
their useful comments.
References
Yigal Attali and Jill Burstein. 2006. Automated essay
scoring with e-rater v.2. Journal of Technology, Learn-
ing, and Assessment, 4(3):1–30.
Burton H. Bloom. 1970. Space/time trade-offs in hash
coding with allowable errors. Communications of the
ACM, 13(7):422–426, July.
E.J. Briscoe, J. Carroll, and R Watson. 2006. The second
release of the RASP system. In ACL-Coling’06 In-
teractive Presentation Session, pages 77–80, Sydney,
Australia.
E.J. Briscoe, B. Medlock, and Ø. Andersen. 2010. Au-
tomated Assessment of ESOL Free Text Examinations.
Cambridge University, Computer Laboratory, TR-790.
Jill Burstein, Karen Kukich, Susanne Wolff, Chi Lu,
Martin Chodorow, Lisa Braden-Harder, and Mary Dee
Harris. 1998. Automated scoring using a hybrid fea-
ture identification technique. Proceedings of the 36th
annual meeting on Association for Computational Lin-
guistics, pages 206–210.
YY Chen, CL Liu, TH Chang, and CH Lee. 2010.
An Unsupervised Automated Essay Scoring System.
IEEE Intelligent Systems, pages 61–67.
Semire Dikli. 2006. An overview of automated scoring
of essays. Journal of Technology, Learning, and As-
sessment, 5(1).
S. Elliot. 2003. IntelliMetric: From here to validity. In
M.D. Shermis and J.C. Burstein, editors, Automated
essay scoring: A cross-disciplinary perspective, pages
71–86.
Adriano Ferraresi, Eros Zanchetta, Marco Baroni, and
Silvia Bernardini. 2008. Introducing and evaluating
ukWaC, a very large web-derived corpus of English.
188
In S. Evert, A. Kilgarriff, and S. Sharoff, editors, Pro-
ceedings of the 4th Web as Corpus Workshop (WAC-4).
G.H. Fischer and I.W. Molenaar. 1995. Rasch models:
Foundations, recent developments, and applications.
Springer.
Thorsten Joachims. 1998. Text categorization with sup-
port vector machines: Learning with many relevant
features. In Proceedings of the European Conference
on Machine Learning, pages 137–142. Springer.
Thorsten Joachims. 1999. Making large scale SVM
learning practical. In B. Sch
¨
olkopf, C. Burges, and
A. Smola, editors, Advances in Kernel Methods - Sup-
port Vector Learning. MIT Press.
Thorsten Joachims. 2002. Optimizing search engines
using clickthrough data. In Proceedings of the ACM
Conference on Knowledge Discovery and Data Mining
(KDD), pages 133–142. ACM.
T.K. Landauer and P.W. Foltz. 1998. An introduction to
latent semantic analysis. Discourse processes, pages
259–284.
T.K. Landauer, D. Laham, and P.W. Foltz. 2003. Au-
tomated scoring and annotation of essays with the In-
telligent Essay Assessor. In M.D. Shermis and J.C.
Burstein, editors, Automated essay scoring: A cross-
disciplinary perspective, pages 87–112.
Deryle Lonsdale and D. Strong-Krause. 2003. Auto-
mated rating of ESL essays. In Proceedings of the
HLT-NAACL 2003 Workshop: Building Educational
Applications Using Natural Language Processing.
Eleni Miltsakaki and Karen Kukich. 2000. Automated
evaluation of coherence in student essays. In Proceed-
ings of LREC 2000.
Eleni Miltsakaki and Karen Kukich. 2004. Evaluation
of text coherence for electronic essay scoring systems.
Natural Language Engineering, 10(01):25–55, March.
D. Nicholls. 2003. The Cambridge Learner Corpus: Er-
ror coding and analysis for lexicography and ELT. In
Proceedings of the Corpus Linguistics 2003 confer-
ence, pages 572–581.
E.B. Page. 2003. Project essay grade: PEG. In M.D.
Shermis and J.C. Burstein, editors, Automated essay
scoring: A cross-disciplinary perspective, pages 43–
54.
D. P
´
erez-Mar
´
ın, Ismael Pascual-Nieto, and P. Rodr
´
ıguez.
2009. Computer-assisted assessment of free-text
answers. The Knowledge Engineering Review,
24(04):353–374, December.
D.E. Powers, J.C. Burstein, M. Chodorow, M.E. Fowles,
and K. Kukich. 2002. Stumping e-rater: challenging
the validity of automated essay scoring. Computers in
Human Behavior, 18(2):103–134.
L.M. Rudner and Tahung Liang. 2002. Automated essay
scoring using Bayes’ theorem. The Journal of Tech-
nology, Learning and Assessment, 1(2):3–21.
L.M. Rudner, Veronica Garcia, and Catherine Welch.
2006. An Evaluation of the IntelliMetric Essay Scor-
ing System. Journal of Technology, Learning, and As-
sessment, 4(4):1–21.
D.D.K. Sleator and D. Templerley. 1995. Parsing En-
glish with a link grammar. Proceedings of the 3rd In-
ternational Workshop on Parsing Technologies, ACL.
AJ Smola. 1996. Regression estimation with support
vector learning machines. Master’s thesis, Technische
Universit
¨
at Munchen.
J.H. Steiger. 1980. Tests for comparing elements of a
correlation matrix. Psychological Bulletin, 87(2):245–
251.
Salvatore Valenti, Francesca Neri, and Alessandro Cuc-
chiarelli. 2003. An overview of current research
on automated essay grading. Journal of Information
Technology Education, 2:3–118.
Vladimir N. Vapnik. 1995. The nature of statistical
learning theory. Springer.
E. J. Williams. 1959. The Comparison of Regression
Variables. Journal of the Royal Statistical Society. Se-
ries B (Methodological), 21(2):396–399.
DM Williamson. 2009. A Framework for Implement-
ing Automated Scoring. In Annual Meeting of the
American Educational Research Association and the
National Council on Measurement in Education, San
Diego, CA.
189