Phân tích báo cáo tài chính doanh nghiệp (GMD)
Bạn đang xem bản rút gọn của tài liệu. Xem và tải ngay bản đầy đủ của tài liệu tại đây (2.72 MB, 38 trang )
FINANCIAL REPORTING AND ANALYSIS
TOPIC: Analysis of financial statements for the period
of 2019-2021 of Gemadept Corporation
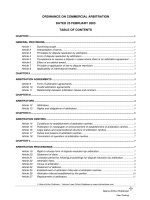
TABLE OF CONTENT
I. Introduction about the firm. ........................................................................................3
II. Environment and strategy analysis. .......................................................................... 4
1. Macro-environmental analysis ...............................................................................4
1.1. Political. .......................................................................................................... 4
1.2. Economics. ......................................................................................................4
1.3. Sociocultural. .................................................................................................. 5
1.4. Technology. .....................................................................................................5
1.5. Legal. ...............................................................................................................5
1.6. Environmental. ................................................................................................6
2. Industry analysis .................................................................................................... 6
2.1. Barriers to market entry. ................................................................................. 6
2.2. Purchasing ability. ...........................................................................................6
2.3. Alternative products. .......................................................................................7
2.4. Strength of the supplier. ..................................................................................7
2.5. Level of competition .......................................................................................7
3. Business Strategy analysis. .................................................................................... 8
3.1. Business strategy. ............................................................................................8
3.2. Business strategy evaluation. ..........................................................................8
III. Interpret financial result through Income statement ............................................... 9
1. Horizontal and trend analysis. ............................................................................... 9
2. Common-size analysis. ........................................................................................ 14
IV. Interpret changes and structure of Assets and Capital on the Balance sheet. ...... 15
1. Assets ................................................................................................................... 15
2. Liabilities and Equity. ..........................................................................................18
V. Cash flow statement analysis. .................................................................................22
1. Interpret cash flow statement in 2019. ................................................................ 22
2. Interpret cash flow statement in 2020. ................................................................ 23
3. Interpret cash flow statement in 2021. ................................................................ 25
VI. Financial ratio analysis. ......................................................................................... 27
1. Activity Ratios ..................................................................................................... 27
1
2. Liquidity Ratios ....................................................................................................29
3. Solvency Ratios ....................................................................................................30
4. Profitability Ratios ............................................................................................... 32
4.1. Return on sale ............................................................................................... 32
4.2. Return on investment .................................................................................... 34
VII. Summary ...............................................................................................................34
VII. References ............................................................................................................ 36
2
I. Introduction about the firm.
Gemadept Joint Stock Company - GMD (established in 1990) mainly operates in the
field of port operation and logistics. GMD owns a system of ports and logistics
infrastructure stretching from North to South and neighboring countries (Singapore, Hong
Kong, China, Cambodia...). GMD has a chain of 6 ports in operation and continues to
develop the leading Gemalink deep-water seaport. In the field of Logistics, GMD has a
system of Distribution Centers covering many key economic regions, with a total area of
hundreds of thousands of square meters. After more than 30 years of operation, GMD
has achieved memorable milestones such as:
Image 1: Memorable milestones of GMD
Image 2: GMD’s business sectors
With the scale of dozens of subsidiaries and joint ventures, especially with significant
contributions to the country's economy, Gemadept has been honored in the Top 50 Logistics
3
Enterprises in Vietnam for many consecutive years. effective business enterprises, Top 50
best-listed enterprises in Vietnam voted by Forbes, etc…
Image 3: GMD’s business lines and services
II. Environment and strategy analysis.
1. Macro-environmental analysis
1.1. Political.
The skirmish between Russia - Ukraine: Political-military tensions drag the price of
oil up, thereby increase sea freight rates and increase wharf charges. If enterprises in the
port industry have a fleet of ships and have stored fuel to operate the fleet, are likely to
benefit from the increased freight rates. But if raw materials in stock are limited, they will
face difficulties in terms of costs of doing business, but this is only a short-term impact.
1.2. Economics.
Import - Export activities still maintain growth momentum: In 2021, COVID-19
continued to have complicated developments. However, according to updated data for the
first two months of 2022, the total import - export value of Vietnam reached 109.62 billion
USD, an increase of 14.2%, compared to the same period in 2021. In 2022, exports are
expected to break through and set new records. The development of import - export brings
advantages to GMD because its key areas of activity are Seaports and Logistics serving
transshipment, import - export goods.
FDI capital and FTAs: In 2021, FDI inflows from 106 countries and territories did
invest in Vietnam. As of January 2022, there are 15 FTAs
in effect and 2 agreements
4
are under negotiation, which will support Vietnam's export orders, lead to growth in goods
traffic through seaports, these will be the driving forces to further promote the positive signs
of import and export.
1.3. Sociocultural.
Booming logistics for e-commerce: The e-commerce market grows rapidly, placing
a great demand on logistics infrastructure with the characteristics of using larger warehouse
space and logistics compared to traditional trade channels. Especially in the period of
Covid-19, consumers have been changing their shopping habits. The scale of freight
transport by road, sea, air and rail are large for companies in the logistics industry to seize
development opportunities.
Logistics human resources development: With the formation of the Vietnam
Logistics Human Resource Growth Association and the Vietnam Student Logistics Club,
the development of logistics human resources has reached the next level. Up until now,
logistics training has been provided by around 50 universities, more than 60 colleges, and a
few short-term training institutions.
1.4. Technology.
The previous 3years have seen significant development in the use of technology in
logistics, as evidenced by a surge in local application solutions, particularly the creation of a
holistic solution with system integration and artificial intelligence application.
First, IT will be used in road transport to optimize vehicle capacity, regulate routes,
timetables, and time, and improve truck occupancy rates.
Second, last-mile delivery, rapid delivery, and e-commerce warehouse automation
systems are all available.
Third, several significant manufacturing companies have used lean production and
efficient operation concepts by combining operating systems with automation.
Fourth, a number of domestic retailers are implementing a combination of
information systems - automation - artificial intelligence in supply chain management from
purchasing to distribution to consumers.
1.5. Legal.
Logistics services have been formalized under the 2005 Commercial Law, the
Transportation Law, and decrees, all of which have helped to create ideal conditions for
their development.
In 2021, the Vietnam Association of Maritime Agents and Brokers proposed to adjust
service prices at seaports, protecting the interests of domestic businesses, because the price
of container handling services in Vietnam is the lowest in the world (equal to 80 percent of
Cambodia, 70 percent of Malaysia, 61 percent of Indonesia, 46 percent of Singapore).
5
Increasing the loading and unloading price will enhance income for businesses in the
Seaport-Logistics industry, allowing them to reinvest.
1.6. Environmental.
During the pandemic, road transport services are experiencing certain challenges:
the number of cross-border road transport has reduced dramatically, drivers must be
segregated to ensure safety, or drivers or vehicles must be changed. Tractor is one of the
most challenging obstacles to overcome.
In the first half of 2020, the shipping and port industries will face challenges owing
to a lack of staff as well as a drop in trade volume. Shipping services, on the other hand,
have been less affected by the COVID-19 outbreak than other modes of transportation and
have experienced some development.
Aviation had the biggest reduction of all means of transportation, since it was
affected the hardest by travel restrictions between nations as the COVID-19 epidemic
unfolded. However, the aviation sector is expected to rebound in 2022, as countries reopen
their economies and stimulate tourism and trade.
Due to a significant drop in passenger and freight traffic, the COVID-19 outbreak has
had a significant impact on the rail transport service business. While vehicle transport is
clogged at the border gate due to the stringent quarantine, the railway has a clear advantage
in terms of cost and time. Because the task of epidemic prevention and quarantine for
drivers and accompanying workers on cargo ships is more simpler than on the road, the
danger of infection is reduced.
2. Industry analysis
2.1. Barriers to market entry.
The seaport segment needs a large financial resource as well as a network of partners
to build and operate a business well, this will be the biggest obstacle for a company that
wants to enter this industry. Meanwhile, the Logistics segment is an open market with many
new business, cooperation and operation models with fast development. The Government
has always prioritized and supported the logistics industry, invested in large traffic works
and the international gateway port system, creating momentum for many businesses to start
up in this field.
2.2. Purchasing ability.
Customers of the Seaport - Logistics service industry are domestic individuals and
groups with domestic and foreign transportation needs and units; Individuals who have
demand for shipping agents, marine brokers, transport agents and freight forwarders. With a
large number of suppliers, the buyer can get similar products and services from other
suppliers, so the buyer will be less dependent on a particular supplier. At that time, the
6
power of buyers will be greater. Furthermore, with many alternative providers available, the
customer's switching costs are lower. At that time, the bargaining power of customers will
be stronger. It can be seen that in the seaport - Logistic service industry, the position of
customers is highly appreciated.
2.3. Alternative products.
"Green logistics" is progressively displacing traditional logistics as a key priority for
firms seeking to establish long-term value and gain competitive advantages. Businesses
must pay attention to the usage of production methods such as equipment, technology for
environmental protection, and packaging with environmentally friendly materials. Rather of
concentrating on how these principles influence their operations, many logistics businesses
are increasingly building new service business models tied to sustainability.
Because of this pressure, GMD has aggressively pushed the role of a responsible
enterprise to the community in the last 1-2 years with many green energy projects such as
the SCSC Air Cargo Terminal and the Mekong Logistics Refrigeration Center. They
actively contribute to environmental protection while lowering operating and exploitation
costs, resulting in a greener, and more efficient integrated supply chain.
2.4. Strength of the supplier.
Currently, there are around 4,000 - 4,500 direct logistics businesses and up to 30,000
linked businesses functioning countrywide, with over 20 businesses working in the sector of
transportation - seaports. Companies that provide marine services are becoming more
competitive. The number of service businesses has exploded, and the transportation sector
has matured to some extent. According to data on the functioning of Vietnam's logistics
business, indigenous firms account for 25% of the market, while international logistics
enterprises account for the remaining 75%. This is a concerning figure for Vietnamese
businesses since foreign firms account for a substantial portion of the market, weakening
indigenous providers.
2.5. Level of competition
Seaport - Logistics is a strongly competitive business in Vietnam, with both domestic
and international companies competing for market share. At the moment, however, the
amount of competitiveness is determined by each cluster of ports. The group of ports
located deep downstream in the Hai Phong Port cluster confront a somewhat strong rivalry
environment, owing to rapidly expanding supply as many new ports come online in a short
period of time. However, because most ports in the Cai Mep - Thi Vai area are already at
full design capacity, competition for major port clusters remains limited.
7
3. Business Strategy analysis.
3.1. Business strategy.
Regarding the key business field, Seaports - Logistics, the company has set a goal to
continue to invest, and expand the integrated ecosystem of ports and logistics, aiming to
triple the volume of production and profit before tax by 2025. Continue to seek investment
opportunities to develop concentric fields including river ports, ICDs, wharves, logistics
centers, air cargo ports, industrial parks, etc. to promote green-oriented growth and
development. lasting.
For the real estate sector, GMD currently has two notable projects. One is the
Saigon Gem project, located in District 1, Ho Chi Minh City. Ho Chi Minh City with an
area of
3,640m2. The second is a 6,715m2 project located on Lane Xang Boulevard in
Laos, currently in the process of constructing the foundation and tunnel. GMD is still
looking for potential partners and investors to be able to divest at a favorable time and
condition, to focus maximum resources on core activities, and it is expected that the transfer
can be done in 2022.
For the rubber segment, in recent years, GMD has minimized new plantings,
focusing only on maintaining the previously planted orchards. In 2022, GMD wishes to
further accelerate the work with partners and hopes this year can announce official
information about this project's partners.
3.2. Business strategy evaluation.
Regarding the core business of Seaport - Logistics, GMD quickly sought a "bigger
opportunity" in the target of the Master Plan for Development of Vietnam's seaport system
in the period of 2021 - 2030. GMD has a chain of 8 ports, including super deep-water ports
Gemalink - the leading scale in the country. GMD's growth plan is quite impressive. In the
upcoming 2021-2025 period, the company has set a target of 3 times higher output and
profit before tax in 2025 compared to 2020, so the average annual growth is 24% when
Vietnam's expected 5-year average GDP is at 6.5 - 7%.
For the real estate sector, if GMD has a specific vision and strategy and knows how
to take advantage of opportunities, that will be an advantage. When the market is quiet and
foreign investors withdraw, GMD can commit to dominating the investment market and
develop real estate projects like how GMD built CJ Building. However, businesses also
need to have the right consideration, limit "muckiness" in the real estate field to be affected
by land fevers, real estate bubbles leading to damage in the past like GMD used to invest in
securities in the period 2006 - 2007.
For the rubber segment, making investments outside the industry with rubber
products is currently considered a risky job for GMD. GMD has implemented the project for
8
more than 11 years and has had periods of stagnation. According to the notes to the
consolidated financial statements for 2020 and Q4/2021, the annual cost of the rubber
plantation project is about 55 billion but no profit has been recorded. It can be seen that the
investment strategy in the rubber segment has not brought many benefits to the business up
to now. In early 2022, the rubber market records positive changes, GMD should take
advantage of opportunities to take new steps in the rubber plantation project.
III. Interpret financial result through Income statement
1. Horizontal and trend analysis.
Net revenue: In 2019, GMD's revenue was 2,642 billion thanks to (1) the total
volume of container throughput increased by 11% YoY as the throughput of Nam Dinh Vu
port increased by 225% YoY, compensating for the decrease in volume at 2 ports Nam Hai
and Nam Hai Dinh Vu 20% and 10% YoY respectively, and (2) Floor handling fee at Hai
Phong port area increased by 10%.
GMD 2020's revenue mostly comes from port operations and partly comes from
logistics and office leasing. Along with the impact of the epidemic, an increase in
competition and a decrease in cargo throughput at Hai Phong port cluster, GMD's results
were not very positive this year, recording a revenue of 2,605 billion, a decrease of 2,605
billion. decreased slightly (-1.5% YoY) due to competitive pressure at Nam Dinh Vu port.
In 2021, GMD brings in 3,205.9 billion in net revenue, an increase of 23% YoY. Of
which, revenue from port operations will reach 2,762.4 billion, accounting for 86.2% of the
total turnover; the remaining 442.5 billion (accounting for 13.8%) is logistics revenue,
which increased sharply by 26.1% over the same period last year thanks to the increasing
demand for logistics for cold goods and other office leasing.
Cost of goods sold: In 2020, there is a sharp increase because some indicators such
as the cost of raw materials, labor costs, and costs for logistics services all increased not too
much compared to 2019, fluctuating around 1%. In contrast, port operating costs and other
costs had a slight decrease, leading to an increase in COGS in 2020 compared to 2019 only
1.59%. In 2021, the economy got used to the impact of the pandemic, GMD stepped up
operations, typically the labor cost increased by 19.4% YoY, the port operating cost
increased by 31.3% YoY, leading to the COGS in an increase of 26.44% YoY.
9
Image 4: COGS’s Components
Image 5: The factors effect COGs
Gross profit: Gross profit in 3 years accounted for 35% - 38% of net revenue,
showing that the company's main revenue comes from the main activities of port operation
and logistics. In 2019, GMD's gross profit was 1.012 billion. Although sales and service
provision were lower than in 2018, COGS also decreased by 6.3%, leading to a slight
increase in GMD's gross profit of 4.5% YoY. In 2020, COGS continued to increase, but in
return, revenue decreased due to competitive pressure at Nam Dinh Vu port and the impact
of the pandemic. The higher COGS has pulled the gross profit margin of this logistics
company down slightly by 28% over the same period last year. Accumulated for the whole
year of 2021, gross profit reached 1.141 billion, up 20% YoY. Although COGS increased
by 24.6% YoY, sales and service provision increased as Hai Phong and Gemalink port
clusters were the main growth drivers. Gemalink's total docking volume reached 1,905,000
TEUs (+52% yoy), of which the largest contribution came from Hai Phong port, up 13%
YoY to 754,359 TEUs.
10
Revenue and Expenses from financial activities:
Image 6: Revenue and Expenses from financial activities
Revenue from financial activities recorded a rapid decline in the past 3 years,
although the situation is better in 2021 but still only reached about 37% compared to 2019.
In the opposite direction, although financial income revenue decreased, financial activity
expenses still increased in 2020 and by 2021, this indicator has decreased relatively
significantly (26.11%) compared to 2019.
2 years before 2019, GMD had accounted for infrequent incomes and expenses from
asset sale, provision reversal and provision for devaluation of investment in the rubber
segment. If all these infrequent incomes and expenses are excluded, GMD's 2019 operating
profit increased by 12.6% compared to 2018. This is mainly due to the profit contribution
from the joint ventures and associates company increase that GMD focuses on investing in
such as Cai Mep Port Joint Stock Company GMD - Terminal Link, Saigon Cargo Services
Joint Stock Company (SCS),... with a total investment value of 2.485 billion.
2020 is the year GMD reported the lowest profit in the past 7 years. The main reason
was not from main activity but from the profit from liquidation of investments which
decreased by 83.68% YoY, pulling revenue from financial activities down by 74.35% YoY.
Besides normal business and production activities affected by Covid-19, the decline in
profits from joint ventures and associates companies is the main reason for negative growth.
In 2020, GMD's financial activities revenue decreased because profit from divestment of
SCS was recorded in 2019. Profit from associates in 2020 reached 160 billion (-32.1%
YoY), a decrease can be explained by: (1) subsidiaries in the port transportation/operating
industry are all affected by the Covid-19 and (2) Gemalink Port is under construction, so it
is not possible to start the operation yet. Financial expenses in 2020 increased by 8.71%
11
because GMD recorded a loss of nearly 14 billion from financial investment activities. At
the end of the year, a number of securities investments that led to GMD's losses included
purchases of shares in the National Commercial Joint Stock Bank (NCB), Viet Duc Steel
JSC (VGS), Manganese Mineral Joint Stock Company (MMC), etc. and some other
investments.
GMD's financial activities performance in 2021 is slightly better than 2020,
increasing by 44.22% YoY to nearly 40 billion, mainly thanks to the profit on liquidation of
investments (23.6 billion). In addition to unfinished investments in MMC and Thu Duc
Steel Joint Stock Company (TDS) with a decreasing fair value, in early 2021, GMD also
liquidated an investment in NCB shares. This was also an investment that persisted for
many years and caused a lot of financial loss for GMD. In addition, the profit from joint
ventures and associates in 2021 reached nearly 82 billion, up 69% YoY. In contrast,
financial expenses decreased by 32.03% YoY, to 108 billion, due to a reduction in exchange
rate losses and interest expenses. This bodes well for the company's financial performance,
far surpassing many previous forecasts.
Selling expenses: The cost of sales activities did not change much between 2019 and
2020, however, by 2021, this cost will increase by more than 25% YoY through GMD
paying additional commissions to the broker service to find more customers for the business.
This is a necessary expense, contributing to GMD's revenue growth in 2021.
Enterprises cost: The cost of business administration when GMD operates under
normal circumstances reached about 330 billion in 2019, only increased by 3% YoY due to
the increase in salary of management staff (+9% YoY) and cost of office materials (+49%)
but in return GMD was able to cut the cost of outsourcing services (-9%) and other expenses
(-11%).
Business administration expenses in 2020 were the highest in the research period,
reaching 159,264 million (+8.71 YoY). During the year GMD was able to cut costs of office
materials (-27.75% YoY) and outsourced service costs (-5.57% YoY), but incurred an
additional depreciation expense of fixed assets (+7.74% YoY) and especially the sharp
increase in goodwill allocation arising from the investment in Hai Nam Dinh Vu Port JSC,
Nam Hai Port JSC and Binh Port JSC Duong (+59.67%).
12
Image 7: Enterprise cost management’s components
By 2021, GMD has shown its effectiveness in cost management when it continues to
cut the cost of office materials by 13.56%, the cost of outsourced services and other
expenses. turn 3.64% and 10.57% YoY. Through the sale of some fixed assets in 2021,
depreciation expense also recorded a decrease of 27.82% to only 15 billion compared to
more than 20 billion in 2020. At the same time, distribution commercial advantage expense
has plummeted by more than 50% YoY. The decrease of all cost indicators has helped
GMD's total administrative expenses in 2021 decrease by 13.6% compared to 2020. The
better management of these expenses positively affects the net profit from operating
activities.
Other income: Expenses from inefficient investment activities made other income in
2019 of the enterprise -36 billion. In 2020, the other profit target increased impressively by
144.69% YoY, decreased by 435.02% YoY in 2021. The enterprise explained the causes of
other losses, which mainly still came from inefficient investment activities. This expense
gradually increased from 49 billion to 54 billion in 2020 and reached 92 billion in 2021.
However, 2020 still recorded another profit due to the income from Reversal of payable
provision up to 59 billion, these provisions are mainly related to the losses that the
enterprise anticipates having to compensate during the transportation process with the risk
of loss or loss of goods of the customer.
Enterprises need to better manage their investment activities so as not to incur other
losses, because for a Port-Logistics operator, risks in the transportation process are
inevitable. Provisions for annual payments are often difficult to recover enough to cover
losses from investment losses. By 2021, because of inefficient investment costs, other
income will fall to -55 billion.
13
Net income: In 2019, audited consolidated profit after tax for the year reached more
than 517 billion, lower 1,330 billion than 2018. Profit decreased because in 2018, the
company generated a profit from the transfer of a capital in CJ GMD Logistics Holdings Co.,
Ltd., CJ GMD Shipping Holdings Co., Ltd., GMD Hoa Sen Logistics and International Port
Joint Stock Company, made profit from financial activities in 2019.
In 2020, net income is more than 440 billion, decreased 29.26% YoY. The shrinking
profit came from the following factors: (1) Management expenses increased over the same
period due to the construction and completion of large projects; (2) In the first half of 2020,
the enterprise no longer recognizes financial income from the transfer of investments as in
the same period; (3) Profit from normal production and business activities decreased by
more than 76 billion; (4) Profits from joint ventures and associates decreased by more than
75 billion.
In 2021, GMD's net income will reach 720 billion, an increase of more than 233
billion compared to the same period last year. Profits improved positively thanks to: (1)
Reduction in interest expenses and corporate administration expenses; (2) Gross profit
increased by more than 195 billion dong; (3) Profit from affiliated enterprises in the
transportation segment grew strongly by more than 85 billion thanks to a favorable
business environment.
2. Common-size analysis.
With common-size analysis, the analysis team chose HAH and VOS as 2 companies
with good growth momentum in the same industry group as GMD.
Image 8: Common-size income statement 2021
It can be seen that the numbers shown by VOS are more impressive than those of the
two competitors, first of all thanks to the good management of COGS. The main reason
comes from the company's application of solutions to control costs, especially large
expenses such as repair, fuel, spare parts... to improve business results. VOS also
14
continuously signed contracts with relatively high rates for a number of dry ships and
offered a solution to effectively exploit two container ships.
In addition, compared to HAH and GMD, VOS has both a higher proportion of
financial income in the revenue structure and lower financial operating expenses because
VOS mainly invests in safe channels such as banks and exchange rate differences instead of
securities to limit risks.
When comparing GMD and HAH, two important items such as COGS and Gross
profit and Revenue from financial activities have quite similar proportions. However,
Expenses from financial activities and Enterprise cost management of HAH have
proportions of 1.68% and 4.35% respectively compared to 3.38% and 9.20% of GMD. The
reason is because GMD has a financial investment orientation in risky securities and every
year GMD allocates a large amount of goodwill while HAH does not have this expense
because the enterprise does not carry out mergers and acquisitions of other companies.
Therefore, HAH's net income/net revenue is 28.16%, slightly higher than GMD's 22.5%.
Through the comparison, it can be seen that GMD still shows the position of the
leading enterprise in the main business of Seaport - Logistics, but the financial investment
field has not yet brought profit for this enterprise.
IV. Interpret changes and structure of Assets and Capital on the Balance sheet.
1. Assets
Image 9: Vertical analysis of Assets
15
Image 10: Vertical analysis of Current assets and Non-current assets
During 2019 - 2021, GMD tended to increase the proportion of current assets and
gradually decreased the proportion of non current assets to total assets. Specifically, in 2019,
short-term assets were 11.74% and long-term assets accounted for 88.26%. Through 2020
and 2021, the proportion of short-term assets increased while long-term assets decreased by
about 2% per year. GMD mainly received cash from the divestment of long-term
investments in these two years. In addition, GMD accelerated debt collection to stabilize
cash flow and increase liquidity in the context of a volatile market. In general, the decrease
in proportion of non current assets is not significant and non current assets still account for a
large proportion, accounting for more than 80% of the total assets of the enterprise.
The increase in the proportion of current assets: mainly because of cash and cash
equivalents. In 2021, cash and cash equivalents increased by 343.45% in value compared to
2019, mainly due to the increase in bank deposits and deposits with a term of no more than
3 years; from 158.670 billion and 4 billion in 2019 respectively to 410.560 billion and 206.5
billion in 2021. The increase of this item was reasonable when both the value and the
proportion of inventory decreased, while receivables increased insignificantly, the enterprise
may have sold inventory fuel (petrol, oil) and collected cash.
Image 11: Vertical analysis of Current assets & Cash and cash equivalents
16
The decrease in the proportion of non current assets: The ratio of fixed assets in
2021 decreased by nearly 4%, while long-term investment decreased slightly by 0.12%
compared to 2019. The slight decrease in the long-term investment was due to the decrease
in the amount of capital contributed to other entities over the years (a decrease of 165.6
billion), mainly from the transfer of capital contributions at Vietnam Maritime Commercial
Joint Stock Bank. However, investment in joint ventures and associates increased
significantly (increasing by 310.7 billion) compared to 2019. Therefore, in trend analysis,
long-term investment increased by 5.63% compared to 2019. For fixed assets, it was due to
the decrease in financial leased assets (-81.3 billion) and tangible fixed assets (-110.4
billion). The main reason is due to depreciation and divestment of investments outside the
core business to focus resources on the main activities of port operations and logistics, so
the decline in fixed assets is not a bad sign. Overall, non-current assets in 2021 increased in
value, but the ratio still decreased slightly by 1,29% compared to 2019 due to the strong
increase in total assets and current assets.
Image 12: Vertical analysis of Non-current assets
Image 13: Trend analysis of Non-current assets
Compared with other enterprises in the same industry in terms of asset structure:
By the end of 2021, GMD had a large difference in asset structure compared to the other
17
two companies in the same industry. GMD’s asset structure was considered more reasonable
for developing businesses than HAH and VOS. Specifically, the cash and cash equivalents
of GMD and VOS were kept at a low weight of less than 6%, while this ratio of HAH was
high. In addition, receivables from GMD kept the lowest proportion compared to the above
two enterprises, GMD was not likely to get caught in bad debts and reduce revenue quality.
Image 14: Common size balance sheet 2021
GMD’s non current assets accounted for more than 80% while the same items HAH
and VOS only accounted for about 60%. This can be explained by GMD focusing on longterm investments, occupying 26.41%, while the remaining 2 companies kept the investment
proportion at a low level, around below 5%. This can be detrimental to GMD when fixed
assets are considered as the cushion of the business while GMD’s investments usually
carried a lot of risks. But if these investments are effective, they can provide a high return
on assets.
2. Liabilities and Equity.
Image 15: Proportion of total liabilities and
Image 16: Trend analysis of total liabilities and equity
equity
Through vertical and trend analysis, the proportion of total liabilities was more
fluctuate than that of equity in 2019-2021. Total liabilities decreased sharply (8.81% YoY)
18
in 2020 and increased again in 2021 (12.73% YoY), whereas equity increased slightly
(0.42% YoY) in 2020 then increased (6.86% YoY) in 2021. The increase in equity was due
to the increase in charter capital to 3.014 billion in 2020 through the issuance of shares
under the stock welfare program for employees. Although the increase in equity raised the
business safety, the cost of equity is higher than the cost of debt, which can make GMD's
capital use less efficient. In 2021, according to the financial report, equity continued to
increase mainly due to the sudden increase in the exchange rate difference of 192.3 billion
YoY. But the total proportion of equity decreased as total liability increased by 1.44%
mainly increased in short-term payables for other organizations and individuals (expenses
for loading and unloading, expenses for rubber plantation projects,...)
Image 17: Proportion of current liabilities and non-current liabilities
In 2019, the difference between the ratio of current liabilities and non current
liabilities was just 1.03%. Current liabilities at the end of this year increased by 264.3
billion dong, mainly because of short-term prepayment by buyers. On the other hand, for
non current liabilities, this item decreased by 166.7 billion compared to the beginning of the
year as GMD paid off loans and financial lease debts.
In 2020, current liabilities and non-current liabilities both decreased, the difference
between these two items increased to 2.55%, more than 2019. Current liabilities at the end
of the year decreased by 83.3 billion compared to the beginning of the year mainly due to a
decrease in the amount of short-term prepayment by buyers. With non current liabilities, this
item decreased by 229.8 billion dong compared to 2019, mainly in loans and long-term
financial lease debt. In 2020, GMD paid back some bank loans at BIDV, which used to
invest in Dung Quat General Port.
In 2021, current liabilities accounted for 21.12% while current assets accounted for
only 15.74%. Liabilities at the end of 2021 was 3,692 billion, up 14% compared to 2020. In
which, short-term debt was 2,268 billion dong, accounting for 61% of total debt. Short-term
loans increased by 13% to 860 billion mainly from bank loans meanwhile, long-term loans
19
decreased by 6% to 1,061 billion dong because a part of bank loans and finance lease debts
had been paid off.
The point of concern is that GMD's short-term debt has exceeded its short-term assets
(2,268 billion/1,690 billion), making the short-term ratio low. GMD had a shortage of
current assets to finance current liabilities means that GMD has a limited ability to meet
short term obligations. The fact that enterprises maintain the use of long term assets to offset
short term obligations can create an unstable capital structure and is considered detrimental
to GMD.
In general, in 2019 - 2021, the proportion of current liabilities increased while non
current liabilities decreased by 3%. This caused GMD to have an unreasonable and more
ineffective capital structure with an imbalance between liabilities and assets.
Image 18: Trend analysis of current liabilities and non-current liabilities
In 2020, current liabilities decreased mainly due to the decline of short-term
prepayment of 111.2 billion YoY. In the same direction, non current liabilities (mainly bank
loans for investment in capital contribution and Nam Hai Dinh Vu port’s project
implementation) decreased as long-term finance lease loans decreased (-13.33% YoY).
Current liabilities and non current liabilities both decreased was the reason why total
liabilities 91.19% compared to 2019. This was a positive point for GMD, showing that
GMD still had a good ability to pay debts.
In 2021, current liabilities grew strongly after a decline in 2020. Specifically, current
liabilities increased by 28.6%YoY mainly due to an increase in short-term expenses of
242.5 billion (cost of land rental, rubber plantation projects, construction...). Non-current
liabilities decreased by 70.5 billion (+4.09%) YoY due to a decrease of 76.5 billion in longterm loans as part of bank loans and finance lease debt had been paid. Although non-current
liabilities decreased, compared to the proportion of current liabilities increasing sharply, it is
not significant, so it still makes total liabilities of 2021 increase 12.73% YoY.
20
Compared with other companies in the same industry in terms of capital structure
in 2021: It can be seen that GMD and HAH are enterprises with a relatively high and safe
equity ratio, accounting for an average of 60%, nearly twice as high as VOS. This means
that the total liabilities of GMD and HAH account for a low proportion, making the cost of
capital higher than VOS, but the efficiency of capital use is not as good.
Image 19: Common size of total liabilities and equity 2021
Image 20: Common size of GMD, HAH & VOS
In general, HAH and VOS are the two businesses that have a proportion of current
assets that is 10% larger than current liabilities. Meanwhile, GMD has a lower proportion of
current assets than current liabilities, the difference is about 6%. This shows GMD's ability
to pay debts, reduce receivables and increase payables, although not positive, but at a good
level compared to the other two enterprises.
21
V. Cash flow statement analysis.
1. Interpret cash flow statement in 2019.
In 2019, enterprise was more likely to create cash owing to positive net cash flow;
the major cash-generating activity was business operations, since net cash flow from this
activity is positive, but net cash flow from other activities was negative; principal cash was
mostly utilized for financial activities.Due to the competitive nature of the seaport sector,
businesses might seek to diversify their profit sources during this era, since the main
business had not found the potential to continue increasing.
Although net cash flow in 2019 was slightly over 13 billion, it was a significant
improvement over the previous year, as net cash flow in 2018 was negative (-606 billion).
Image 21: Cash flow of operating activities 2019
The main business was showing positive signs. Enterprises actively bought more
inventory to serve main business activities. In addition, GMD had collected money from its
customers, which were OOCL Logistics, MTV Logistics GMD, GMD Shipping,... 133
billion and postponed paying expenses payable to suppliers and services outsourced such as
Mekong Logistics, Rich Mountain Trading, VKS Capital Investment, ... amount up to 211
billion. These were all positive numbers for a business because according to Notes, GMD
had not had any changes because in the trade credit policy with customers, but the
receivables were reduced, the business receives money from business activities while it
might be late to pay expenses incurred in the business process, creating more abundant
source of money for business operations.
In addition, GMD also stopped holding some trading securities and collected 57 billion.
After spending money on loan interest and CIT, net cash flow from production and business
activities in 2019 was still up to 1,057 billion (+50% YoY), 3 times more than net income
and enough to make up for the expenses of investment and financial activities.
22
Image 22: Cash flow from investing activities 2019
GMD continued to spend another 379 billion to invest in means of transport,
purchased machinery and equipment and construct works, showing that the business was
still in the process of expanding its operation scale. At the same time, GMD liquidated a
number of non-essential assets such as management equipment and tools that were no
longer in use. For investments in debt instruments and equity instruments in other entities,
expenditures were larger than receipts, leading to negative net cash flow from investing
activities of 376,608 billion, down 63% compared with the same period last year, mainly
due to the decrease of 91.98 % compared to the same period last year. This showed that
GMD's outside capital investment activities were not effective.
Image 23: Cash flow of financing activities 2019
The company issued shares in 2018, but did not issue any more until 2019. The net
cash flow from financing activities in 2019 was mainly influenced by the cash flow of the
enterprise to pay principal and pay dividends to investors. This shows that businesses tend
to repay more capital than call for new capital. This was also consistent with the
development in business activities of enterprises in 2019.
2. Interpret cash flow statement in 2020.
In 2020, businesses tended to generate cash, net cash flow reached 242 billion, an
increase of 18 times compared to 2019. The main activity of generating money was still the
main business activity and used money mainly for financing activities. In 2020, GMD's cash
flow became suitable for the business model in the maturity stage since cash flow from
Operating and Investing were positive while Financing was negative.
23
Image 24: Cash flow of operating activities 2020
In 2020, GMD received money from receivables higher than last year from GMD
Hai Phong Co., Ltd., "K" Line Logistics Company Limited - GMD, OOCL Logistic
(Vietnam) Co., Ltd. However, cash outflow to pay payables also increased, which was the
main reason leading to the net cash flow in business activities of the enterprise reaching
only 655,364 billion (-38% of YoY) but still larger compared with net income and helped
support Investment and Finance . Because of the impact of COVID19, the number of
enterprises' inventories decreased. A partial decrease in the provision of shipping services
lead to the sale of raw materials and the liquidation of spare parts, specifically raw materials
decreased from 36,852 billion to 28, 285 billion (-23% compared to the beginning of the
period); spare parts decreased by 2.9% compared to the beginning of the period.
Image 25: Cash flow from investing activities of 2020
The expansion scale of investment activities decreased compared to 2019 when the
money spent on purchasing fixed assets and other long-term assets decreased (-43.27%
YoY), businesses also sold 21,602 billion of fixed assets and other long-term assets. This
could be explained in 2020, due to the heavy impact of the Covid-19 pandemic, business
activities must be narrowed, so businesses should limit the purchase of new assets as well as
sell off other unused assets. In this year, GMD decreased capital contribution (-89% YoY)
but also increased the purchase of debt instruments from other companies (+182% YoY),
showing that the business was changing in investment strategy, strongly reducing stock
buying activities as shown in the Income Statement analysis.
24