Essays on Interest Rates, Vol. 1 docx
Bạn đang xem bản rút gọn của tài liệu. Xem và tải ngay bản đầy đủ của tài liệu tại đây (555.78 KB, 50 trang )
This PDF is a selection from an out-of-print volume from the National Bureau
of Economic Research
Volume Title: Essays on Interest Rates, Vol. 1
Volume Author/Editor: Jack M. Guttentag and Phillip Cagan, eds.
Volume Publisher: UMI
Volume ISBN: 0-87014-201-1
Volume URL: />Publication Date: 1969
Chapter Title: Interest Rates and Bank Reserves - A Reinterpretation of
the Statistical Association. Phillip Cagan
Chapter Author: Jack M. Guttentag, Phillip Cagan
Chapter URL: />Chapter pages in book: (p. 223 - 271)
6
Interest
Rates and Bank Reserves—
A
Reinterpretation of the Statistical
Association
Phillip Cagan
I. Introduction
Many studies of banking have found that reserve ratios are correlated
with interest rates; the relationship has become the centerpiece of
theoretical and econometric models of the financial sector linking the
supply of money to market developments. A currently popular inter-
pretation of the association is that banks equate the marginal ad-
vantages of additional free reserves and earning assets; the two substi-
tute for each other in bank portfolios depending upon the cost of
bonowing reserves and the rate of return on assets. Given the quantity
of unborrowed reserves provided by the monetary authorities, a rela-
tion between free reserves and interest rates helps determine the
supply of bank deposits.
That an association exists between reserves and interest rates has
long been noted in U.S. data. While the interest-rate data need no
special comment, the data on reserves do. Before 1914, the association
pertained to excess reserves (vault cash and balances with reserve
NOTE: Circulation of an earlier version of this study in 1966 elicited many comments
which were most useful in preparing this revision. I wish to thank in particular Karl
Brunner, Richard Davis, Peter Frost,Jack Guttentag, George Morrison, AnnaJacobson
Schwartz, Robert Shay and William L. Silber. The conclusions are entirely mine, of
course.
I am also indebted for supervision of the computations to Josephine Trubek and Jae
Won Lee, research assistants, and to Martha T. Jones in the data processing department,
at the National Bureau.
224
Essays on Interest Rates
agents minus required reserves); at that time there was no central bank
to create and lend reserves. Since 1914, when Federal Reserve Banks
began providing a discount window for member banks, it has pertained
to excess reserves and member-bank borrowing from Reserve Banks,
or to free reserves (excess reserves minus borrowing). The associa-
tion for both periods—before and after 1914—is similar, as will be
shown later. The explanation given for the phenomenon, however, has
turned completely around. Until the late 1930's, most studies (such as
the well-known work of Riefler[39] and Tinbergen [45] 1)assumed
that
the association reflected an effect of the reserve ratio on interest rates.
Then, following Turner's 1938 criticism [46] of Riefler's study, the
direction of influence was reversed—interest rates were thought to
affect reserve ratios. The new explanation was expressed in terms of
the marginal to banks of free reserves and other assets.
This later view has come to monopolize opinion. The Appendix to this
chapter briefly surveys empirical studies on this subject, documenting
the shift in interpretation.
Evidence on the association is examined in Section II. Section III
tests the earlier explanation and Section IV the later explanation. Both
are found to be inadequate. Finally, Section V discusses and tests
another interpretation of the association. The conclusion is that the
pursuit of short-run profits motivated bank borrowing much more
strongly in the 1920's than it did in the 1950's, but such behavior ac-
counts for little, if any, of the association in either period. The ex-
planation offered here is that bank borrowing from the Federal Reserve
increases as monetary conditions tighten, because the banks are
striving to accommodate their regular loan customers. Interest rates
appear to play a small role in the variations of deposit growth due to
changes in free reserves.
II. Interest Rates and Reserve Ratios: The Statistical Association
The association referred to above pertains mainly to short-run cyclical
movements. There have been long-run movements in the excess re-
serve (or free reserve) ratio of banks, but they reflect institutional de-
velopments or special circumstances.2 We may focus on short-run
'Bracketed numbers refer to works cited in the references following the Appendix to
this chapter.
2
Long-runmovements are discussed in my Determinants and Effects of Changes in
theMoneyStock
[7].
Interest Rates and Bank Reserves
225
movements by grouping the data according to the stages of business
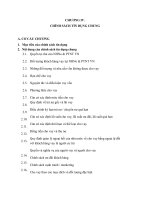
cycles. Chart 6-1 presents National Bureau reference cycle patterns of
the free reserve ratio of member banks
and the commercial paper
rate, which behaves similarly to the Treasury bill rate typically used
in this comparison. The patterns for the two series tend to move in-
versely. Although far from perfect, the association is fairly strong for
most periods. The amplitude of cyclical movements in the reserve ratio
has varied, however. They were large in the 1920's and even larger in
the 1930's, but were quite small in the 1950's. Short-term interest
rates fluctuated with roughly the same amplitude in the 1950's as they
did in the 1920's, but with a much smaller amplitude in the intervening
period. A sharp decline in the early 1930's brought short-term rates to
very low levels, where they remained with only minor changes during
that decade and most of the next.
The strongest evidence of an inverse association is provided by the
data for the 1920's, the period studied by Riefler. The period since
World War II, to which most recent studies are confined, has produced
a smaller variety of cyclical patterns and, so far, less revealing evi-
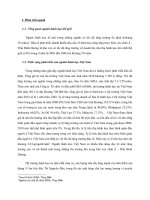
dence. The difference in the relation over time can be seen in Chart 6-2,
which presents a scatter diagram of changes from stage to stage of the
reference cycle patterns 1919—61. The chart distinguishes the three
periods discussed. The points for the middle period 1933—38 show no
correlation. Those for 19 19—33 show the strongest correlation, though
four observations in particular for that period (dated on the chart)
stand out as extremes. The points for the latest period also show a
negative correlation, but with a much flatter slope than that for the
1920's. The flatter slope reflects the smaller amplitude of fluctuation in
the free reserve ratio after World War II compared with the 1920's,
given the roughly unchanged amplitude of fluctuation in short-term
interest rates.
Although Charts 6-1 and 6-2 show little association for the 1930's
and early 1940's, that period is often cited as dramatic proof of such
an association. After 1933, banks stopped borrowing from Federal
Reserve Banks and accumulated excess reserves at a rapid pace, while
short-term interest rates fell sharply, creating a nice inverse associa-
tion between the two series for the period as a whole. The changes
Although many studies of the association do not divide reserves by deposits, it is
desirable to do so, particularly when examining data for long time periods.
Data on member-bank free reserves have been published by the Board of Governors
of the Federal Reserve System since 1929; earlier figures used here are estimates of the
National Bureau.
226
Essays on Interest Rates
CHART 6-1. Reference Cycle Patterns of Member-Bank Free Reserve Ratio
and Commercial Paper Rate, 1919—61
Free
reserve ratio (per cent)
Commercial paper rate (per cent per annum)
rate Reserve ratio
Paper rate
+6
+4
+2
0
1938-45-
1945-49-
+2
— —
0
— S.,
,__
0
+2
+2
—2 -
ii
iii
w VVt
VII
VIII IX
-2 -
0
2
0
3
2
5
4
3
2
5
4
3
2
+2
,
/
/
/
0
—2
1949-54-
S.—
1954-58
—5'
'N
1958-61-
I I I
0
,
/
/
/
SOURCE: Same as Table 6-1.
I I
Interest Rates and Bank Reserves 227
CHART 6-2. Member-Bank Free Reserve Ratio and Commercial Paper
Rate, Changes Between Reference Stages in Percentage Points
o1919-33 x1933-43
A1948-61
Reserve ratio
IC,
I
I I I I
I
I
I
I
I
I
*
A= 1919—21, stages II—
Ill
B=19I9-21,stages 1V-V
C =1927-33, stages V-VI
8
DI927-33, stages VI-Vil
0
0
7
x
6
0
4-
0
0
2-
0
1-
A
A
A
00
A
A
0
£_1
0
x
0
0
-2-
°
°
*
-3 -
K
-4-
0
—120
x
—6
I I I
I I
I
-2.0—1.8—1.6-1.4-1.2-1.0 8
6
4
—.2 0 .2
.4
.6
.8
1.0 1.2
1,4
Commercial paper rote
SOURCE:
Same as Table 6-1.
from stage to stage in Chart 6-2 hide this longer-run association during
those years.
The continuing increase in excess reserves after 1933 can be at-
tributed to a combination of two quite different influences, both of a
special nature and both difficult to quantify. The first influence reflects
the cost of investing in short-term securities, during
that decade by the lack of demand for loans and the risk of investing in
long-term securities. Banks normally profit by investing funds which,
for the time being, exceed needed working balances. To take care of
fluctuations in reserves, banks buy short-term securities for short
holding periods, as excess funds permit. At very low yields on those
228
Essays on Interest Rates
securities, however, the transaction costs (broadly interpreted) of
buying and selling may equal or exceed the return; excess funds will
then be held idle. If the break-even point for most banks were as high
as 1 per cent on Treasury bills and commercial paper, it would help
explain the sharp rise in the excess reserve ratio after 1933 when those
short-term rates fell below that level,4 even though the changes from
stage to stage in Chart 6-2 reveal no relation.
Transaction costs undoubtedly did not exceed the return on loans
and bonds, however. Beyond some moderate amount, depending upon
the circumstances of each individual bank, excess reserves are not
needed to meet expected drains. If the preceding argument were to ex-
plain an accumulation beyond that amount in the 1.930's, it would have
to be that the demand for bank loans was limited, and that bonds ap-
peared unattractive to banks at the low yields then available because
of the danger of capital losses if yields later increased. (The situation
changed in 1942 when the Federal Reserve began to support U.S.
bond prices, preventing any increase in yields while the policy con-
tinued.) This danger does not seem to have been sufficient to explain
why banks did not purchase bonds during the 1930's. After all, yields
continued to fall throughout the decade and there was little prospect of
a major rise. It cannot, however, be ruled out as a minor reason for the
accumulation of excess reserves.
A second influence on excess reserves during that period was the
shattering experience of the financial crisis which culminated in the
complete suspension of bank operations for one week in March 1933.
For many years thereafter, banks remained extremely reluctant to ac-
quire any but the highest-grade assets, which were limited in supply.
There is considerable evidence to support this interpretation.5 Banks
shifted their portfolios after 1933 toward cash and short-term earning
assets which were highly liquid and low in risk, and continued to do so
until the wartime support policy of the Reserve Banks made long-term
bonds substantially more liquid. This shift produced an unusually large
accumulation of excess reserves.
4This argument is presented and tested by Peter A. Frost [17]. This period has also
been interpreted as providing unique evidence for the existence of a "liquidity trap"
for banks (that is, a flattening of their demand curve for reserves at very low rates), on
the argument that the large increases in the ratio after the mid-1930's were accompanied
by very low, virtually constant short-term interest rates (see Horwich [24], and the
references cited therein).
It is discussed by Friedman and Schwartz [16], Chapter 9, and was stressed by me
[7]. Also see the supporting evidence presented by George R. Morrison [31], Chap-
ters 3—5.
interest Rates and Bank Reserves
229
The 1930's and 1940's wove together some very special circum-
stances, making interpretation difficult. They do not provide clear
evidence on the behavior of banks in ordinary times. Moreover, in the
1920's and 1950's the amount of excess reserves and the amplitude of
their fluctuation were usually too small to warrant our attention; most
of the fluctuation in free reserves ratios reflected borrowing from Re-
serve Banks. The subsequent analysis concentrates on the borrowing
during those two decades, though for comparison 1929—3 8 is included
in some regressions for the full period (with the two world wars ex-
cluded).
Many of the patterns in Chart 6-1 portray a standard response to
cycles in business activity—interest rates conforming positively and
the reserve ratio inversely —whichraises a question of spurious asso-
ciation. These two variables may appear to be related solely because
they both conform to business cycles. Corresponding cyclical move-
ments in two variables tempt us to infer that they are directly related,
but such evidence by itself is weak: Since many variables conform to
business cycles, cyclical movements in each of them can be attributed
to a wide variety of possible relationships. This is true of reserve ratios
and interest rates, which may display associated cyclical fluctuations
for many reasons. Changes between successive stages, as shown in
Chart 6-2, suppress the serial correlation existing in the monthly series
and make trends less prominent, but common cyclical influences of a
possibly spurious nature may still remain. One way to remove such in-
fluences is to hold the average cyclical pattern constant by means of
dummy variables. Since reference cycles have nine stages, we need
seven dummy variables, one for each of seven of the eight stage-to-
stage changes (one less than the total number to avoid overdetermining
the regression). The dummy variables represent separate constant
terms for each stage change and absorb any covariation in the other
variables which would result from a common cyclical pattern. This is
equivalent to fitting eight separate regressions with the requirement
that all of them have the same regression coefficient for the nondummy
variables.
Table 6-1 reports the correlations of stage-to-stage changes, with and
without dummy variables, for various periods. The interest series are
the main short-term rates available which appear relevant to the man-
agement of bank reserves. The atypical 1938—48 period of bond
pegging is excluded, and the very different decades following the two
world wars are shown separately. The table reveals a high negative
association, confirming earlier studies. For the much cited 1948—61
230
Essays on Interest Rates
TABLE 6-1. Correlation Between Free Reserve Ratio and Interest Rates,
Changes Between Reference Cycle Stages
Partial Correlation
Coefficient
Simple (and t
value),
Correlation Holding Common
Period, Banks, and
interest Rate
Coefficient
(and t value)
Cyclical Movements
Constant a
1874—1914 b
New
York City Clearing House Banks
Commercial paper rate
—.49(4.9) —.36(3.3)
Call money rate
—.47(4.7) —.32(2.8)
Log of call money rate c
.53(5.3)
Reserve City National Banks
Commercial paper rate
—.16(1.4) —.06(0.5)
Call money rate —.09(0.8)
—.03(0.3)
Country National Banks
Commercial paper rate —.30(2.8)
—.21(1.8)
Call money rate —.16(1.5)
1919—61,
Member Banksd
1919—61excluding 1938—48
Commercial paper rate —.58(5.8)
—.64(6.3)
Treasury bill rate
—.52(4.7) —.60(5.6)
Bankloan rate —.58(5.7)
—.57(5.3)
19 19—29
Commercial paper rate
—.86(8.7)
—.90(8.8)
Treasury bill rate
—.82(6.6)
—.87(6.9)
Bank loan rate
—.82(7.4)
—.80(5.9)
1948—61
Commercial paper rate
—.60(3.8)
—.13(0.6)
Treasury bill rate —.70(5.0)
—.34(1.6)
Bank loan rate
—.53(3.2)
—.09(0.4)
SOURCE: Excess reserve ratio. New York City Clearing House Banks (excess lawful
money reserves to net deposits): 1874—1908, A. P. Andrew, Statistics
for the United
States, 1867—1 909, National
Monetary Commission, 1910, Table 28; 1909—14, Com-
mercial and Financial Chronicle seasonally
adjusted monthly data kindly supplied by
George R. Morrison from data cards for his Liquidity
Preference of Commercial Banks
[31].
Noncentral Reserve city and country national banks (lawful money plus deposits
with reserve agents to net deposits, minus required reserve ratio): Annual Report of the
Comptroller of theCurrency, various
years, seasonally adjusted call-date data.
Free reserve ratio of member banks (excess reserves minus Federal Reserve dis-
counts and advances as ratio to demand deposits adjusted plus time deposits): NBER
estimates from data in Bankingand Monetary
Statistics and Federal Reserve Bulletin
interest Rates and Bank Reserves
231
period, however, the dummy variables reduce the correlation to in-
significance, indicating that the association then cannot be distin-
guished from a common response of the variables to business cycles.
Yet, for the 1920's the correlation remains highly significant despite
the inclusion of dummy variables, suggesting that the 1948—61 corre-
lation probably is, after all, genuine though weak. As can be seen from
Chart 6-2, the observations for the 1920's dominate the correlation for
the post-World War I period as a whole.
Before World War I, the association is strong only for banks in New
York City. One reason for its weak appearance elsewhere is that the
two interest-rate series, both compiled from New York City quota-
NOTES TO TABLE (CONTINUED)
(member bank deposits 1948—61 supplied by Board of Governors of Federal Reserve
System), seasonally adjusted monthly data.
Call money rate: January 1948—December 1961, Survey of Current Business; Febru-
ary 1936—December 1947, FRB; January 1878—January 1936, Frederick R. Macaulay,
Some Theoretical Problems Suggested by the Movements of Interest Rates, Bond
Yields and Stock Prices in the United States Since 1856, NBER, New York, 1938.
Commercial paper rate: February 1936—December 1961, computed from weekly
data in Commercial and Financial Chronicle; January 1878—January 1936, Macaulay.
Treasury bill rate: FRB. (Treasury notes and certificates to 1929, three-month bills
thereafter.)
Bank loan rate: IQ 1939—IVQ 1961, FRB; January 1928—December 1938, unpub-
lished data supplied by Board of Governors of the Federal Reserve System; January
1919—December 1927, B&MS.
Regression observations are changes between nine successive NBER reference stage
averages of monthly seasonally adjusted data.
a
Multipleregression equation (col. 2) is
Ar0 =aA
+ 6,U, + constant
where r0 is the interest rate, R,/D the reserve ratio, and U, the seven dummy variables,
one for each successive pair of reference stages except the last. The operator A denotes
changes between reference-stage averages. U, is unity if the observation pertains to that
pair of stages, otherwise zero; a and
are regression coefficients. Signs of the I
values,
which pertain to the associated regression coefficients, have been dropped.
b
Period
begins with stage change VI—Vil of 1870—79 reference cycle for New York
banks and with Vill—IX of that cycle for the other banks, and ends with Vill—IX of
1912—14 cycle.
C
Excludesseven extreme observations: 1879—85 Vil—VIlI; 1885—88 lI—Ill; 189 1—
94 VI—VIl and VI—VIlI; 1894—97 Il—Ill; and 1904—08 Vt—Vu and Vu—Vu!.
d
Periodbegins with initial trough of 1919—21 cycle or peak of 1945—49 cycle and ends
with peak of 1927—33 cycle or terminal trough of 1958—61 cycle, except that the•
Treasury series begins with 1920 peak. Exclusion refers to period from 1938 trough to
1948 peak.
232 Essays on Interest Rates
tions, were less relevant to other Reserve city and country banks.
Excess reserves of interior banks depended primarily on the local
demand for loans. When the demand was high, excess reserves were
low; and conversely. Only if the interior demand for loans and the
commercial paper or call loan rates had the same movements are the
correlations in Table 6-1 likely to be as high for the interior banks as
for those in New York City.
Although the various interest rates give similar results, the regres-
sion using call money rates in logarithmic form produces a better fit
for the earlier period (despite the exclusion of seven extreme observa-
tions which, if included, would make the correlation even higher).
The logarithmic form is justified for the earlier period by nonlinearity
at both ends of the relation: The excess reserve ratio had a lower limit
imposed by national bank reserve requirements (the banking system
could not acquire more reserves through domestic borrowing, since
there was no central bank to provide them). And, when short-term
rates were below 1 per cent, very large increases in the ratio may have
been associated with small declines in rates because, as suggested
earlier, costs of temporarily investing excess reserves may have ex-
ceeded the low return available. There is less reason for nonlinearity
in the later period. The free reserve ratio of member banks has no
practical limits (the ratio can be and usually is negative, and an upper
theoretical limit of unity or so is never approached). Also, the only
period with very low interest rates— 1933—48—has been excluded.
Since excess reserves have been quite small except for the 1930's,
any important nonlinearity would have to pertain to borrowing. A
tendency of the Federal Reserve to constrain borrowing, just when
banks want to increase it, might produce a nonlinear relationship.
Chart 6-2 gives but a slight suggestion of nonlinearity for the 1920's,
however, and none for the 1950's. To keep the analysis of the two
periods comparable, linear regressions have been used throughout.
In general, the evidence demonstrates an association between
reserve ratios and interest rates which has a long history and cannot
be dismissed as a product of common cyclical patterns. It appears to
reflect a direct relationship between the two variables.
III. Critique of the Earlier Interpretation
Many writers have pointed to the association summarized by Table
6-1, and most of those before Turner attributed it to monetary effects
Interest Rates and Bank Reserves
233
on interest rates. Although never spelled out, the basic hypothesis
was that a tight reserve position forces banks to restrict credit, and a
position of ease allows them to expand. Hence, low reserves in rela-
tion to deposits lead to high interest rates, and conversely. How the
effect on rates occurs, however, was never clarified, and suggestions of
various mechanisms can be found in the literature.
In some early writings on the association it was implied that low
reserve ratios lead the public to expect tight credit, and conversely
for high ratios. The public then takes steps which somehow produce
the expected behavior of interest rates. We may be skeptical, however,
that such expectations would be held with much regularity unless
banks did affect interest rates directly.
Tinbergen's view was that banks simply post a loan rate reflecting
their reserve position. As reserves tighten, banks post higher rates,
and conversely as reserves loosen. But this view oversimplifies bank-
ing practice in the United States and elsewhere. Such insularity from
the demand side is true in part for only a few U.S. rates (such as
consumer loan rates and the prime loan rate) and to only a limited ex-
tent for the average bank loan rate, used here. "Administrative
pricing" of bank rates cannot explain the association for commercial
paper and Treasury bill rates, which are determined on the open
market.
If reserve ratios affect market interest rates, the connection pre-
sumably occurs through the supply of loanable funds. A high growth
rate of the money stock increases the supply of loanable funds in rela-
tion to the demand, thus lowering interest rates, and conversely. The
association will carry over to the free reserve ratio, however, only
insofar as the ratio is a determinant of monetary growth, as was im-
plied by Riefler's formulation. He contended that undesired changes in
reserves resulting from open-market operations and currency or gold
flows are largely offset in the first instance by member-bank borrowing
—an
increase if banks initially lose reserves or a decrease if they gain.
By tradition as well as by Federal Reserve insistence, borrowing
should be infrequent and, when justified, temporary; member banks in
debt therefore take immediate steps to build up reserves by restricting
credit. When total borrowing rises, the banking system restricts credit
and the money market tightens. Thus, when the volume of borrowing
is high (free reserve ratio low), interest rates are high, and conversely —
reflecting
an inverse effect of the growth rate of the money stock on
interest rates.
On a theoretical level such an explanation seems plausible. On an
234
Essays on Interest Rates
empirical level, it also has merit—up to a point. An earlier study of
mine found a significant inverse effect by the rate of growth of the
money stock on interest rates [8]. And the free reserve ratio is posi-
tively correlated with the rate of deposit growth. But are these relation-
ships strong enough to account for the high association between the
reserve ratio and interest rates in Table 6-1? In the Riefler interpreta-
tion, that association is an indirect reflection of separate relations be-
tween each of the two variables and the growth rate of deposits. There-
fore, it should disappear when deposit growth is held constant. A test
of this hypothesis is reported in Table 6-2. The partial correlations
with deposit growth held constant (col. 4) are only slightly smaller
than the simple correlations of Table 6-1 (reproduced here in col. 1),
indicating that the direct association between the free reserve ratio
and interest rates far outweighs any indirect association via deposit
growth. The hypothesis fails. The statistical reason for the small
difference between columns I and 4 is that the postulated correlations
with deposit growth (cols. 2 and 3) are much weaker than the correla-
tions in column 1 which they are supposed to explain.
There is an alternative formulation of the Riefler theory. The as-
sociation between the free reserve ratio and interest rates might reflect
a relation between interest rates and the public's demand to hold
money. Earlier writers sometimes seem to have had such an explana-
tion in mind. The demand to hold money depends upon interest rates,
and a change in the money stock affects market rates as the public buys
or sells financial assets to remain on its demand curve. If the reserve
ratio were a good proxy for the total money stock, the association be-
tween the ratio and interest rates would reflect those portfolio adjust-
ments. But this formulation has serious drawbacks. First of all, the
correlations of Table 6-1 do not hold wealth or income constant, as
is required to measure the demand for money balances properly. Sec-
ondly, the reserve ratio is not consistently a good proxy for the level
of deposits, which depends mainly upon the level of reserves made
available to the banking system. Moreover, when we use the level of
deposits in Table 6-2 in place of their growth rate, the correlations
(not shown) are very similar to those presented there and also fail to
support the Riefler theory.
Of course, some effect of the kind Riefler and other earlier writers
proposed may be at work, since changes in reserve ratios affect de-
posit growth to some extent and thus affect interest rates through the
supply of loanable funds. We may conclude, however, that such effects
are not the main explanation of the high correlations in Table 6-1. We
TABLE 6-2. Correlations Between Free Reserve Ratio, Interest Rate, and Growth Rate of Deposits, Changes Between
Reference Cycle Stages
Partial Correlation
Period and
Interest Rate
Simple Correlation Coefficient
Coefficient
Free Reserve Ratio
and Interest Rate,
Holding Deposit
Growth Constant
(4)
Deposit Growth and
Free Reserve Ratio
and Interest Rate
Interest Rate Free Reserve Ratio
(1)
(2)
(3)
1919—2 9
Commercial paper rate —.86
—.31
.49 —.85
Treasury bill rate —.82
—.65
.64 —.69
1946—61
Commercial paper rate —.60
—.60
.39
—.50
Treasury bill rate —.70
—.65
.39 —.64
SOURCE: Same as Table 6-1. Deposit growth is monthly percent-
age change in member-bank demand and time deposits.
NOTE: Coverage and data are the same as corresponding cor-
relations of Table 6-1. Observations are changes between succes-
sive reference stage averages of monthly data.
The two correlations in column 3 for the earlier period are dil-
ferent only because the expansion phase of the 1919—21 cycle is
omitted for Treasury bills.
236
Essays on Interest Rates
are led to examine the main current interpretation, discussed in the
next section.
IV. Examination of the Recent Interpretation
Since the 1930's most writers have completely reversed the Riefler
interpretation. Instead of the free reserve ratio somehow influencing
interest rates, the effect is now viewed as running from rates to the
ratio. This new view, as argued above, seems justified by the evidence.
The rationale for the effect has, however, taken a particular form.
Banks are thought to adjust their reserve positions by borrowing from
Reserve Banks, primarily to maximize short-run profits. When market
rates rise, so does the income foregone by holding excess reserves
idle, intensifying the inducement to keep reserves low and to borrow
(assuming the borrowing rate does not rise commensurately). Since
borrowing accounted for most of the fluctuation in free reserves in the
1920's and 1950's, the new view as applied to those periods is mainly
a theory of borrowing. It denies Riefler's thesis that banks eschew
indebtedness and borrow only to meet temporary reserve deficiencies.
As Turner contended, banks may honor the tradition against unneces-
sary borrowing, but always with half an eye on the foregone profits.
Consequently, when market rates rise, banks make do with smaller
reserves, taking greater chances of being caught short, and so find it
necessary to borrow more often.
A DIRECT TEST OF THE PROFIT THEORY. This theory implies that after
1914 the free reserve ratio was more closely correlated with the
difference between the market and the discount rate than with the
market rate by itself, since the profit depends upon the return from
lending minus the cost of borrowing. Table 6-3 presents the partial
correlation coefficients of the free reserve or borrowing ratio with
both the interest rate and its differential over the discount rate, each as
a separate variable. For all periods, the market rates themselves
account for virtually all the association observed in the previous
tables. This is true when sectors of member banks are treated sepa-
rately (also shown), and when the period of the excess profits tax
(June 30, 1950, to December 30, 1953) is given a separate constant
term by means of a dummy variable (not shown). The results are also
the same when the 1919—21 cycle, which had unusually high levels
of borrowing and two extreme observations (see Chart 6-2), is ex-
Interest Rates and Bank Reserves
237
eluded (not shown). The short-run profit motive as represented by the
differential rate either is not significant or, when significant, has the
wrong sign (in theory the differential should affect free reserves in-
versely and borrowing positively).
The regressions using the ratio of borrowing to deposits take account
of the objection that the banks which hold most of the excess reserves
seldom borrow and may behave differently. Treating borrowing by
itself, however, gives the same results (with opposite sign), because
its cyclical variations dominate those in excess reserves (except during
the 1930's and 1940's, omitted here). The combination of time and
demand deposits in the denominator of the ratio may also raise objec-
tions, because time deposits are less subject to unexpected withdrawals
and seldom give banks cause for borrowing. Using demand deposits in-
stead of total deposits in the denominator of the ratio, however, gives
similar results (not shown). Finally, substitution of the federal funds
rate for the discount rate in the regressions also gives similar results
(not shown).6
Many studies have reported weak, though significant, negative coeffi-
cients for the differential rate, which simply reflects the correlation
of the differential with the market rate (the discount rate has less ampli-
tude of fluctuation). The correlation coefficient between the commer-
cial paper or Treasury bill rate and the corresponding differential rate
was about +.5forstage changes in the 1920's and 1950's. The bank-
loan-rate differential, on the other hand, has a positive correlation with
the free reserve ratio, because the loan rate moves sluggishly and its
differential is dominated by the discount rate. Since it gives the wrong
sign, the loan differential has understandably not been reported in
published studies.
The differential rate is clearly the relevant one for bank profits,
rather than the level of the market rate; yet the correlation is all with
the rate level. It may be argued that the differential rate is not en-
tirely appropriate for the profit theory on the grounds that informal
pressures by Federal Reserve officials to discourage banks from
borrowing have not been taken into account here. Undoubtedly
such pressures on banks vary over the cycle, and, conceivably, they
reduce the correlation shown by the differential rate. Yet, such pres-
sures probably intensify just when the profit incentive to borrow is
6
federal
funds rate is relevant here only if the reserve position of banks lending
federal funds, unlike that of borrowers, is not influenced by the funds rate. This is not
likely, but it is a possibility. Otherwise, the behavior of lenders and borrowers of federal
funds cancels out in the aggregate reserves of member banks.
238 Essays on Interest Rates
TABLE 6-3. Regression of Free Reserve or Borrowing Ratio on Interest
Rates and Their Differential Over the Discount Rate, Changes Between
Reference Cycle Stages (partial correlation coefficient and t value)
Free
ReserveRatio
and
Borrowing
Ratio
and
Rate Differential
Rate
Differential
All Member Banks
1919—61excl. 1938—48
Commercialpaper rate —.56(5.5) +.07(0.6)
Treasury bill rate
—.55(5.1)
+.24(2.0)
Bank loan rate
—.47(4.3) +.13(1.0)
1919—29
Commercial paper rate
—.85(8.0)
+.19(1.0)
+.85(8.0)
—.17(0.9)
Treasury bill rate
—.86(7.6) +.48(2.5)
+.85(7.5)
—.49(2.6)
Bank loan rate
—.74(5.6)
+.38(2.0) +.74(5.5) —.37(2.0)
1948—61
Commercial paper rate
—.48(2.7)
—.02(0.1)
+.48(2.7)
+.08(0.4)
Treasury bill rate —.53(3.2)
—.10(0.5) +.55(3.3) +.18(0.9)
Bank loan rate —.42(2.3)
+.16(0.8) +.50(2.9) —.07(0.3)
Member Banks by Sector, 1948—61
New York City
Commercial paper rate —.36(2.0) +.08(0.4)
Treasury bill rate —.37(2.0) —.02(0.1)
Bank loan rate
—.22(1.1) +.20(1.0)
Chicago
Commercial paper rate —.47(2.7) +.13(0.7)
Treasury bill rate
—.49(2.8) +.07(0.3)
Bank loan rate
—.40(2.2) +.15(0.8)
Reserve cities
Commercial paper rate
—.43(2.4) —.05(0.2)
Treasury bill rate —.49(2.8)
—.17(0.9)
Bank loan rate
—.39(2.1)
+.14(0.7)
Country
Commercial paper rate —.51(2.9) —.12(0.6)
Treasury bill rate —.57(3.5)
—.11(0.5)
Bank loan rate —.50(2.9)
+.1 1(0.6)
SOURCE: Discount rate is that of Federal Reserve Bank of New York: January 1922—
December 1961, Board of Governors of the Federal Reserve System, Annual Report,
various years, and Federal Reserve Bulletin; November 1914—December 1921, simple
averages of weighted rates on commercial, agricultural and livestock paper from FRB,
Discount Rates of the Federal Reserve Banks, 1914—21. Reserve ratios by sectors,
Federal Reserve Bulletin, monthly data seasonally adjusted by NBER. Other data are
the same as for Table 6-1.
Interest Rates and Bank Reserves
239
highest. When the discount rate is high enough to discourage borrow-
ing, persuasion is superfluous. If the pressures partially offset borrow-
ing for profit without eliminating it, the differential rate would still be
the appropriate variable. The absence of correlation in Table 6-3 sug-
gests that official persuasion effectively stifles the desire to borrow for
short-run profit. That indeed was Riefler's contention, though his ex-
planation relied on the traditional belief that borrowing was incom-
patible with sound banking, rather than on the Federal Reserve's
restraint of banks' desire to borrow when it was profitable.
There is no simple way to quantify variations in official pressures
against borrowing. We may conjecture that the pressure steps up, both
when the differential rate rises (which increases the incentive to
borrow) and when market rates rise and the credit market tightens
(for reasons to be discussed in Section V). If so, the absence in Table
6-3 of a variable representing such pressure weakens the partial cor-
relation of both independent variables; which of them is more greatly
affected is hard to judge. Nevertheless, it seems unlikely that this
omission can explain away the insignificance of the differential rate.
Certainly none of the many studies attributing an important effect to
the differential rate on borrowing contend that its importance is evident
only after taking the degree of pressure into account.7
Another objection to Table 6-3 might be that the short-run profit
incentive is represented in the regressions by the difference between
the market and discount rates, thus assuming that their regression
NOTESTO TABLE (CONTINUED)
NOTE: Regression
equations have the form:
B Rf
or =ar0+ J3(r0 —
rb) +
constant
where r0 and
are the open market and borrowing (discount) rates, B and R1 are mem-
ber-bank borrowed and free reserves, and Drnmember-bank
deposits. a and /3 are
regression coefficients. The regressions were run as first differences between reference
stages, that is, each observation is the change between successive stage averages of
monthly data.
Periods are the same as for previous tables (for Treasury bills, excluding 19 19—20
expansion stages).
Signs of the tvalues,which pertain to the associated regression coefficients, have
been dropped.
A partial exception is a series of articles by Murray Polakoff, who has argued that
borrowing is constrained beyond a certain point during periods of monetary tightness.
He suggests that the relation between the free reserve ratio and the differential rate at
such times is curvilinear. See [35], [36], and especially [37].
240 Essays on Interest Rates
coefficients have opposite signs equal in magnitude. Because of official
pressures against borrowing or a variety of other reasons, the two rates
may conceivably affect the free reserve ratio by different amounts.
If the profit theory is to be supported, however, the market rate should
have a negative effect and the discount rate a positive effect on the
ratio, since in theory they affect short-run profits in opposite direc-
tions. Table 6-4 shows that the data also fail to support this more
general formulation of the profit theory. The market rate has a negative
coefficient as required, but the discount rate tends to have a negative
TABLE 6-4. Regression of Free Reserve Ratio on Market and Discount
Rates, Changes Between Reference Cycle Stages
Partial Correlation Coefficient
Market Rate
and Period
(and t value)
Market Rate
Discount Rate
1919—29
Commercial paper
rate
—.51(3.0)
—.19(1.0)
Treasury bill rate —.48(2 5)
—.48(2.5)
Bank loan rate —.40(2.2) —.38(2.0)
1948—61
Commercial paper
rate
—.34(1.8)
.02(0.1)
Treasury bill rate —.54(3.2)
.10(0.5)
Bank loan rate —.18(0.9)
—.16(0.8)
SOURCE: Same as for Table 6-3, all member banks.
coefficient as well (reflecting its covariation with market rates). Two
of the coefficients are positive, but the very low level of significance
indicates that they do not differ statistically from zero. An increase in
the discount rate simply does not have a perceptible depressing influ-
ence on bank borrowing from Reserve Banks as is implied by the profit
theory.
The high (negative) correlation between the free reserve ratio and
market interest rates in Tables 6-3 and 6-4, and the apparent absence
of any influence by the discount rate, can be more simply explained by
long- rather than short-run profit incentives. Banks rightly concern
themselves with their position in the market over the long run and at
all times wish to accommodate the loan demand of their regular cus-
tomers; to do so when credit tightens requires selling securities,
running down excess reserves, and borrowing. (A variable to take
interest Rates and Bank Reserves
241
account of loan demand will be used in Section V.) That effect amply
accounts for the observed association in Table 6-1, and borrowing
motivated by changes in the differential rate (Table 6-3) does not con-
tribute to the explanation. The often cited correlation of the free
reserve ratio with the differential rate alone reflects the correlation
between the ratio and the market rate, and cannot be offered as evi-
dence for a short-run profit theory of bank borrowing.
If the differential rate has a measurable effect on bank behavior, it
must be found in some other way. The subsequent analysis examines
the data for such an effect.
TESTS BASED ON A DISCREPANCY BETWEEN ACTUAL AND DESIRED
RESERVES. The Effect on Deposit Growth. The preceding analysis
assumes that desired and actual free reserves are always equal,
whereas in fact they may not be. A sophisticated version of the borrow-
ing-for-profit theory, first presented by Meigs [30], distinguishes be-
tween actual and desired levels of the free reserve ratio (denoted by
.
-fl and whereDm is member-bank deposits). The desired ratio
rn
'—'rn
depends
inversely on the difference between the open-market rate
(r0) and the borrowing (discount) rate (rb):
(1)
'ii
where
4'
is
positive. The rate of change of member-bank deposits is
made proportional to the existing discrepancy between the actual and
the desired ratio:
R5'\
dT
(2)
L41
\-' 'm -'—'ml
Substituting (1) into (2), we have
dloD
dT
m
=
+
[ro —
(3)
where 'y and 4
are
positive. Hence deposit expansion is related posi-
tively to the rate differential and the free reserve ratio. Put into this
terminology, Riefler's theory would be equivalent to assuming that the
desired free reserve ratio is a constant.
Regressions based on this equation and two others, discussed sub-
sequently, are presented in Table 6-5. For purposes of measurement,
242
Essays on interest Rates
TABLE 6-5. Regression of Deposit Growth on the Rate Differential and
Other Variables, Changes Between Reference Cycle Stages
Period and
Interest Rate
Equa-
tion
Num-
ber
PartialRegression
Coefficient (andt value)
Rf
—
or
rm
— dT
"—d
(
\ dT
(1) (2)
(3)
(4)
1919—2 9
Commercial paper
rate 3
4
5
4.8(3.0)
4.6(2.8)
4.7(3.3)
6.5(0.8)
4.8(0.6)
—5.8(0.7)
—.02(1.0)
—.01(0.7)
.12(2.9)
Treasury bill rate
3
4
5
3.1(3.5)
2.2(2.7)
2.5(2.7)
—4.0(1.4)
—7.0(2.6)
—6.8(2.5)
—.03(2.9)
—.03(2.9)
—.03(2.3)
.02(0.6)
/ 922—29
Commercial paper
rate 3
4
5
4.2(2.1)
4.8(3.0)
5.2(2.9)
—6.4(1.2)
—0.3(0.1)
0.4(0.1)
.09(3.3)
.10(3.0)
.08(0.5)
Treasury bill rate
3
4
5
2.8(1.6)
3.8(2.3)
3.9(2.0)
—7.2(2.8)
—3.5(1.3)
—3.4(1.2)
.07(2.5)
.07(2.0)
.01(0.1)
1948—6/
Commercial paperrate 3
4
5
4.7(1.7)
4.4(1.5)
2.7(1.1)
—3.4(1.2)
—4.0(1.3)
—2.7(1.1)
—.06(0.9)
.27(2.6) .35(3.6)
Treasury bill rate
3
4
5
1.7(0.6)
1.5(0.5)
2.5(0.9)
—5.6(2.4)
—5.7(2.4)
—1.9(0.7)
—.05(0.9)
.25(2.0)
.32(2.7)
SOURCE: Reserve ratio and interest rates, same as for Tables 6-1 to 6-4; deposit
growth, same as Table 6-3; required reserves, based on same sources as free reserves;
unborrowed reserves, for 1919—29, high-powered money from Friedman and Schwartz
[16, Table B3], revised and extended, minusmember-bank
borrowing and currency
outside banks (equals unborrowed reserves at Federal Reserve Bank plus vault cash of
all banks), and for 1948—61, member-bank reserves at Federal Reserve Banks minus
borrowing.
NOTE: Regressions are based on text equations 3, 4, and 5, plus a constant term, not
shown. Dependent variable is monthly percentage change in member-bank demand
and time deposits, annual percentage rate. Independent variables are defined by column:
(1) free reserve ratio (ratio of member-bank free reserves to demand and time de-
posits), per cent;
(2) differential rate (commercial paper or Treasury bill rate minus discount rate),
per cent per annum;
Interest Rates and Bank Reserves
243
banks are assumed to begin to respond immediately to any discrepancy
between the actual and desired ratio, so that the average rate of deposit
growth during a given month reflects the average discrepancy in that
month. The assumption seems appropriate for monthly data, since
banks are more likely to act on the basis of their current reserve posi-
tion than on that of the previous month or quarter. Yet, while the
response begins immediately, it may not be completed within one
month, but only with time approximates a full adjustment. The regres-
sions therefore measure a continuing process of adjustment. Because
the variables are averaged for reference stages, however, and then put
into first-difference form as in previous tables to avoid spurious cor-
relation, the data reflect the average effect on deposit growth of the
discrepancy during reference stages (usually several months or more in
duration).
In regressions based on equation (3), the regression coefficients esti-
mate the effect of a 1-percentage point change in the ratio or the rate
differential on the annual percentage rate of deposit growth. The free
reserve ratio has the correct sign (and for commercial paper is highly
significant with t well above 2.0 in the earlier period), but the rate dif-
ferential is not significant and mostly has the wrong sign (it should be
positive). The regressions appear to pick up the negative effect of
monetary growth on interest rates, which hides whatever positive effect
the differential rate would have on the desired free reserve ratio and,
thence, on deposit growth.
One suggested way of isolating the latter effect is to take account of
some of the other factors determining deposit growth, since the reserve
ratio is not the only factor or even the most important one. Accordingly,
we may, following Meigs, add the growth rate of unborrowed reserves,
NOTES TO TABLE (coNTINuED)
(3) growth rate of unborrowed reserves (monthly percentage change in bank reserves
minus borrowed reserves), annual percentage rate;
(4) contribution of required reserves to growth rate of deposits —
see
footnote 8
(monthly change in ratio of member-bank required reserves to total deposits, with sign
reversed, times the ratio of deposits to unborrowed reserves), annual percentage rate.
The regressions were run as first differences between reference stages, that is, each
observation is the change between successive stage averages of monthly values of the
variables shown in table heading.
The first and last periods are the same as for previous tables (for Treasury bills
1919—29, excluding 1919—20 expansion stages). The 1922—29 period begins March 1922
with the change between stages III and IV of the 1921—24 cycle.
Signs of t value have been dropped.
244
Essays on Interest Rates
to the equation:
Dm
dT
=
+
—rbl)
+ 0
dT
' (4)
and, following Davis [1 1],8also
the contribution to deposit growth of
changes in the required reserve ratio:
/
Rq\
d
Dm1
dT
D+0r)+O
dT
dT j'
(5)
where
0 and
are positive. These two variables are added to the re-
gressions in Table 6-5. For the later period, unborrowed reserves are
8The contribution of changes in requirements may be derived as follows. By definition,
total reserves of member banks comprise required
and excess reserves Re:
or
where R1
Re —
B.
Dividing by member-bank deposits and rearranging the terms gives
DmR
R,
To derive rates of change, we may take natural logarithms and differentiate with respect
to time:
/dR1
Dm
—
Dm (
Dm
Dm (
Dm
dT=dT
+
\ dT /
+
\ dT
In this form the growth rate of deposits is the sum of three parts, the contribution of
the growth rate of unborrowed reserves and that of changes in the required and free re-
serve ratios. The factor DmIRu converts changes in the reserve ratios into units that
represent their contribution to the growth rate of deposits. (The factor can be omitted
if we deal with changes in the dollar amount of reserves rather than in ratios.)
This formulation disregards currency flows on the assumption that the Reserve Banks
supply whatever quantity of currency the public desires, offsetting entirely the effect
of currency flows on bank reserves. Otherwise, changes in the ratio of currency held by
the public to deposits affect reserves and deposit growth. The Reserve Banks have often,
though by no means always, offset changes in the currency ratio; they certainly did not
at certain crucial times like 1929—3 3. And a currency offset could not be expected at all
in the period before 1914. (In that earlier period, too, B was zero.)
While the analysis here follows current practice in ignoring currency flows, the ap-
propnateness of doing so requires further study, particularly for the earlier period.
Interest Rates and Bank Reserves
245
defined as member-bank deposits at Federal Reserve Banks less bor-
rowing. For the early 1920's, however, that definition makes no sense.
Such reserves were then negative: borrowing exceeded bank deposits
at Federal Reserve Banks, which was possible because vault cash was
an important component of bank reserves. The series used for the
1920's therefore includes the vault cash of all banks (nonmember-
bank vault cash cannot be readily excluded). This series has always
been positive but, in 1920 and 1921, it was quite small. By 1922 re-
serves held at Federal Reserve Banks had increased appreciably, and
vault cash was relatively less important. Table 6-5
thereforealso re-
ports regressions for 1922—29, to exclude the first two years of the
decade when borrowing was nearly as large as total reserves; the un-
borrowed residual was small then, and its monthly percentage changes
were volatile.
The two added variables show significant effects on deposit growth,
though for the earlier period changes in the required reserve ratioare
only important in 1919 (this year covered oniy by the commercial
paper regressions). The volatile changes in unborrowed reserves during
the early 1920's produce an apparent negative effect in the regressions
which turns positive when those years are omitted. In terms of long-
run effects, the coefficients of these last two variables should, by the
above formulation, be positive and approximately unity. They estimate
pure numbers, since the dependent variable is measured in the same
units. A continual increase in unborrowed reserves or decrease in re-
quired reserves will add to the growth rate of deposits unless con-
tinually offset by increases in the free reserve ratio.
The estimated effects of these variables in the table are all well be-
low unity, presumably because of lags. In the short run, changes in
unborrowed reserves are partly or largely unforeseen. They would
affect deposit growth gradually and only after a period of adjustment,
whereas banks can be expected to expand deposits right along with
anticipated, regular increases in unborrowed reserves. A regression
coefficient below unity for this variable therefore indicates that the
changes were not fully anticipated. (Meigs [30] suggests that the rate
of change of unborrowed reserves may also affect the desired level of
free reserves. Banks may be comfortable with a lower ratio during
periods of rapid growth in unborrowed reserves. Consequently, be-
sides the direct effect on deposit growth, a higher growth rate of re-
In the earlier period changes in the required ratio reflected shifts in deposits be-
tween reserve classes and between time and demand deposits. In the later period,
changes in legal requirements also occurred.
246
Essays on Interest Rates
serves would gradually lead to a once-and-for-all reduction in the
free reserve ratio and to a higher rate of deposit growth while the
reduction was taking place. This effect would tend to make the regres-
sion coefficient of changes in unborrowed reserves higher, however,
not lower.) The coefficient may also be less than unity insofar as the
Federal Reserve partly offsets member-bank borrowing through delib-
erate changes in unborrowed reserves; this will be discussed later.
However we interpret these regressions, the interest-rate differen-
tial gives no evidence of a positive effect on deposit growth. Regres-
sions of the form (4) and (5) or close variants are often used in studies
of banking behavior.'0 The differential rate sometimes turns out to be
significant with the correct sign, though usually the association is
weak. The only major differences between this and other studies are
the omission of data after the 1961 trough and the allowance for com-
mon cyclical patterns in the variables. Significant correlations using
data in monthly or quarterly form need not reflect a genuine relation-
ship but simply a tendency of the variables to move similarly over
business cycles in response to a variety of cyclical influences. In
Table 6-5 the common cyclical pattern in the variables has practically
been eliminated by taking changes between reference-stage averages
(dummy variables to remove any remaining common cyclical pattern
were not used), and the differential rate is either insignificant or has
the wrong sign.
These results indicate that responses of the desired free reserve
ratio to the differential rate are not strong enough to register clearly
on deposit growth. The next two subsections show why such responses
may not affect deposit growth and explore an alternative way of meas-
uring them.
The Problem of Interdependence Between Open-Market Operations
and Borrowing. Many econometric models of the monetary system do
not allow for a dependence of Federal Reserve open-market opera-
tions on member-bank borrowing. To be sure, unborrowed reserves
are usually included in equations like (4) and (5), but only to take
account of a dependence running in the other direction: Open-market
operations make reserves temporarily flush or tight, which leads some
banks to reduce or step up borrowing, as the case may be, until they
can accommodate their portfolios to the new conditions. Later, when
banks have had time to adjust to the change in reserves, the free
10
See
for example Meigs [30]; Brunner and Meltzer [4], especially Table 5; Davis
[10] and
1]; and Teigen [44]. See also Rangarajan and Severn [38], who use the market
(not the differential) rate, and conclude that it has no discernible effect on deposit growth.