Environment and Heritage Service Water Pollution Incidents and Enforcement 2004 doc
Bạn đang xem bản rút gọn của tài liệu. Xem và tải ngay bản đầy đủ của tài liệu tại đây (2.71 MB, 68 trang )
Environment and Heritage Service
Water Pollution Incidents
and Enforcement 2004
Annual Report
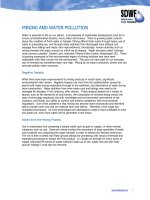
1. Sewage discharge into a watercourse
2. Milk discharging into a stream
3. Leachate entering a watercourse from illegal dumping
1.
2.
3.
Water Pollution Incidents and Enforcement 2004
Annual Report
2
www.ehsni.gov.uk
Summary
This report presents statistical information relating to water pollution
incidents throughout Northern Ireland investigated by, or on behalf of, the
Environment and Heritage Service (EHS) during 2004. EHS responded to
2207 reports of water pollution in 2004, a decrease of 13.2% from 2003. This
equates to almost 6 investigations per day. EHS substantiated (confirmed)
55.6% (1227) of the incidents reported as having an impact on water quality.
Pollution incidents are classified by Source (where the pollution originates),
Category (the type of pollution identified), Cause (why the incident occurred)
and Severity (the environmental impact of the pollution).
By Source, Industry accounted for the largest number of incidents
investigated by EHS (24.6%), followed by Farming (24.1%) and DRD Water
Service (23.6%). This is illustrated in Figure A.
By Category, Sewage (35.0%), Agriculture (24.1%) and Oil (18.5%) continued
the trend from 2003, accounting for the largest proportion of pollutant types
(77.6%). This is illustrated in Figure A.
Figure A: Distribution of substantiated
pollution incidents by Source and
Category, 2004
Water Pollution Incidents and Enforcement 2004
3
The main Causes of water pollution during 2004 were Equipment Failure
(20.6%) and Poor Working Practice (18.0%).
A total of 309 High and Medium severity incidents were investigated during
2004. This was a reduction of 9.7% compared to 2003 figures (339). Farming
was responsible for the largest proportion of High and Medium severity
incidents, (40.3%), which is an increase of 4.6% compared to last year’s figure.
EHS surpassed their target of responding to 95% of incidents assessed as High
or Medium Severity within 4 hrs, achieving a 95.8% response rate during 2004.
To date, for the incidents that occurred during 2004, EHS has issued 193
warning letters, 2 Water (NI) Order Notices and submitted 77 cases to the
Public Prosecution Service (PPS) (formerly the Office of the Director of Public
Prosecutions) with a recommendation for prosecution. To date, 25 of these
cases have been heard in the Magistrate’s Courts and all have resulted in a
conviction.
For the incidents that occurred during 2003, EHS has issued 176 warning
letters, 2 Water (NI) Order Notices and submitted 122 cases to the PPS with
a recommendation for prosecution. To date, 97 cases have been heard in
the Magistrate’s Courts, with 94.8% resulting in a successful conviction. Of
the 92 successful convictions to date for pollution incidents and consent
breaches detected during 2003, the total fines so far imposed by the courts
is £71,900.00. These fines ranged from £100.00 to £3,500.00, with an average
fine of £807.87. Of the 122 cases taken by the Department under Articles 7
and 9 of the Water (Northern Ireland) Order 1999, the Category of Agricultural
discharges accounted for 59 (48.3%) with the remaining 63 (51.7%) made
up of Breach of Consent, Chemical, Non Agricultural Waste, Oil and Sewage
discharges.
The number of cases referred to the PPS in 2003 was the highest for a number
of years and represents a 23% increase over the number of cases referred to
PPS for incidents that occurred during 2002.
The Water Pollution Hotline (0800 80 70 60), continues to be promoted
by EHS. The number of incidents reported through this service during 2004
increased by 8.9% to 836, compared to 768 in 2003.
Contents
1. Introduction 7
1.1 Background 7
1.2 Water pollution incident management 8
1.3 Structure of the WMU Regional Operations section 9
1.4 Responding to water pollution reports 13
1.5 Legislation 14
1.6 Water Pollution Hotline 15
2. Analysis Of Incidents 17
2.1 Reported Incidents 17
2.2 Regional Distribution 18
2.3 Distribution by pollution Source 19
2.4 Trend in pollution Source 21
2.5 Distribution by pollutant Category 23
2.6 Trend in pollutant Category 25
2.7 Cause of Incidents 27
2.8 Trend in incident Cause 29
2.9 Analysis of Incidents by Severity 30
2.10 Response to High and Medium Severity incidents 35
2.11 Trend in response to High and Medium Severity incidents 36
2.12 Fish Kills 37
2.13 Significance of Fish Kills 38
2.14 Trend in Fish Kills 40
2.15 Notable incidents, 2004 41
3. Pollution Prevention 43
3.1 Performance Target 43
3.2 Point Source Discharge Control 43
3.3 Diffuse Pollution Control 46
3.4 Catchment Management 46
3.5 Customer Response 47
3.6 Pollution Incidents 47
3.7 Pollution Prevention Team Contact Details 47
4 Enforcement Action 48
4.1 Introduction 48
4.2 Enforcement Policy 48
4.3 Enforcement Procedure 49
4.4 Enforcement action taken during 2004 50
4.5 Enforcement action taken during 2003 50
4.6 Trend in Enforcement Action 51
4.7 Warning Letters 52
4.8 Notices issued under the Water (Northern Ireland) Order 1999 52
4.9 Recovery of Costs 53
ANNEX A: Pollution incident assessment criteria 54
ANNEX B: Reporting water pollution incidents to EHS 55
ANNEX C: Pollution incident statistics tables 56
ANNEX D: Fines imposed under the Water (Northern Ireland) Order 1999, for pollution
incidents that occurred during the period 1/1/03 - 31/12/03 (as at 22/9/05). 61
ANNEX E: The Joint Environment Agencies’ Pollution Prevention Guidelines
and Advice Leaflets. 63
Water Pollution Incidents and Enforcement 2004
7
1. Introduction
This report presents statistical information relating to water pollution
incidents throughout Northern Ireland investigated by, or on behalf of,
Environment & Heritage Service (EHS), during 2004. Comparisons are made
with data from earlier years to allow the description of historical trends. The
data has been classified by Source (where the pollution originates), Category
(the type of pollution identified), Cause (why the incident occurred) and
Severity (the environmental impact of the pollution). This report also includes
details of enforcement action taken under the Water (Northern Ireland) Order
1999 for pollution incidents that occurred during 2003 and 2004.
1.1 Background
The Environment & Heritage Service (EHS), an Agency within the Department
of the Environment (DOE), takes the lead in advising on, and implementing,
the Government’s environmental policy and strategy in Northern Ireland.
The overall aim of EHS is to protect and conserve the natural and built
environment and to promote its appreciation for the benefit of present and
future generations. Four directorates accomplish the work of EHS: Natural
Heritage, Built Heritage, Environmental Protection and Corporate Services.
Environmental Protection seeks to safeguard the quality of air, water and
land. This involves the enforcement of legislation and a range of supporting
activities to monitor and report on discharges and emissions, to establish
the impacts of pollution, to set standards, and issue consent licences and
authorisations. Within Environmental Protection there are five discrete units
dealing with:
• Water management,
• Air quality and noise,
• Waste management,
• Industrial pollution, and
• Drinking water for public and private supplies.
Under the Water (Northern Ireland) Order 1999, the DOE has a duty to
promote the conservation of the water resources of Northern Ireland and the
cleanliness of water in waterways and underground strata. In exercising these
functions, the Department is required to have regard to:
• The needs of industry and agriculture;
• The protection of fisheries;
• The protection of public health;
• The preservation of amenity;
• The conservation of flora and fauna; and
• The conservation of geological or physiological features of special
interest, and any feature of archaeological, historical, architectural or
traditional interest.
It is the role of the Water Management Unit (WMU) of EHS to conserve,
protect and where possible improve both the freshwater and marine
aquatic environment in Northern Ireland. The WMU consists of scientific and
administrative staff located in Belfast and Lisburn, and field staff based at a
number of locations across Northern Ireland. The WMU protects the aquatic
environment through a variety of activities including:
8
www.ehsni.gov.uk
• Taking action to combat or minimise the effects of pollution;
• Monitoring of water quality;
• Preparing water quality management plans;
• Controlling effluent discharges;
• Supporting environmental research.
1.2 Water pollution incident management
In exercising its duties in relation to pollution control, the EHS’s strategic
objectives are as follows:
• To ensure the protection of water quality and abatement of pollution in
the aquatic environment.
• To control effluent discharges to waterways and underground strata
through the process of granting consents under Article 9 of the Water
(Northern Ireland) Order 1999.
To achieve these objectives, Northern Ireland is divided into nine areas for the
purposes of water pollution incident management, each area being served by
regionalised field staff, as shown in Figure 1.
Figure 1: Areas for water pollution
incident management
1
2
4
5
6
7
8
9
3
Crown Copyright 2005, Permit No. 50253
Water Pollution Incidents and Enforcement 2004
9
1.3 Structure of the WMU Regional Operations section
Under the terms of the Water (Northern Ireland) Order 1999, the EHS Water
Management Unit, Regional Operations section is responsible for taking
action to prevent or minimise the effects of polluting discharges made to
our waterways and for instigating enforcement action against polluters
where appropriate. The section operates on a 24hr, 365 days a year basis, to
co-ordinate the Agency’s response to incidents of water pollution affecting
either the freshwater or marine aquatic environment in Northern Ireland.
As indicated in Figure 2, the section is divided into five distinct teams. The
Operations Management, Pollution Prevention, Enforcement, and Resources
teams are based in our headquarters in Lisburn and the Field Staff are based
in various properties around the province.
Principal Scientific Officer
Senior Scientific Officer
Operations Management
Higher Scientific Officer
Regional Field Staff
4 EH(R)Os
5 SWQIs
23 WQIs
4 Samplers
1 PP Surveyor
7 FCB FTEs
Pollution Prevention
Higher Scientific Officer
Enforcement
Higher Scientific Officer
Resources
Higher Scientific Officer
Scientific Officer
2 x Administrative Officers
Scientific Officer
Executive Officer 1
2 x Administrative Assistants
Scientific Officer
Operations Management
The Operations Management team co-ordinates and manages the response
to reports of water pollution received by EHS. Members of the team gather
relevant information from complainants, assess the potential environmental
impact of an incident and forward incidents to field staff. The management
of incidents includes the mobilization of additional staff and resources,
communication with other Government Agencies and dealing with Press
enquiries. All Information relating to a pollution incident is logged according
to its geographical position on the Pollution Incident Logging and Tracking,
Geographical Information System (PILoT_GIS). This system records how the
team progresses the investigation and enforcement action to be taken for
each pollution incident and is regularly audited to ensure that the information
held is accurate.
SECTION 2 of this report provides information extracted from the PILoT_GIS
database relating to Water Pollution Incidents that occurred during 2004.
Figure 2: Structure of the WMU
– Regional Operations Section
10
www.ehsni.gov.uk
Pollution Prevention
The aim of the Pollution Prevention Team is to help achieve a reduction in
the number of water pollution incidents occurring in Northern Ireland. The
team carries out the following proactive initiatives to prevent incidents from
occurring or minimise the effect of pollution on the environment;
• Education of the public and industry about the effects and consequences
of pollution
• Distribution of advisory publications to the public and industry
• Offering advice at site meetings
• Promotion of good environmental practices in response to planning
consultations
• Initiating pollution prevention programmes
• Involvement in relevant working parties.
SECTION 3 of this report further details the work of the Pollution Prevention
Team during 2004.
Enforcement
Where pollution occurs it is the policy of the EHS to take formal enforcement
action, if this is warranted by the severity of the pollution and the
circumstances which led to it occurring. Water Pollution incidents are
investigated and then submitted to the Enforcement team for a decision
on the appropriate course of action to take. This can be the issuing of an
enforcement warning letter, an enforcement notice or the instigation of
prosecution proceedings. In cases where it is decided that prosecution is
appropriate, EHS staff collect the necessary evidence and prepare a file which
is submitted to the Public Prosecution Service (formerly the Office of the
Director of Public Prosecutions) with a recommendation for prosecution.
SECTION 4 of this report further details the work of the Enforcement Team
during 2004.
Resources
The Resources team maintains a stockpile of specialist equipment that can be
deployed to carry out clean up operations following water pollution incidents
occuring in either the freshwater or marine aquatic environment. The team
co-ordinates the training programmes for all staff in the Regional Operations
Section. It also co-ordinates the assessments, by field staff, of pesticide stores
under the British Agrochemical Store Inspection Scheme (BASIS).
Field Staff
At present EHS, WMU relies on the purchase of external services to fulfil
its statutory responsibilities under UK and EU legislation. The field service
is composed of approximately 49 field staff from six service providers (4
Group Environmental Health Committees, Fisheries Conservancy Board and
Loughs Agency (until May 2004)) who undertake a wide range of duties from
pollution investigation to sampling.
Water Pollution Incidents and Enforcement 2004
11
Group Environmental Health Staff
Each of the nine water pollution management areas has an Environmental
Health (Rivers) Officer (EHRO) or Senior Water Quality Inspector (SWQI) and
a number of Water Quality Inspectors (WQIs). The EHROs, SWQIs and WQIs
act as field agents on behalf of EHS. A number of sampling staff are also
employed over the summer period to sample and monitor the bathing waters
around Northern Ireland.
There are currently 37 staff employed in this section of the field staff.
The main activities of Group Staff are:
• Pollution investigation;
• Collating evidence of pollution offences and preparation of prosecution
files under the Water (Northern Ireland) Order 1999;
• Initiation and supervision of clean-up work following certain pollution
incidents;
• Carrying out pollution prevention advisory visits to industry;
• Sampling effluents from consented Industrial sites;
• Making recommendations on applications for discharge consents in
respect of domestic and trade premises.
The Fisheries Conservancy Board (FCB) and the Loughs Agency (LA) also
undertake pollution operations (mainly from agricultural sources) on behalf of
EHS, in the areas shown in Figure 3.
Fisheries Conservancy Board (FCB)
FCB was established in 1966 as a Non Departmental Public Body (NDPB)
responsible for the application of the Fisheries Act (Northern Ireland)
1966. FCB’s role is primarily the enforcement of statutory provisions in
respect of salmon and inland fisheries, and also pollution control. FCB’s
parent Department, the Department of Culture, Arts and Leisure (DCAL), is
responsible for fisheries policy and legislation.
FCB has a permanent staff of approximately 29 with about 7 full time
equivalents (FTE’s) being involved in work on behalf of EHS.
The main activities of FCB are:
• River quality sampling on behalf of EHS;
• Pollution investigation and prevention on behalf of EHS; and
• Preparation of prosecution files under the Water (Northern Ireland)
Order 1999 on behalf of EHS;
• Patrolling rivers and freshwater fisheries to enforce legislation, including
angling and commercial fishing licensing provisions;
• Providing a bailiffing service on the DCAL public angling estate;
• Providing an assessment for authorities on developments, such as water
abstraction, drainage schemes etc. which may have an impact on fishery
interests;
• Prosecuting persons in relation to offences under the Fisheries Act and
subsequent amendments;
12
www.ehsni.gov.uk
Loughs Agency (LA)
LA is part of the Foyle, Carlingford and Irish Lights Commission (FCILC) which
was set up in 1999 with the enactment of the North / South Co-operation
(Implementation Bodies) (Northern Ireland) Order 1999. The Agency’s
predecessor, the Foyle Fisheries Commission (FFC), was established in 1952
with the enactment of the Foyle Fisheries Act (Northern Ireland) 1952. FCILC
has cross border jurisdiction made possible by parallel legislation in the
Republic of Ireland (ROI). As a result, FCILC has two parent Departments,
DARD and the Department of the Marine (ROI). Each Department is required
under its respective Act to appoint Commissioners from within the parent
Department to jointly oversee the management of FCILC.
LA has a staff of approximately 43 with around 5 full time equivalents (FTE’s)
undertaking work on behalf of EHS.
The main activities of LA are:
• River quality sampling on behalf of EHS;
• Pollution investigation and prevention on behalf of EHS; and
• Preparation of prosecution files under the Water (Northern Ireland)
Order 1999 on behalf of EHS;
• Patrolling rivers, Lough Foyle and sea areas of the Foyle system to enforce
fishery regulations and to prevent illegal or unlicensed fishing. (Under the
new administration these powers have been extended to the Carlingford
Lough system);
• Monitoring salmon numbers and regulating fishing to generate the
maximum sustainable yield;
• Issuing licences for angling and commercial fishing, receiving catch
returns and monitoring salmon purchases;
• Providing an assessment for authorities on developments, such as water
abstraction, drainage schemes etc. which may have an impact on the
Foyle and Carlingford Lough fisheries;
• Prosecuting persons in relation to offences under the Foyle Fisheries Act
of 1952 and subsequent amendments;
Figure 3: Operational areas for Fisheries
Conservancy Board (FCB) and Loughs
Agency (LA)
Crown Copyright 2005, Permit No. 50253
Water Pollution Incidents and Enforcement 2004
13
Following recommendations by the Northern Ireland Audit Office and the
NI Public Accounts Committee with respect to the provision of field staff
it was agreed that the service should be brought ‘in-house’. As part of this
process WMU withdrew from using the services of the Loughs Agency on
31 May 2004. Additional funding was made available to the Western Group
Environmental Health Committee to undertake the work formerly undertaken
by the Loughs Agency on behalf of WMU.
1.4 Responding to water pollution reports
Pollution incident investigations are initiated following a report of pollution,
which may come from a number of sources. In most cases reports are either
made by members of the public or are discovered by field staff working
on behalf of EHS. During 2004, as in previous years, EHS used the pollution
incident assessment criteria as described in ANNEX A, where incidents are
classified by Severity (High, Medium and Low). This assessment is used in
order to standardise the classification, recording, and analysis of pollution
incidents across Northern Ireland.
EHS has set targets for responding to pollution incidents based on their
assessed Severity, and these are routinely monitored as a performance
measure. When a report of pollution is received, WMU aims to assess and
estimate the incident Severity, (based on the information contained with the
pollution report) and forward the incident to field staff within 30 mins. The
field staff aim to respond to incidents initially assessed as High or Medium
Severity within 4 hrs and Low Severity incidents within 1 working day. Table
16 and Figure 23 detail the rate of response to High and Medium Severity
incidents during 2004.
Once a pollution incident has been forwarded to Field Staff, they aim to:
• Confirm that pollution is occurring (substantiate)
• Locate the Source, Category, Severity and Cause of pollution
• Identify the polluter and, if appropriate, collect sufficient evidence to
secure a prosecution;
• Secure from a polluter the necessary remedial action to prevent the
continuation or the repetition of pollution;
• Recover costs, where possible, from the polluter.
The rate of substantiation can be affected by any delay in reporting by the
public, the quality of information contained in a report, the diverse and
intermittent nature of some discharges, and the response time by our staff.
Although each report of water pollution is investigated and every effort is
made to substantiate the incident (confirm that pollution has occurred), in
many cases reports remain unsubstantiated. In order to increase the rate of
substantiation, a number of points have been highlighted in ANNEX B, which
should be referred before making a report of pollution.
14
www.ehsni.gov.uk
1.5 Legislation
As previously stated, EHS has a duty to conserve, protect and where possible
improve both the freshwater and marine aquatic environment in Northern
Ireland.Under the terms of the Water (Northern Ireland) Order 1999, it is an
offence to cause pollution of a waterway or groundwater. In particular:
Article 7 (1) of the Order deals with the main pollution offence and states
that;
‘a person commits an offence if, whether knowingly or otherwise he
discharges or deposits any poisonous, noxious or polluting matter so that
it enters a waterway or water contained in an underground strata’.
Article 9 (1) states that;
‘no person shall, without the consent of the Department, make any
discharge into a waterway or underground stratum: (a) of any trade or
sewage effluent; or (b) of any poisonous, noxious or polluting matter’
Article 9 (4);
Under this Article it is an offence for any person to contravene the
conditions of any discharge consent.
Anyone who contravenes any of these Articles can, if convicted in a
Magistrate’s Court, be imprisoned for up to 3 months and / or be fined up to
£20,000.
Enforcement Policy
Where pollution occurs it is the policy of the EHS, to take formal enforcement
action, if this is warranted by the severity of the pollution and the
circumstances which led to it occurring. In deciding what, if any, enforcement
action to take in each case, EHS aims to ensure that that enforcement action
is:
• Consistent with the enforcement action taken in other cases;
• Proportionate to the risks the incident has posed to the environment and
the seriousness of the breach of the law; and
• Transparent, in that those being regulated know what is expected of
them and the public have confidence in the enforcement process.
The formal enforcement options available to EHS in pollution cases are:
• the issuing of an enforcement warning letter, and/or;
• the issuing of a Water Order Notice, or;
• the instigation of prosecution proceedings
Enforcement Procedure
In cases where it is believed by EHS that prosecution is appropriate, EHS
staff prepare a file of evidence, which is submitted to the Public Prosecution
Service (formerly the Office of the Director of Public Prosecutions) with a
recommendation for prosecution. The Public Prosecution Service (PPS) makes
Water Pollution Incidents and Enforcement 2004
15
the final decision on whether to proceed with each prosecution, taking into
account whether they believe there is sufficient evidence that an offence has
been committed and whether a prosecution is in the public interest. EHS
has an excellent record with the PPS; in that of the 122 draft prosecution files
submitted to PPS for pollution incidents which occurred during 2003, PPS
concurred with EHS’s assessment and proceeded with a prosecution in every
case.
Where a prosecution results in a successful conviction in court, the court
will normally award costs against the offender for the expenses incurred in
serving the summons, and in the taking and analysis of samples. A court
may also order that compensation be paid if the pollution has caused a fish
kill, or if other costs have been incurred in making good the environmental
damage caused by the incident. In line with the “polluter pays” principle, it is
EHS policy that, where possible, such costs will always be recovered from the
polluter.
SECTION 4 and ANNEX D of this report provide further details of the
enforcement action carried out by EHS during 2004.
1.6 Water Pollution Hotline
To encourage the reporting of incidents, EHS operates a freefone pollution
response system that is available to the public at all times. During office
hours, all calls made to the WATER POLLUTION HOTLINE, (0800 80 70 60) are
directed to an operations room in Lisburn, where the incident is assessed and
passed to the relevant field staff. Out of office hours, all calls are directed to
an Environment Agency (EA) Communications Centre in Reading, who task
the On-Call Duty Emergency Pollution Officer (DEPO) in Northern Ireland to
respond.
There have been difficulties receiving calls to the hotline number made
from mobile phones, where in some cases the calls have been diverted to
Scottish Environmental Protection Agency (SEPA), or EA offices other than
Reading. EHS is actively addressing the problems associated with calls made
to the Water Pollution Hotline from mobile phones. This has been identified
as a network problem associated with directing calls to a number used
throughout the UK and although BT has been contacted regarding this issue,
there is no short term solution. As an interim measure all staff in SEPA and
EA offices have been provided with procedures for contacting EHS staff in NI.
Until this issue can be resolved, EHS suggest that, where possible, a landline
is used to call the Water Pollution Hotline, as it is free and will ensure calls are
received by the DEPO.
Table 1 details the number of reports of water pollution received by EHS
during the period 1999 - 2004. This indicates that the total number of reports
made has decreased since 1999, however there has been a steady increase in
the number of reports made to the freefone Water Pollution Hotline (WPH)
since its inception in 1998. This is balanced by the decreased number of
reports made directly to EHS, regional field staff, FCB and LA offices and is
likely to be due to the promotion of the freefone WPH.
16
www.ehsni.gov.uk
The Water Pollution Hotline is promoted through advertisement in telephone
directories and on websites, and by business cards, posters and key fobs that
are distributed at public events. Figure 4 illustrates the Water Pollution Hotline
business cards, posters and key fobs that are available on request from the
Regional Operations Section by:
Tel: (028) 9262 3239
Fax: (028) 9262 3011
E-mail:
Water pollution reports received by:
Year
WPH
(Normal
Hours)
WPH (After
Hours)
Total
WPH
EHS direct
(Normal
Hours)
Regional Offices
direct (Normal
Hours)
FCB / LA
direct
(Normal
Hours)
Total
reports
received
by EHS
1999 0* 234 234 577 1103 497 2411
2000 195 235 430 581 1119 458 2588
2001 436 279 715 333 1034 452 2534
2002 436 292 728 277 1039 419 2463
2003 476 292 768 358 977 396 2499
2004 552 284 836 324 787 260 2207
Table 1: Reports of water pollution
received by EHS, 1999 - 2004
*EHS provided a service for reporting pollution incidents prior to the launch of the Freefone Water Pollution Hotline in 1998
Figure 4: Water Pollution Hotline
promotional material
Water Pollution Incidents and Enforcement 2004
17
2. Analysis Of Incidents
This report presents statistical information relating to water pollution
incidents throughout Northern Ireland investigated by, or on behalf of, EHS,
during 2004. Comparisons are made with data from earlier years to allow the
description of historical trends. The data has been classified by Source (where
the pollution originates), Category (the type of pollution identified), Severity
(the environmental impact of the pollution) and Cause (why the incident
occurred).
2.1 Reported Incidents
During 2004 a total of 2207 pollution incidents were reported to EHS, a
decrease of 13.2% from 2003. Of these, 1227 (55.6%) were substantiated.
Table 2 details the breakdown of total, substantiated and unsubstantiated
incidents from 1999 to 2004 (Figure 5 illustrates this graphically).
Unless otherwise stated the remainder of this report is based on
substantiated incidents only.
1999 2000 2001 2002 2003 2004
Substantiated 1506 1705 1561 1517 1552 1227
Unsubstantiated 905 883 973 946 947 980
Total 2411 2588 2534 2463 2499 2207
Table 2 & Figure 5: Substantiated
and Unsubstantiated water pollution
incidents, 1999-2004
Year
18
www.ehsni.gov.uk
2.2 Regional Distribution
Northern Ireland is divided into nine areas for the purposes of water pollution
incident management (Figure 1). Figure 6 illustrates the regional distribution
of pollution incidents during 2004. The greatest number of pollution incidents
were recorded in Area 6 and lowest number in Area 8. This is a change from
the previous year when the majority of incidents were recorded in Area 1.
The number of substantiated incidents recorded for each region from 1999 to
2004, are detailed in ANNEX C, Table 1.
Figure 6: Regional distribution of
incidents, 2004
Area
Water Pollution Incidents and Enforcement 2004
19
2.3 Distribution by pollution Source
EHS aims to identify the Source of any pollution reported. The Source of
pollution is recorded using six descriptors: Farm, Industry, Water Service,
Domestic, Transport and Other. “Other” Sources include incidents where
the Source was not determined. Table 3 details the distribution of pollution
incidents by Source for 2004 and this is illustrated in Figure 7.
Source Substantiated Incidents As a % of the total
Industry 302 24.7%
Farm 296 24.1%
Water Service 289 23.5%
Other 154 12.6%
Domestic 149 12.1%
Transport 37 3.0%
Total 1227 100%
Table 3 & Figure 7:
Water pollution Sources, 2004
By Source, Industry (24.6%) accounted for the largest number of substantiated
incidents investigated by EHS during 2004, followed by Farming (24.1%) and
DRD Water Service (23.6%).
20
www.ehsni.gov.uk
Table 4 details the regional distribution of pollution incidents by Source
for 2004. Figure 8 illustrates how pollution Sources vary across NI due to
population density and the type of industry present. In highly populated
regions, i.e. Areas 5 and 6, DRD Water Service account for the largest
proportion of incidents, however in more rural regions, i.e. Areas 1 and 2 there
are a greater proportion of Farming incidents.
Source
Area Industry Farm
Water
Service
Domestic Transport Other Total
1 45 51 45 20 3 21 185
2 20 39 16 8 5 12 100
3 52 37 24 13 9 19 154
4 50 16 41 32 2 22 163
5 17 27 81 24 0 9 158
6 49 42 57 27 7 36 218
7 26 25 5 10 3 11 80
8 17 27 5 5 1 13 68
9 026 32 15 10 7 11 101
Total 302 296 289 149 37 154 1227
Table 4 & Figure 8:
Regional distribution of
incidents by Source, 2004
Area
Water Pollution Incidents and Enforcement 2004
21
2.4 Trend in pollution Source
Table 5 details the percentage change in pollution Source from 2003 – 2004
and this is illustrated graphically in Figure 9. It is encouraging to note a
decrease in pollution from Domestic (-3.1%) and Farm (-0.4%) Sources during
2004, however Farming remains a major source of pollution. Unfortunately
there has been a 2.9% increase in pollution attributed to Industrial Sources
during 2004.
There was no change noted in percentage of incidents attributed to DRD
Water Service during 2004. Reports of pollution attributable to DRD Water
Service are initially assessed by EHS and then forwarded to DRD Water Service
for action and to the EHS Water Service Regulation Team who monitor the
situation and progress. This team also monitors and regulates DRD Water
Service discharges by reporting compliance with registered standards and
issuing advisory letters that formally identify unsatisfactory performance and
request improvements.
Source 2003 2004 Change
Industry 21.7% 24.6% 2.9%
Transport 2.5% 3.0% 0.5%
Water Service 23.5% 23.6% 0.1%
Other 12.7% 12.6% -0.1%
Farm 24.5% 24.1% -0.4%
Domestic 15.2% 12.1% -3.1%
Table 5 & Figure 9:
Percentage change in
pollution Source, 2003-2004
22
www.ehsni.gov.uk
The number of substantiated incidents attributed to each Source for the
period 1999 - 2004, is shown in Figure 10 (ANNEX C, Table 2). Industry,
Farming and DRD Water Service have continued to be the major Sources of
pollution, however incidents from these sectors have reduced over the 6
year period. In order to further reduce pollution from Farm Sources, EHS will
work constructively with farmers to implement the SSAFO (Silage, Slurry and
Agricultural Fuel Oil) Regulations. In addition to this, the whole of Northern
Ireland will be designated a Nitrate Vulnerable Zone early in 2006. It is
expected that EHS, DARD and relevant agricultural organisations will work
together to develop a Nutrient Management Action Plan which will control
the amount of nutrients that are discharged into the aquatic environment.
Figure 10: Trend in pollution Source,
1999 – 2004
Area
Water Pollution Incidents and Enforcement 2004
23
2.5 Distribution by pollutant Category
EHS aims to identify the Category (type) of any pollution reported. Pollutant
Categories are recorded using 7 descriptors: Chemical, Agriculture, Sewage,
Oil, Non Agricultural Waste Discharge, Breach of Consent, and Other. “Other”
categories include incidents where the Category was not determined. The
distribution of pollution incidents by Category for 2004 is detailed in Table 6
and illustrated in Figure 11.
Category Substantiated Incidents As a % of the total
Sewage 429 35.0%
Agriculture 296 24.1%
Oil 227 18.5%
Other 128 10.4%
Non Agric. Waste Dis. 87 7.1%
Chemical 34 2.8%
Breach Of Consent 26 2.1%
Total 1227 100%
During 2004, Sewage (35.0%), Agriculture (24.1%) and Oil (18.5%) continued
the trend from 2003, accounting for the largest proportion of pollutant types,
(77.6%). It is expected that through implementation of the Nitrates Directive
and Urban Waste Water Treatment Regulations (Northern Ireland) 1995, that
these figures will be reduced over coming years.
Table 6 & Figure 11:
Categories of water pollution, 2004