Study of Water Pollution and Bottom Mud Elution of Koya Pond
Bạn đang xem bản rút gọn của tài liệu. Xem và tải ngay bản đầy đủ của tài liệu tại đây (319.37 KB, 15 trang )
Journal of Water and Environment Technology, Vol. 7, No. 4, 2009
Study of Water Pollution and Bottom Mud Elution of
Koya Pond
Yasuhiko WADA*, Yasuhiro HEIKE* and Nariaki WADA**
* Civil & Environmental Engineering, Faculty of Engineering, Kansai University, Yamate
3-3-35, Suita, Osaka, 564-8680, JAPAN (E-mail: )
** Graduate School of Engineering, Kobe University, 1-1, Rokkodai, Nada-ku, Kobe
657-8501, JAPAN
ABSTRACT
To resolve problems of water reservoirs such as deterioration of scenic beauty, reduction in
aquatic organisms, and odors resulting from advanced nutrient enrichment, and to promote
activation of multiple functions of water reservoirs, we carried out field investigations of
water quality and bottom mud at Koya Pond, where dredging work was performed as a
water quality improvement measure. We attempted to calculate the elusion rate of nutrient
salts from bottom mud using a simulated in situ method. Results showed that water
pollution is considerable during summer, and that pollution occurs even after dredging, the
COD is high at water temperatures greater than 30°C, and T-N and T-P are high at water
temperature around 25°C under anaerobic conditions because the elusion of bottom mud is
considered to be great. The elusion rate of T-N under aerobic conditions is 1.12–1.33 times
higher than that under anaerobic condition, and elusion rate of T-P under anaerobic
conditions is 3.01–7.73 times higher than that under aerobic conditions.
Keywords: dredging effects, nutrient enrichment, elusion rate, nutrient salts, bottom mud,
water quality
INTRODUCTION
For their use as valuable waterfront in urban areas, utilization of multiple functions of
water reservoirs has been cited. For the utilization of multiple functions of water reservoirs,
municipal governments have established diversified conservation plans. However, as one
problem that hinders development of multiple functions, water pollution caused by nutrient
enrichment is mentioned. Koya Pond, which we investigate in this study, suffers from water
pollution because the pond is a place of contact of people with wild birds. People routinely feed
birds there. Simultaneous pursuit for protection of wild birds, contact with them, and
conservation of water quality poses an important but complex problem. Studies presented so far
have undertaken analyses of water quality1),2),3) and bottom mud of lakes and marshes4),5),6),7),
cleaning measures8),9),10), and calculation of inflow and outflow loads11),12),13). However, none
have brought meaningful improvements of water quality environments, suggesting that further
investigations are required. Since the causes of nutrient enrichment of ponds, lakes, and marshes
are widespread, it is hardly possible to improve water quality using a single measure. In recent
years, dredging has been attempted in some cases as a measure used in closed water areas where
nutrient enrichment is promoted. Although studies on the effects of cleaning after dredging on
water quality have been disclosed, many dredging works were performed for limited water areas
but not covering the entire water area. Few reports describe cases in which the whole pond is
dredged and assessments are then made. An argument exists regarding the effects of dredging
on cleaning: its effects can not be appreciated unconditionally. For that reason, further
investigations are necessary14).
Address correspondence to Yasuhiko WADA , Civil & Environmental Engineering, Faculty of
Engineering, Kansai University, E-mail:
Received September 16, 2008, Accepted July 16, 2009.
- 225 -
Journal of Water and Environment Technology, Vol. 7, No. 4, 2009
For the current study, a field investigation was carried out at Koya Pond, where dredging
was performed throughout the pond, water quality was evaluated,bottom mud samples were
taken, and the degree of pollution of water and bottom mud was identified after dredging.
Elusion tests were carried out to identify the influences of polluted bottom mud on water quality
and water quality improvement effects after dredging were also studied.
MATERIALS AND METHODS
Outline of the target area9)
The current study specifically examines Koya Pond, situated in Itami City, Hyougo
prefecture. The outline of Koya Pond park is presented in Table 1. Koya Pond has an area of
about 9.9 ha and boundary length of about 1.6 km. It is used by residents as a place of recreation
and relaxation. It is well known as one of the greatest wintering spots of migrating birds in the
Table 1 Outline of Koya Pond park
27.8 ha
Opened 1968
Natural pond, Water storage pond, Feeding
Primary
pond, Insectary, Tree area, Grassy plaza,
facilities
Multi-purpose plaza, Strolling road, etc.
Japanese island type
Water area
About 7.9 ha*
Island
(1.4 ha*)
About 100,000 Water
Average 1.29 m*
Pond capacity
m3*
depth
Purpose of
Irrigation water, Water control, Access to water
(Maintaining ecology, Landscaping)
utilization
* Pond water height: Set to T.P. + 24.6 m
(Control water level)
Kansai district. The vicinity is designated as a wildlife sanctuary.
Deterioration of water quality was noticed from the late 1970s to the early 1980s. At
present, nutrient enrichment is accelerated, as represented by mass generation of blue-green
algae in summer. Water pollution poses a problem.
Park area
Causes for contamination of Koya Pond
At present, Koya Pond is a closed water area with no river system flowing into it. The
problem arises when water in the pond is not circulated sufficiently. Well water is supplied to
the pond to ensure that it is filled; the water contains nutrient salts such as nitrogen and
phosphorus. In addition, food given to water birds and the birds’ excrement are deposited there.
The nutrient salts eluted from these materials contribute to the proliferation of phytoplankton
such as blue-green algae. The vicious cycle is repeated in the sense that these materials settled at
the bottom of the pond, mud is deposited, and nutrient salts are eluted again from the sludge15).
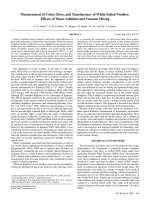
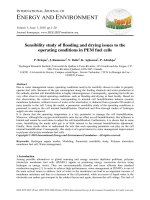
Figure 1 illustrates the causes for the pollution of Koya Pond. Sakata et al.16) point out that great
cormorants formed a large colony on an artificial island in the pond. Thereby, a large quantity
of nitrogen and phosphorus were brought into the island via their excrement, which is entirely
responsible for the deterioration of the pond’s water quality. As described above, factors for
deterioration of the Koya Pond water quality have become complex and are more aggravated
than ever before.
Measures for water quality purification of Koya Pond
- 226 -
Journal of Water and Environment Technology, Vol. 7, No. 4, 2009
Water pollution has been exacerbated continually in Koya Pond; moreover, the loads from
various pollution sources, as presented in Fig. 1, are complexly related. Regarding anti-nutrient
Excrement and
remains of
dead birds
Well water
Generation
Phytoplankton
such as bluegreen algae
Nutrient salts
(nitrogen and
phosphorus)
Vicious cycle
Soil particles
and organic
matter
Sedimentation
Elution
Polluted
sludge on
pond bottom
Fig. 1 Causes of contamination of Koya Pond
enrichment, various measures have been taken for water quality purification in the Koya Pond.
Table 2 lists down the water quality purification measures carried out in Koya Pond.
Table 2 Water quality purification measures carried out at Koya Pond (As of fiscal 2007)
Fiscal year
Remarks
Fiscal 1998* Maintenance of feeding pond
Fiscal 1999
Re-maintenance of water channel of grassy plaza
Fiscal 2000
Maintenance of bank protection, Feeding pond ~ Matsugaoka entrance
Fiscal 2001
Maintenance of water channel along the Koya Pond center
Fiscal 2002
Maintenance of bank protection, Matsugaoka entrance ~ Shallow well
Fiscal 2003
Re-maintenance of water channel along insectary
Fiscal 2004
Re-maintenance of water channel along insectary
Fiscal 2005
Dredging work (Entire water area)
Fiscal 2006
Drilling of new shallow well and maintenance of water channel
*1998.4.1~1999.3.31
Since the opening of Koya Pond Park, excrement and bait residues of water birds have been
accumulating at the bottom of the pond, thereby creating sludge. In 1995, Itami City performed
a survey to verify the floating mud thickness. Results showed that the general distribution of
thickness of the floating mud is 0.0–0.4 m at the north of the island in the pond, and about
0.4–0.6 m at south and east of the island in the pond, except for the observation bridge for wild
birds and the edge of the pond. Overall, it was estimated that the amount of sedimentary mud in
the pond was 30,000 m3 17). Furthermore, because no firm bottom is known, dredging of the
pond is not possible. Subsequently, nutrient enrichment of the pond water promotes generation
of blue-green algae during summer. As countermeasures, reeds and water hyacinths, which
support and improve water purification functions, were planted along the bank to protect the
pond and induce natural purification. Water from the well that is used for filling the pond
contains nitrogen and phosphorus. Therefore, direct supply to the pond should be avoided. A
small stream, with a gravel purification device provided upstream, was installed. A plant
purification device commonly used as a biotope is provided downstream for well water filtration.
- 227 -
Journal of Water and Environment Technology, Vol. 7, No. 4, 2009
A partition dam is provided at the boundary of the park pond to make it independent as a
feeding pond so that food given to birds might not spread throughout the pond bottom18).
As a Koya Pond purification measure, a full-scale dredging plan covering sediment mud
that is responsible for water quality pollution was established; substantial removal was started
from the 1st of July 2004 and completed at the 1st of September 2005.
Outline of bottom mud dredging
Dredging was performed from the 1st of July ,2004 to the 1st of September ,2005. The
depth dredged was 44 cm on the average (nominal average 35 cm) and the total amount of
polluted sludge dredged was 32,398 m3 (nominal value 30,000 m3). This work is unique in the
sense that all water was dredged thoroughly, although the depth of dredging is deeper at the
south of the pond, where much floating mud exists.
The constraint was that draining of the pond water was not possible so to promote dredging,
a combination of a barge and a mud pumping backhoe was used to improve the working
efficiency and to keep the planned schedule steadily. In addition, a vacuum suction and
pressurized feeding system was adopted to suppress odors and turbidity and to eliminate their
influences on water birds and irrigation water. The dredged bottom mud was processed through
recycling and a high-pressure thin-layer dehydration system. The dehydrated cake that resulted
from processing (17,300 m3) was recycled as a filling material for green spaces.
Outline of investigation
Field investigations of Koya Pond were undertaken twice a month from July to November
2007. Investigations were made during fine weather. Field investigations included water
sampling and water level measurement at the natural pond and feeding pond, at the flow inlet
and flow outlet of the pond, in addition to sampling of mud in the pond (including samples for
elusion test).
Koya Pond is divided into a natural pond and a feeding pond by a partition dam installed as
a nutrient load reduction measures.
Regarding the inflow water source to Koya Pond, along with shallow wells at two points
and deep wells at five points, one inflow from a rainwater drainage system exists from which
water is introduced only when rainfall exceeds 8 mm/h. The water catchment area is 20.07 ha. It
is considered that the inflow load from the rainwater drainage system at rainfall is not great.
Agricultural land or the like accounts for 34.5%. A drain outlet is provided in three locations
at the southern part of the pond.
Outline of points of investigation19)
Fig. 2 depicts sampling points for water quality analysis and amounts of inflow and outflow.
Fig. 3 shows sampling points of bottom mud.
Points of water sampling at inflow are natural pond (St. 1, St. 2, St. 3, St. 4), feeding pond
(St. 5), deep wells at park feeding sites (A1, A2), Muko River shallow well (B1, B2), deep well
at northeastern part of the park (C), and deep well at the eastern part of the park (D). The
weather was fine on all investigation days. The inflow from the rainwater drainage system (E)
was not observed and water sampling was not performed.
A water-level meter was installed around Chayatoi (b1) and the water level of the pond on
the investigation day was determined using this meter. Points of sampling of mud in the pond
are St. A, St. B, St. C, St. D, and St. E.
The storage capacity of Koya Pond is 94,000m3 (superficial area is 9.9 hectare, the average
depth is 0.95 m). The amount of inflow water per day is 4,500 m3/day, and the average
residence time of water in Koya Pond is 20.88 days.
- 228 -
Journal of Water and Environment Technology, Vol. 7, No. 4, 2009
C
St.5
b1
A2
E
St.3
St.4
Natural
pond
St.5
Natural
pond
St.1
St.2
B2
0m
B1
Feeding pond
100m
100m
N
D
b2
A, B, C, D, E; Position of inflow load
a, b
; Position of outflow load
A1
a1
Fig. 2 Water sampling points
N
St.C
St.D
St.E
St.B
St.A
0m
100 m
Fig. 3 Mud sampling points
Method of sampling
Water sampling was done directly using a plastic water container. For the feeding pond (St.
5), water sampling was done from the observation bridge for wild birds using a canvas bucket.
Regarding mud sampling (for bottom mud analysis), the mud surface layer was taken using
an Ekman-Birge bottom sampler, stirred sufficiently using a shovel, and then put into a sealed
bag.
- 229 -
Journal of Water and Environment Technology, Vol. 7, No. 4, 2009
Method of analysis
The following method was used for the analysis of water in the pond and bottom mud
samples. Variables such as water temperature, air temperature, and mud temperature were
measured onsite. Other analyses such as DO, pH, COD, SS,T-N,T-P were done in the
laboratory.
The DO was monitored using the diaphragm electrode method and pH was monitored using
the glass electrode method. Each of the COD, SS, T-N, and T-P was analyzed in conformity to
the river water quality test method20).
For bottom mud samples, analyses of all variables (CODsed, Ignition loss (I.L.), drying
loss, moisture content, and grain size test) except for mud temperature were performed in the
laboratory.
For CODsed, I.L. and drying loss, the bottom mud examination method21) was based from
literature as well as for grain size tests, the soil test––basics and guidance22)––. For COD, T-N,
and T-P, the dissolved forms of COD (D-COD), total nitrogen (D-TN) and total phosphorus
(D-TP) were analyzed using the filtrate after filtration.
RESULTS AND DISCUSSION
Results of water quality test
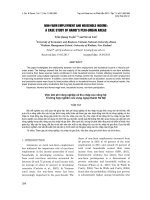
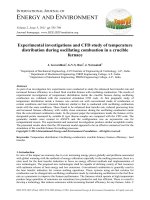
Fig. 4 shows the field investigation results on water quality. Fig. 5 illustrates the results of
the dissolved state concentrations of COD, total nitrogen (T-N), particulate total phosphorus
(P-TP), and dissolved total phosphorus (D-TP) in 2007.
The obtained results were compared to environmental criteria (C, V)23) for lakes and
marshes. Measurements performed on samples from the natural pond (July 18) were excluded
because the water sampling method used was different.
Chemical oxygen demand (COD)
COD in the natural pond was in a range of 20.0–33.7 mg/L, which was apparently greater
than the 8.0 mg/L specified in the environmental criteria for lakes and marshes, type C. It was
considered that contamination by organic matter was excessive in this reservoir.
In general, values of the suspension state are high, which is considered to be affected by SS.
They generally remain at the same level from August, to November when changes in water
quality in the natural pond of this fiscal year were reviewed.
The COD concentrations of the inflow at every point were greater than 5 mg/L, which was
specified in the environmental criteria for lakes and marshes, type B.
Suspended solids (SS)
The levels of SS in the natural pond were in the range of 20–80 mg/L. Values in August
were particularly high, which was considered to be attributable to the fact that the air
temperature was high and generation of phytoplankton was great. When changes in water
quality in the natural pond of this fiscal year were reviewed, although values at the beginning of
August and October were high, it was noticed that they generally remain at the same level in
September, October, and November. This is considered to be due to the fact that generation of
phytoplankton is suppressed as the water temperature decreases.
The SS concentrations in the inflow were generally 15 mg/L, which was specified in the
environmental criteria for lakes and marshes, type B.
Total nitrogen (T-N)
The T-N in the natural pond was 1.0–2.4 mg/L, which is higher than the 1.0 mg/L specified in
the environmental criteria for lakes and marshes, type V. Values in August were particularly
high, which was considered to be a result of the influence of SS or the like because values in the
suspension state were generally high. Observation of changes in the water quality of the natural
pond reveals that, although levels as high as 1.9 mg/L were detected at the end of September, it
- 230 -
Journal of Water and Environment Technology, Vol. 7, No. 4, 2009
COD(mg/L)
water temperature(℃)
35.0
70.0
30.0
60.0
concentration
water temperature
80.0
25.0
20.0
15.0
natural pond
A2 water course
B1 water course
B2 water course
C water course
D water course
10.0
5.0
natural pond
A2 water course
B1 water course
B2 water course
C water course
D water course
50.0
40.0
30.0
20.0
10.0
0.0
0.0
7/18
8/5
8/23
9/10
9/28
10/16
11/3
11/21
7/18
8/5
8/23
SS(mg/L)
6.00
natural pond
A2 water course
B1 water course
B2 water course
C water course
D water course
160
10/16
11/3
11/21
140
120
natural pond
A2 water course
B1 water course
B2 water course
C water course
D water course
5.00
concentration
180
concentration
9/28
T-N(mg/L)
200
100
80
60
40
4.00
3.00
2.00
1.00
20
0
0.00
7/18
8/5
8/23
9/10
9/28
10/16
11/3
11/21
7/18
8/5
8/23
T-P(mg/L)
3.50
natural pond
A2 water course
B1 water course
B2 water course
C water course
D water course
16.0
9/28
10/16
11/3
11/21
10/16
11/3
11/21
natural pond
A2 water course
B1 water course
B2 water course
C water course
D water course
14.0
12.0
concentration
2.50
2.00
z
1.50
9/10
DO(mg/L)
3.00
concentration
9/10
1.00
10.0
8.0
6.0
4.0
0.50
2.0
0.00
0.0
7/18
8/5
8/23
9/10
9/28
10/16
11/3
11/21
7/18
8/5
8/23
9/10
9/28
Fig. 4 Water quality of natural pond at inflow (2007)
<natural pond>
80.0
70.0
60.0
50.0
8.0
T-COD
concentration
P-COD
D-COD
40.0
30.0
20.0
10.0
0.0
7/18
8/8
8/29
9/19
T-N
7.0
6.0
P-TN
D-TN
5.0
4.0
3.0
2.0
1.0
0.0
10/10 10/31 11/21
7/18
8/8
8/29
9/19
10/10 10/31
<natural pond>
4.0
3.5
concentration
concentration
<natural pond>
T-P
P-TP
3.0
D-TP
2.5
2.0
1.5
1.0
0.5
0.0
7/18
8/8
8/29
9/19
10/10
10/31
11/21
Fig. 5 Concentration of COD, T-N and T-P in natural pond (2007)
- 231 -
11/21
Journal of Water and Environment Technology, Vol. 7, No. 4, 2009
was observed that after August, they generally remained at the same level during September,
October, and November.
The inflow water generally had T-N values of 0.4–1.2 mg/L. In particular, A1, A2, and D
were greater than 1.0 mg/L specified in the environmental criteria for lakes and marshes, type V,
and were considered to be greatly responsible for the nutrient enrichment of Koya Pond.
Total phosphorus (T-P)
The T-P in the natural pond was 0.5–1.67 mg/L, which exceeds the level of 0.1 mg/L used
as reference for the preservation of environments for lakes and marshes. The T-P values in July
and August were high and values in the suspension state were generally high. Therefore,
influences of SS are suggested. When changes in water quality are reviewed, T-P values in the
natural pond in August are high and it can be observed that after August, they generally
decrease. This could be due to the fact that, as the water temperature decreases, phytoplankton
generation was suppressed, and the amount of SS was reduced.
The level of T-P in the inflow water was 0.07–2.86 mg/L, which was much greater than the
0.1 mg/L specified in the environmental criteria for lakes and marshes, type V. Depending on
the point of inflow, they were higher than those in the pond, suggesting that the contamination
load by the inflow water is excessive.
Dissolved oxygen (DO)
The level of DO in the natural pond was 4.6–13.8 mg/L. Although they were low at the
beginning of September and October, they are generally greater than 10.0 mg/L, which satisfied
the reference value 2.0 mg/L specified in the environmental criteria for lakes and marshes, type
C. It was considered that higher DO is attributable to photonic synthesis by phytoplankton. The
DO values at the end of October and in November were high (12.1–13.7 mg/L), when changes
in the water quality of this fiscal year were reviewed.
As discussed above, regarding water contamination, a tendency of a higher contamination
level exists during summer. In many cases, measurements exceeded values (C, V) used for
preservation of environments, of the environmental criteria for lakes and marshes, indicating
that the progression of contamination is substantial. In particular, the T-P level, which is used as
the index of nutrient enrichment, is high in both natural ponds and inflow water.
Results of a survey on bottom mud
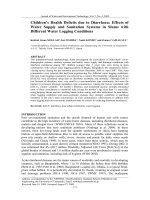
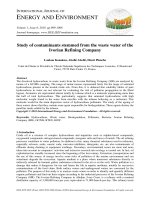
Both Fig. 6 and Table 3 show results of a survey on the bottom mud performed at the site.
It is noteworthy that although mud was sampled on July 24 and then analyzed, those results
were excluded because the point of sampling differs slightly from those of other surveys. The
results of St. C on August 7 were also excluded because the point of mud sampling and method
of sampling were different.
No standard is available for CODsed and I.L. in storage reservoirs, lakes and marshes. For
the current study, both CODsed and I.L. were compared with “Critical value of bottom mud
which gives significant influences on water quality” obtained by the Takamatsu Port and Air
Department Technology Investigation Office of the Shikoku Regional Development Bureau,
Ministry of Land, Infrastructure and Transport through field investigations and indoor tests24).
Grain size distribution
Table 3 represents Grain size distribution (Average Value of Suraey in 2007).Regarding the
grain size distribution, silt contents exceeded 90% at all sampling points, except for St. C. In
particular, the silt contents were high at points St. A, St. B, and St. E at the southern part of the
pond where the water is deep. This is considered to be attributable to the fact that the flow
velocity at the southern part of the pond is slow because it is located away from the point of
inflow; silt materials being carried by the flow are accumulated here.
- 232 -
Journal of Water and Environment Technology, Vol. 7, No. 4, 2009
percentage of water content(%)
CODsed(mg/g)
180.0
50.0
160.0
45.0
40.0
35.0
140.0
120.0
30.0
25.0
20.0
100.0
80.0
60.0
40.0
St.A
St.B
20.0
St.D
St.E
15.0
10.0
5.0
0.0
St.C
0.0
7/24
8/13
9/2
9/22
10/12
11/1
11/21
7/24
8/13
9/2
St.A
St.B
St.D
St.E
9/22
10/12
St.C
11/1
11/21
I.L.(%)
12.0
10.0
8.0
6.0
4.0
2.0
St.A
St.B
St.D
St.E
St.C
0.0
7/24
8/13
9/2
9/22
10/12
11/1
11/21
Table 3 Grain sizeFig.
distribution
value of survey in 2007)
6 Mud of(Average
Koya Pond
Table 3 Grain size distribution of bottom mud (Average value of 2007 survey)
Item
St.A
St.B
St.C
St.D
St.E
Coarse
sand (%)
Medium
sand (%)
Fine sand
(%)
Silty
sand
0.2
0.3
1.2
0.5
0.5
0.7
0.7
3.8
1.9
1.3
1.6
1.2
13.0
3.8
1.7
97.5
97.8
82.2
93.8
96.6
(%)
Chemical oxygen demand in sediment (COD sed)
The CODsed at St. A was 33.7–42.0 mg/g, 37.4–44.0 mg/g at St. B, and 35.0–42.6 mg/g at St. E.
All are far above 30.0–35.0 mg/g, which the Takamatsu Port and Air Department Technology
Investigation office uses as the critical value of bottom mud from which influences on water
quality become significant, suggesting that the bottom mud of Koya Pond remains contaminated
even after dredging. Furthermore, it is known that although the CODsed value at St. D was
23.5–24.1 mg/g, which is lower than the said critical value, the degree of contamination is high.
In particular, values of CODsed at St. A, St. B, and St. E at the southern part of the pond are
high. This is considered to be attributable to the fact that the flow velocity at the southern part of
the pond is slow because it is located away from the point of inflow, the water depth is great and
mud such as remains of phytoplankton easily accumulate. Results obtained show that the
amount of new mud is greater in deeper points at the southern part of the pond than at the
northern part of the pond.
Ignition loss (I.L.)
The I.L. at St. A at the southern part of the pond is 9.1–10.9%, 3.4–10.7% at St. B, and
10.8–11.0% at St. E, which are higher than two points at northern part of the pond. Values of St.
- 233 -
Journal of Water and Environment Technology, Vol. 7, No. 4, 2009
A, St. B, and St. E are greater than about 10.0 mg/g, which is used as the critical value,
suggesting that the bottom mud of Koya Pond remains contaminated even after dredging. This
is considered to be due to the fact that the flow velocity at the southern part of the pond is slow
because it is located away from the point of inflow, the water is deep and sediments such as
remains of phytoplankton are easily accumulated.
As discussed above, there is a tendency for bottom mud contamination, and the
contamination degree in summer is higher than that in winter. Although the I.L. of bottom mud
of Koya Pond is below the average of lakes and marshes (about 13%), progression of
contamination is considerable all throughout. Moreover, the tendency of a higher degree of
contamination is apparent at St. A and St. B at the southern part of Koya Pond, where the water
is deep. In these points, loads brought from Koya Pond basin and loads generated in Koya Pond
are readily accumulated, and sediments primarily comprise soft mud (so-called mud);
measurements here are higher than those at other points. The fine grain content rate is 90% at St.
A, St. B, and St. D, while at St. C it is greater than 80%, suggesting that bottom mud mostly
comprises silt materials. The value at St. C suggests that the ratio of fine sand is slightly higher
than that of other points.
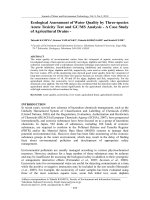
Outline of elusion test
To identify the effects of the removal of bottom mud (by dredging) on the amount of
elusion of nutrient salts from bottom mud, elusion tests were carried out using a simulated in
situ method. Bottom mud used in the experiments was sampled from Koya Pond on September
6, October 10, and November 8, 2007. Fig. 7 shows the elusion test apparatus.
Sampling tube
cm
150cm
150
80cm
Nitrogen gas
supply port
110cm
0cm
11
Exhaust port
30cm
Water immediately
above
20cm
Bottom
sediment
5cm
Fig. 7 Elusion test apparatus
For the sampling of the mud, a polyvinyl chloride pipe (5 cm internal diameter, 150 cm
length) was inserted into the bottom mud and mud was sampled without stirring. Points of mud
sampling (St. A – St. D) were set to surround the island in the pond.
For the bottom mud thus sampled, only the surface layer (20 cm from the surface layer)
was left and water was carefully added directly onto it up to 110 cm height taking care not to
stir the bottom mud. For the water to be used for the elusion test, the surface layer of water was
sampled at point St. B and filtered using glass fiber filter paper (0.45 μm nominal pore diameter,
- 234 -
Journal of Water and Environment Technology, Vol. 7, No. 4, 2009
Tokyo Glass Instrument).
Because the bottom area of Koya Pond is under anaerobic condition, the elusion test was
carried out with mud from St.A, – St. D under anaerobic conditions. Furthermore, the test was
carried out under aerobic conditions for comparison of St. A. Considering activities of algae and
benthic organisms, three water temperatures were set: 20°C, 25°C, and 30°C.
The elusion test was carried out six times on days 1, 3, 5, 10, 15, and 20.
To grasp the amount of elusion, measurements were carried out on day 0 (start).
Elusion concentration in the experiment
The elusion concentration (COD, FN) over time (Fig. 8) during the experiment on mud
shows that the concentration increases sharply during the first few days. Subsequently, the
elusion concentration increases slowly at a constant rate. The T-P concentration increases
slowly except at St.A. The elusion rate (Fig. 9) is high on the first day, thereafter decreasing
over time. The elusion rates of COD and T-N,are virtually constant after 5 days. Although the
T-P elusion rate shows the same tendency as the others, it decreases, except at St.A, after 5
days.
T-N(mg/L)
c onc entration
1.20
18. 0
16. 0
14. 0
12. 0
10. 0
8. 0
6. 0
4. 0
2. 0
0. 0
S t. A( anaerobic )
S t. B( anaerobic )
S t. C( anaerobic )
S t. D (anaerobic)
S t. A( aerobic)
0
5
10
15
1.00
0.80
0.60
St. A(anaerobic)
St. B(anaerobic)
St. C(anaerobic)
St. D( anaerobic)
St. A(aerobic)
0.40
0.20
0.00
20
0
5
10
days
d ays
St . A(anaerobic) T- P(mg/ L)
St . B(anaerobic)
St . C(anaerobic)
St . D(anaerobic )
St . A(aerobic)
2. 10
1. 80
concent rat ion
c oncent rat ion
COD (mg/L)
1. 50
1. 20
0. 90
0. 60
0. 30
0. 00
0
5
10
15
20
days
Fig. 8 Elusion concentration in the experiment (2007.10.10)
- 235 -
15
20
Journal of Water and Environment Technology, Vol. 7, No. 4, 2009
T-N elusion rat e (mg/m2/d )
700.00
6000. 0
St .A (anaerobic)
St .B (anaerobic)
St .C (anaerobic)
St .D (anaerobic)
St .A (aerobic)
500.00
400.00
300.00
200.00
100.00
0
5
10
15
4000. 0
3000. 0
2000. 0
1000. 0
0. 0
-1000. 0 0
0.00
-100.00
St .A (anaerobic)
St .B (anaerobic)
St .C (anaerobic)
St .D (anaerobic)
St .A (aerobic )
5000. 0
elusion rate
600.00
elusion rate
COD elusion rat e (mg/m2/d )
20
5
10
days
15
20
days
elusion rate
T-P elus ion rat e(mg/m2/d)
400.00
350.00
300.00
250.00
St . A(anaerobic)
St . B(anaerobic)
St . C(anaerobic)
St . D( anaerobic)
St . A(aerobic)
200.00
150.00
100.00
50.00
0.00
-50.00
0
5
10
15
20
days
Fig. 9 Elusion rate in the experiment (2007.10.10)
Calculation method
The elusion rate was obtained such that the amount of elusion at water sampling was
obtained using Eq. (1) and the rate was calculated from the gradient of the equation of linear
regression,
Mi =
n
⎧⎪⎛
n
∑ ⎨⎪⎩⎜⎜⎝V − ∑ V
0
i =1
i =1
i −1
⎫
⎞
⎟⎟(C i − C i −1 )⎪⎬ S × 10 3
⎪⎭
⎠
(1)
where:
Mi: Amount of elusion until the n-th measurement (mg/m2).
V0: Initial amount of water immediately above (M3)
Vi: Amount of water sampling at the i-th measurement (m3)
Ci: Concentration of water immediately above at the i-th measurement (mg/L)
S: Sectional area of vinyl chloride pipe (m2)
Ri = dM i dt
In equation 2, the following are used.
Ri: Elusion rate (mg/m2/d)
Mi: Amount of elusion until the n-th measurement (mg/m2)
t: Time (day)
(2)
Chemical oxygen demand in bottom mud
The elusion rate of COD from the bottom mud shows a very high value. Sampling points,
St. A and St. B showed higher COD values than those of St. C and St. D. Particularly, the COD
elusion rate at St. B at the first elusion test (September 6) was 429.4 mg/m2/d, which is the
highest in the current study. The cause for this is considered to be sedimentation and eventual
accumulation of feces of ducks and swans, and bait because a feeding pond exists nearby.
According to related studies, the elusion rate decreases as the set water temperature at the
elusion test is lowered25). The same tendency is observed with the results of the current
- 236 -
Journal of Water and Environment Technology, Vol. 7, No. 4, 2009
experiments both under aerobic and anaerobic conditions. It is known that when the water
temperature becomes greater than 30°C under aerobic and anaerobic conditions in the Koya
Pond, the elusion rate is affected remarkably by contamination loads resulting from elusion of
bottom mud.
Total nitrogen in bottom mud
Results of elusion rate tests of St. A under aerobic condition and anaerobic condition reveal
that elusion is remarkable under aerobic conditions as compared to anaerobic condition in either
elusion test. The elusion rate under aerobic conditions is 1.12–1.33 times that under anaerobic
conditions. The elusion rate of T-N from bottom mud shows a very high value; St. A and St. B
showed higher values than those of St. C and St. D. In particular, the T-N elusion rate at St. B at
the second elusion test (October 10) is 40.0 mg/m2/d, which is the highest in the current test.
The cause for this is considered to be sedimentation and eventual accumulation of feces
produced by ducks and swans, and uneaten food from the feeding pond nearby.
In Koya Pond, it is known that influences of contamination loads caused by elusion from
bottom mud become excessive when the water temperature becomes greater than 30°C under
aerobic condition and is around 25°C under anaerobic condition.
Total phosphorus in bottom mud
Results of elusion rate tests of St. A under aerobic and anaerobic conditions reveal that
elusion is remarkably higher under anaerobic condition than under aerobic condition in either
elusion test. The results demonstrate that the elusion rate under anaerobic condition is 3.01–7.73
times the elusion rate under aerobic condition.
The elusion rate of T-P from bottom mud is very high. When compared, St. C and St. D
showed higher values than those of St. A and St. B. The reason for this is considered to be the
fact that the water at St. C and St. D is shallower than at St. A and St. B. Furthermore, the
influences of remains of phytoplankton deposited on the pond bottom without being
decomposed in the water are remarkable. Results revealed that the elusion rate at the northern
part of the pond is 0.88–1.48 times higher than that at the southern part of the pond. In addition,
because the rainwater drainage system is located nearby, influences of phosphorus inflow
contamination load during rainy weather are responsible for this.
Under aerobic and anaerobic conditions, Koya Pond is under environments which are
remarkably affected by contamination loads resulting from elusion from bottom mud when the
water temperature is around 25°C.
CONCLUSIONS
In the current study, in Koya Pond, the authors identified the degree of contamination of
water quality and bottom mud after dredging. Considering that influences of bottom mud on
water quality should be identified, elusion rate tests from bottom mud were carried out and
results of water quality improvement after dredging were discussed. The findings obtained are
as follows:
1) Regarding the water quality contamination status, the contamination level in summer showed
a higher tendency than that of autumn. The water quality of Koya Pond exceeds, in many
instances, the environmental reference value (C, V) for lakes and marshes. It is considered
that, in general, contamination is promoted even after dredging.
2) The elusion rate test revealed that, under anaerobic condition, elusion of COD from bottom
mud is remarkable, with water temperatures of more than 30°C. Similarly, T-N and T-P are
remarkable with water temperature around 25°C, and that great changes exist in the elusion
rate depending on the temperature of the immediately overlying water.
3) The elusion rate of T-N under aerobic condition is 1.12–1.33 times higher than that under
anaerobic condition. The elusion rate of T-P under anaerobic condition is 3.01–7.73 times
higher than that under aerobic condition.
- 237 -
Journal of Water and Environment Technology, Vol. 7, No. 4, 2009
Future investigations are necessary in relation to the behavior of accumulation and
sedimentation of contaminated matter on the pond bottom, how they are changed depending on
the pond position, influences of precipitation and mud on water quality of the pond,
quantification of effects by dredging, and assessment of improvement and controls of water
quality through the removal of bottom mud.
ACKNOWLEDGEMENT
The research was supported by many researchers and the authors would like to thank these
members for their support in this study.
REFERENCES
T. Tanaka, A. Ichiba(2005). Identifying the Main Cause of Eutrophication in Lake Hashie,
Gunma Prefecture and Preventive Measures. Journal of Japan Society on Water
Environment, 28(12), 751–757.
J. Takahashi, E. Siratani, I. Yoshinaga(1999). Study on the relationships between irrigation
ponds characteristics and water quality in Japan. Collection of papers of the Japanese
Society of Irrigation Drainage and Reclamation Engineering, 67, 107–118.
S. Kobayashi(1997). Eutrophication Analysis for Drastic Water Purification in Lake Teganuma.
Journal of Water and Waste, 39 (6), 479–486.
N. Noguchi, S. Nagasaka, H. Horino, T. Mino(2000). Nutrient Release Fluxes from Sediments
in Irrigation Ponds. Collection of papers of the Japanese Society of Irrigation Drainage and
Reclamation Engineering, 206, 91–98.
H. Tanaka, Y. Komori, M. Sasaki. Jianhua. Li, J. Wada(2003). Investigation relating to mass
transfer between bottom mud and water. Data by National Institute for Land and
Infrastructure Management, 138, 327–332.
J. Wada, Fusheng. Li, J. Tsumori, H. Tanaka(2004). Elusion of nutrient salts from bottom mud
in reservoir. Collection of lectures of Japan Society on Water Environment, 38, 589.
M. Tanaka(2005). Special issue – Environmental issue of storage reservoir – Accumulation and
properties of bottom mud. Living and Environments, 50 (8), 18–21.
T. Okubo(1998). Water quality purification utilizing storage reservoir and natural lagoon.
Journal of Water and Waste,40 (10), 883–893.
K. Nakamura, T. Morikawa, Y. Shimatani(2000). Pollution load control by artificial lagoon
provided at river mouth. Collection of papers of environmental system research, 28,
115–123.
F. Tsuchiyama, R. Ando, Y. Sakakibara, T. Kamata, N. Suzuki, S. Kojima(2006). Changes in
water quality of Ohne pond (Tenpaku-ward, Nagoya City) in 32 years and influences of
extraction plant on water quality. Report of Environmental Science Research Institute,
Nagoya City, 25–28.
H. Konno(1997). Pollution load of water storage pond by meteoric water and groundwater. The
42nd Annual Academic Lecture Meeting, Japan Society of Civil Engineers, Part II,
161–169.
T. Yamamoto, H. Nakasone, Y. Matsuzawa, H. Kurota, R. Kato(2005). Removal Effect of
Runoff Loads in an Irrigation Reservior. Journal of Japan Society on Water Environment, 28
(1), 29–36.
H. Miura, H. Muraoka, Y. Wada, M. Shiroishi(2000). Visitors’ Stream-of-consciousness about
Contact with Waterfowl and Reduction Way of Influence of this Contact on Waterside
Environment. Journal of Japan Society on Water Environment, 23 (9), 565–571.
K. Motohashi, H. Suzuki(1991). Some problems on the effect of bottom sludge dredging in the
Lake Teganuma, 32 (9), 489–495.
City of Itami, Konoike Construction(2004). Koya Pond water quality purification measures
- 238 -
Journal of Water and Environment Technology, Vol. 7, No. 4, 2009
construction.
T. Sakata, T. Seto, S. Miyawaki(2006). Influences of common cormorant on nutrient enrichment
of Koya Pond. Itami City, International Environmental Technical School, Collection of
summaries, Fiscal 2006 meeting for reading graduation research papers, 11.
Hyogo Prefecture Science and Technology Center(1996). Report of investigation of influences
by water quality purification of Koya Pond.
F. Nakahashi(2003). The Report of Plan, Design, Construction and Management in Koyaike
Park. Landscape Research, 66, 180–183.
K. Yoshida, H. Matsubara, A. Hidaka(2006). Examples of volume reduction of bottom mud
after dredging of lakes and marshes by dehydration processing and effective utilization of
processed soil. Environmental Conservation Engineering, 35 (6), 50–54.
River Bureau, Ministry of Construction(1997). Test method of river water quality (Draft). Fiscal
1997 edition, Test method part, Gihodo.
Water Quality Management Division, Water Quality Bureau, Environment Agency(1998).
Bottom sediment examination method and explanatory notes (Revised edition). Japan
Environmental Measurement & Chemical Analysis Association.
Editorial Committee for Soil Tests Practical Training Guidance (Third revision), The Japanese
Geotechnical Society(2001). Geotechnical test – Basics and guidance – (First revision). The
Japanese Geotechnical Society.
59 issue of the announcement by Environment Ministry
Kinki Regional Development Bureau, Ministry of Land(2003). Osaka bay environmental
illustration. Infrastructure and Transport.
K. Sakai, M. Nakatsugawa, T. Ikeda(1997). Investigation of nutrient release from sediments
taking into account field conditions. Collection of papers, Hokkaido branch, Japan Society
of Civil Engineers, 53B (1996), 644–647.
- 239 -