Toxic Powe: How Power Plants Contaminate Our Air and States pot
Bạn đang xem bản rút gọn của tài liệu. Xem và tải ngay bản đầy đủ của tài liệu tại đây (749.25 KB, 30 trang )
Toxic Power
July 2011
Toxic
Power
How Power Plants Contaminate
Our Air and States
Introduction
The electric sector is the largest source of industrial (stack) emissions of toxic air pollution in the United States. In
2009, coal- and oil-fired power plants accounted for nearly 50 percent of all reported toxic pollution from industrial
sources. The next largest sector, chemical processing and manufacturing, emitted less than one third of the electric
sector’s total. Power plants are the leading source of industrial toxic air pollution in 28 states and the District of
Columbia.
Exposure to toxic pollution from power plants, including hydrochloric acid, mercury, and other metals, is known or
believed to contribute to or exacerbate a wide variet
y
of health conditions, includin
g
one or more of the followin
g
:
ygg
` Asthma and other respiratory ailments,
` Developmental disorders,
` Neurological damage,
` Birth defects,
` Cancer, and
` Premature mortality.
This report analyzes publicly available data from Environmental Protection Agency’s Toxics Release Inventory (TRI).
Facilities that release significant quantities of a wide variety of toxic chemicals must report these releases, including
industrial air emissions, to TRI annually. These self-reported data reveal that power plants are largely responsible for
contaminating our air with toxic chemicals.
Sources: EPA’s Toxic Release Inventory (2009 data), accessed June 2011; EPA’s National Electric Energy Data System Database v.4.10 (2010).
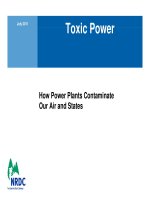
The Toxic Twenty
Power plants are the leading sources of toxic air pollution in all but four of the top 20 states by electric sector emissions.
State
Electric Sector Rank
by In-State Toxic Air
Total Industrial
Toxic Air Pollution
Ele ctric Se ctor
Toxic Air Pollution
Ele ctr ic Se ctor
Contribution to State
Status of State
Mercury Regulations
Pollution (lbs) (lbs) Toxic Air Pollution (%)
Mercury
Regulations
Ohio 1 68,863,474 44,545,704 65%
Pennsylvania 1 50,527,280 41,459,532 82%
Florida 1 49,039,948 33,442,431 68%
K
e
n
tuc
k
y
141
,3
4
0,3
4
8
3
1
,9
47
,066
77
%
Kentucky
1
41,340,348
31,947,066
77%
Maryland 1 29,887,235 27,092,233 91%
●
Indiana 1 39,634,894 26,798,135 68%
Michigan 1 31,276,291 22,731,782 73%
●
West Virginia 1 25,493,261 21,486,688 84%
Geo
r
g
i
a
141
,90
2
,8
4
8
1
8,
24
6,6
17 44
%
●
Geo g a
,90,88
8, 6,6
%
●
North Carolina 1 30,296,011 14,907,994 49%
●
South Carolina 1 26,774,040 11,453,391 43%
●
Alabama 2 28,573,077 11,418,246 40%
Texas 2 39,442,151 10,155,177 26%
Virginia
1
25,205,367
9,649,281
38%
Virginia
1
25,205,367
9,649,281
38%
Tennessee 1 25,070,569 8,864,747 35%
Missouri 1 12,011,626 6,360,329 53%
Illinois 1 23,917,015 5,583,222 23%
●
Wisconsin 2 12,810,181 3,451,772 27%
●
New Hampshire
1
2,633,143
2,519,676
96%
●
St t h l t i t l ti th t
tl t
t i t EPA’ d tilit i t i l
New
Hamps hir e
1
2,633,143
2,519,676
96%
●
Iow a 4 15,370,670 2,486,771 16%
Toxic 20 Total 1 620,069,428 354,600,794 57%
U.S. Total 1 771,580,707 381,740,601 49%
St
a
t
e
h
as e
l
ec
t
r
i
c sec
t
or mercury regu
l
a
ti
ons
th
a
t
are a
t
l
eas
t
as s
t
r
i
ngen
t
as
EPA’
s propose
d
u
tilit
y a
i
r
t
ox
i
cs ru
l
e.
State has electric sector mercury regulation that are less stringent than EPA’s proposed utility air toxics rule.
Note: A table summarizing the emissions from all states is available in the appendix.
Sources: EPA’s Toxic Release Inventory (2009 data), accessed June 2011; State environmental departments.
Toxic Industrial Air Pollution in the U.S.
Toxic Air Pollution by Sector
St
Toxic Air
Pllti
% of National Air
Electricity Generation
Chemicals
Paper Products
Food & Beverages
S
ec
t
or
P
o
ll
u
ti
on
(lbs)
%
of
National
Air
Pollution
Electricity Generation 381,740,601 49%
Chemicals 112,870,057 15%
Paper Products 103,249,010 13%
Food
&
Beverages
Primary Metals
Other
Food & Beverages 26,908,977 3%
Primary Metals 24,923,246 3%
Other 121,888,815 16%
Total 771,580,707 100%
U.S. Electric Sector
Key Facts
Top Power Plant Polluters
Toxic Air Pollution
All Toxics Mercury
Plant Name State
Toxic Air Pollution (lbs)
Pollution
Control
Update ?
Ow ner(s)
Toxic
Air
Pollution
The U.S. electric sector was
responsible for 49% of all
industrial toxic air pollution in
2009, emitting nearly 382
million pounds.
Keystone PSEG, Constellation, Exelon, GenOn & Others PA 15,436,496 795
●
Brandon Shores Constellation MD 13,109,753 280
●
Crist Southern FL 9,804,196 298
●
Monroe DTE Energy MI 9,691,081 848
●
Crystal River Progress Energy & Others FL 9,449,158 360
●
Mercury Pollution
Electricity generation in the U.S.
accounted for about 75% of all
mercury air pollution, emitting
nearly 71,000 pounds in 2009.
●
Paradise Tennessee Valley Authority KY 7,713,713 170
Muskingum River AEP OH 7,421,075 322
Morgantow n GenOn MD 7,067,197 220
●
John E Amos AEP WV 6,675,594 526
●
Harllee Branch Southern GA 6,155,089 266
Note: The possibility of already planned retirements or pollution controls at the listed plants may also reduce emissions in future years.
Sources: EPA’s Toxics Release Inventory (2009 data), accessed June 2011; EPA’s National Electric Energy Data System Database v.4.10 (2010).
Pollution controls have been installed since 2009 or are currently under construction. These investments should reduce emissions of mercury and other
toxic air pollutants in future years.
Toxic Industrial Air Pollution in Ohio
Toxic Air Pollution by Sector
St
Toxic Air
Pllti
%of State Toxic
Electricity Generation
Chemicals
Fabricated Metals
Paper Products
S
ec
t
or
P
o
ll
u
ti
on
(lbs)
%
of
State
Toxic
Air Pollution
Electricity Generation 44,545,704 65%
Chemicals 12,358,212 18%
Fabricated Metals 2,316,089 3%
Paper
Products
Plastics & Rubber
Other
Paper Products 1,918,613 3%
Plastics & Rubber 1,402,363 2%
Other 6,322,492 9%
Total 68,863,474 100%
Ohio Key Facts Top Power Plant Polluters
Toxic Air Pollution
Ohio’s electric sector ranked FIRST in
toxic air
p
ollution in 2009, emittin
g
more
All Toxics Mercury
Plant Name Owner(s)
Toxic Air Pollution (lbs)
Pollution
Control
Update?
pg
than 44.5 million pounds of harmful
chemicals, which accounted for 65% of
state pollution and 12% of toxic pollution
from all U.S. power plants.
Mercury Pollution
Muskingum River AEP 7,421,075 322
W H Sammis FirstEnergy 5,857,756 364
●
J M Stuart Duke, DPL, AEP 4,566,050 94
Cardinal Buckeye Pow er, AEP 4,290,199 407
●
Walter C Beckjord Duke, DPL & Others 4,261,996 252
Ohio ranked THIRD among all states in
mercury air pollution from power plants
with about 3,980 pounds emitted in
2009, which accounted for 76% of state
mercury air pollution and 6% of U.S.
electric sector pollution.
Eastlake FirstEnergy 2,997,532 268
Miami Fort Duke, DPL 2,800,979 128
Kyger Creek AEP & Others 2,789,782 326
●
Avon Lake GenOn 2,136,335 261
W H Zimmer Duke, DPL, AEP 1,445,893 94
Note: The possibility of already planned retirements or pollution controls at the listed plants may also reduce emissions in future years.
Sources: EPA’s Toxics Release Inventory (2009 data), accessed June 2011; EPA’s National Electric Energy Data System Database v.4.10 (2010).
Pollution controls have been installed since 2009 or are currently under construction. These investments should reduce emissions of mercury
and other toxic air pollutants in future years.
Toxic Industrial Air Pollution in Pennsylvania
Toxic Air Pollution by Sector
St
Toxic Air
Pllti
%of State Toxic
Electricity Generation
Paper Products
Primary Metals
Petroleum Products
S
ec
t
or
P
o
ll
u
ti
on
(lbs)
%
of
State
Toxic
Air Pollution
Electricity Generation 41,459,532 82%
Paper Products 1,881,608 4%
Primary Metals 1,670,608 3%
Petroleum
Products
Chemicals
Other
Petroleum Products 1,541,012 3%
Chemicals 923,795 2%
Other 3,050,725 6%
Total 50,527,280 100%
Pennsylvania Key Facts Top Power Plant Polluters
Toxic Air Pollution
Pennsylvania’s electric sector ranked
SECOND in toxic air
p
ollution in 2009,
All Toxics Mercury
Plant Name Owner(s)
Toxic Air Pollution (lbs)
Pollution
Control
Update ?
p
emitting nearly 41.5 million pounds of
harmful chemicals, which accounted for
82% of state pollution and 11% of toxic
pollution from all U.S. power plants.
Mercury Pollution
Keystone PSEG, Constellation, Exelon, GenOn & Others 15,436,496 795
●
Homer City Station Edison International 6,027,737 526
Hatfields Ferry FirstEnergy 3,402,293 505
●
Portland GenOn 3,020,978 178
PPL Brunner Island PPL 2,484,839 265
●
Pennsylvania ranked SECOND among
all states in mercury air pollution from
power plants with over 4,500 pounds
emitted in 2009, which accounted for
71% of state mercury air pollution and
6% of U.S. electric sector pollution.
●
Chesw ick Pow er Plant GenOn 2,381,170 138
●
Shaw ville GenOn 2,135,910 540
Titus GenOn 1,178,319 29
Sunbury Generation Corona Pow er 861,711 50
Conemaugh PSEG, Exelon, GenOn & Others 724,389 569
Note: The possibility of already planned retirements or pollution controls at the listed plants may also reduce emissions in future years.
Sources: EPA’s Toxics Release Inventory (2009 data), accessed June 2011; EPA’s National Electric Energy Data System Database v.4.10 (2010).
Pollution controls have been installed since 2009 or are currently under construction. These investments should reduce emissions of mercury
and other toxic air pollutants in future years.
Toxic Industrial Air Pollution in Florida
Toxic Air Pollution by Sector
St
Toxic Air
Pllti
% of State Toxic
Electricity Generation
Paper Products
Chemicals
Food & Beverages
S
ec
t
or
P
o
ll
u
ti
on
(lbs)
%
of
State
Toxic
Air Pollution
Electricity Generation 33,442,431 68%
Paper Products 6,658,129 14%
Chemicals 6,543,518 13%
Food
&
Beverages
Transportation Equipment
Other
Food & Beverages 1,001,721 2%
Transportation Equipment 519,583 1%
Other 874,565 2%
Total 49,039,948 100%
Florida Key Facts Top Power Plant Polluters
Toxic Air Pollution
Florida’s electric sector ranked THIRD in
toxic air
p
ollution in 2009, emittin
g
over
All Toxics Mercury
Plant Name Owner(s)
Toxic Air Pollution (lbs)
Pollution
Control
Update ?
pg
33.4 million pounds of harmful
chemicals, which accounted for 68% of
state pollution and 9% of toxic pollution
from all U.S. power plants.
Mercury Pollution
Crist Southern 9,804,196 298
●
Crystal River Progress Energy & Others 9,449,158 360
●
Lansing Smith Southern 3,678,906 129
St Johns River JEA, NextEra Energy 2,838,015 107
Seminole Seminole Electric Coop 1,849,222 80
Florida ranked 18th among all states in
mercury air pollution from power plants
with about 1,610 pounds emitted in
2009, which accounted for 78% of state
mercury air pollution and 2% of U.S.
electric sector pollution.
Stanton Orlando Utilities, Florida Municipal Pow er & Others 1,147,567 198
Big Bend TECO 1,130,908 100
Cedar Bay Cogentrix 971,307 74
C D McIntosh Jr City of Lakeland, Orlando Utilities 502,579 11
Deerhaven Gainesville Regional Utilities 419,348 12
●
Note: The possibility of already planned retirements or pollution controls at the listed plants may also reduce emissions in future years.
Sources: EPA’s Toxics Release Inventory (2009 data), accessed June 2011; EPA’s National Electric Energy Data System Database v.4.10 (2010).
Pollution controls have been installed since 2009 or are currently under construction. These investments should reduce emissions of mercury
and other toxic air pollutants in future years.
●
Toxic Industrial Air Pollution in Kentucky
Toxic Air Pollution by Sector
St
Toxic Air
Pllti
%of State Toxic
Electricity Generation
Chemicals
Paper Products
Printing & Publishing
S
ec
t
or
P
o
ll
u
ti
on
(lbs)
%
of
State
Toxic
Air Pollution
Electricity Generation 31,947,066 77%
Chemicals 2,907,708 7%
Paper Products 1,811,981 4%
Printing
&
Publishing
Primary Metals
Other
Printing & Publishing 1,092,508 3%
Primary Metals 944,219 2%
Other 2,636,866 6%
Total 41,340,348 100%
Kentucky Key Facts Top Power Plant Polluters
Toxic Air Pollution
Kentucky’s electric sector ranked
FOURTH in toxic air
p
ollution in 2009,
All Toxics Mercury
Plant Name Owner(s)
Toxic Air Pollution (lbs)
Pollution
Control
Update?
p
emitting over 31.9 million pounds of
harmful chemicals, which accounted for
77% of state pollution and about 8% of
toxic pollution from all U.S. power plants.
Mercury Pollution
Paradise Tennessee Valley Authority 7,713,713 170
Big Sandy AEP 5,437,314 334
Ghent PPL 4,225,878 140
●
Mill Creek PPL 4,154,748 239
E W Brow n PPL 2,027,273 123
●
Kentucky ranked 14th among all states in
mercury air pollution from power plants
with about 1,760 pounds emitted in
2009, which accounted for 89% of state
mercury air pollution and about 2% of
U.S. electric sector pollution.
●
Cooper East Kentucky Pow er Coop 1,612,120 100
●
Trimble County PPL & Others 1,165,453 85
Cane Run PPL 834,351 86
East Bend Duke, DPL 774,364 54
Shaw nee Tennessee Valley Authority 761,659 190
Note: The possibility of already planned retirements or pollution controls at the listed plants may also reduce emissions in future years.
Sources: EPA’s Toxics Release Inventory (2009 data), accessed June 2011; EPA’s National Electric Energy Data System Database v.4.10 (2010).
Pollution controls have been installed since 2009 or are currently under construction. These investments should reduce emissions of mercury
and other toxic air pollutants in future years.
Toxic Industrial Air Pollution in Maryland
Toxic Air Pollution by Sector
St
Toxic Air
Pllti
%of State Toxic
Electricity Generation
Paper Products
Chemicals
Fabricated Metals
S
ec
t
or
P
o
ll
u
ti
on
(lbs)
%
of
State
Toxic
Air Pollution
Electricity Generation 27,092,233 91%
Paper Products 1,418,913 5%
Chemicals 610,921 2%
Fabricated
Metals
Plastics & Rubber
Other
Fabricated Metals 368,027 1%
Plastics & Rubber 165,519 1%
Other 231,622 1%
Total 29,887,235 100%
Maryland Key Facts Top Power Plant Polluters
Toxic Air Pollution
Maryland’s electric sector ranked FIFTH
in toxic air
p
ollution in 2009, emittin
g
All Toxics Mercury *
Plant Name Owner(s)
Toxic Air Pollution (lbs)
Pollution
Control
Update?
pg
nearly 27.1 million pounds of harmful
chemicals, which accounted for 91% of
state pollution and about 7% of toxic
pollution from all U.S. power plants.
Mercury Pollution
Brandon Shores Constellation 13,109,753 280
●
Morgantow n GenOn 7,067,197 220
●
Chalk Point LLC GenOn 3,962,155 220
●
Dickerson GenOn 2,200,434 80
●
C P Crane Constellation 621,633 14
Maryland ranked 26th among all states in
mercury air pollution from power plants
with about 820 pounds emitted in 2009,
which accounted for 55% of state
mercury air pollution and about 1% of
U.S. electric sector pollution.
* State has enacted stringent mercury control regulations for the electric sector.
Pollution controls have been installed since 2009 or are currently under construction. These investments should reduce emissions of mercury
and other toxic air pollutants in future years.
AES Warrior Run AES 76,052 3
R Paul Smith Pow er Station FirstEnergy 55,008 4
Note: The possibility of already planned retirements or pollution controls at the listed plants may also reduce emissions in future years.
Sources: EPA’s Toxics Release Inventory (2009 data), accessed June 2011; EPA’s National Electric Energy Data System Database v.4.10 (2010).
Toxic Industrial Air Pollution in Indiana
Toxic Air Pollution by Sector
St
Toxic Air
Pllti
%of State Toxic
Electricity Generation
Primary Metals
Transportation Equipment
Plastics & Rubber
S
ec
t
or
P
o
ll
u
ti
on
(lbs)
%
of
State
Toxic
Air Pollution
Electricity Generation 26,798,135 68%
Primary Metals 3,927,788 10%
Transportation Equipment 1,776,924 4%
Plastics
&
Rubber
Food & Beverages
Other
Plastics & Rubber 1,572,561 4%
Food & Beverages 1,177,260 3%
Other 4,382,226 11%
Total 39,634,894 100%
Indiana Key Facts Top Power Plant Polluters
Toxic Air Pollution
Indiana’s electric sector ranked SIXTH in
toxic air
p
ollution in 2009, emittin
g
nearl
y
All Toxics Mercury
Plant Name Owner(s)
Toxic Air Pollution (lbs)
Pollution
Control
Update?
pgy
26.8 million pounds of harmful
chemicals, which accounted for 68% of
state pollution and 7% of toxic pollution
from all U.S. power plants.
Mercury Pollution
Rockport AEP 3,554,932 852
AES Petersburg AES 3,413,236 506
●
Clifty Creek AEP & Others 2,569,618 405
●
Gibson Duke & Others 2,180,119 142
State Line Energy Dominion 2,141,597 62
Indiana ranked FOURTH among all
states in mercury air pollution from power
plants with nearly 3,670 pounds emitted
in 2009, which accounted for 81% of
state mercury air pollution and 5% of
U.S. electric sector pollution.
R M Schahfer NiSource 1,918,387 431
●
R Gallagher Duke 1,681,512 19
●
Harding Street AES 1,576,384 161
Merom Hoosier Energy 1,558,311 242
●
Frank E Ratts Hoosier Energy 1,550,911 57
Note: The possibility of already planned retirements or pollution controls at the listed plants may also reduce emissions in future years.
Sources: EPA’s Toxics Release Inventory (2009 data), accessed June 2011; EPA’s National Electric Energy Data System Database v.4.10 (2010).
Pollution controls have been installed since 2009 or are currently under construction. These investments should reduce emissions of mercury
and other toxic air pollutants in future years.
Toxic Industrial Air Pollution in Michigan
Toxic Air Pollution by Sector
St
Toxic Air
Pllti
%of State Toxic
Electricity Generation
Paper Products
Transportation Equipment
Chemicals
S
ec
t
or
P
o
ll
u
ti
on
(lbs)
%
of
State
Toxic
Air Pollution
Electricity Generation 22,731,782 73%
Paper Products 2,509,690 8%
Transportation Equipment 2,305,549 7%
Chemicals
Cement
Other
Chemicals 1,089,073 3%
Cement 598,576 2%
Other 2,041,620 7%
Total 31,276,291 100%
Michigan Key Facts Top Power Plant Polluters
Toxic Air Pollution
Michigan’s electric sector ranked
SEVENTH in toxic air
p
ollution in 2009,
All Toxics Mercury
Plant Name Owner(s)
Toxic Air Pollution (lbs)
Pollution
Control
Update?
p
emitting over 22.7 million pounds of
harmful chemicals, which accounted for
73% of state pollution and 6% of toxic
pollution from all U.S. power plants.
Mercury Pollution
Monroe DTE Energy 9,691,081 848
●
Trenton Channel DTE Energy 2,306,058 185
Dan E Karn / J C Weadlock CMS Energy 1,709,371 197
●
J H Campbell CMS Ener gy & Other s 1,500,241 431
River Rouge DTE Energy 1,277,897 153
Michigan ranked SEVENTH among all
states in mercury air pollution from power
plants with about 2,790 pounds emitted
in 2009, which accounted for 87% of
state mercury air pollution and 4% of
U.S. electric sector pollution.
St Clair DTE Energy 1,256,389 280
Eckert Station Lansing Board of Water & Light 1,112,071 71
Erickson Station Lansing Board of Water & Light 911,495 58
B C Cobb CMS Ener gy 664,819 79
J R Whiting CMS Energy 481,558 85
Note: The possibility of already planned retirements or pollution controls at the listed plants may also reduce emissions in future years.
Sources: EPA’s Toxics Release Inventory (2009 data), accessed June 2011; EPA’s National Electric Energy Data System Database v.4.10 (2010).
* State has enacted stringent mercury control regulations for the electric sector.
Pollution controls have been installed since 2009 or are currently under construction. These investments should reduce emissions of mercury
and other toxic air pollutants in future years.
Toxic Industrial Air Pollution in West Virginia
Toxic Air Pollution by Sector
St
Toxic Air
Pllti
%of State Toxic
Electricity Generation
Chemicals
Primary Metals
Furniture
S
ec
t
or
P
o
ll
u
ti
on
(lbs)
%
of
State
Toxic
Air Pollution
Electricity Generation 21,486,688 84%
Chemicals 1,850,122 7%
Primary Metals 618,192 2%
Furniture
Fabricated Metals
Other
Furniture 456,502 2%
Fabricated Metals 371,631 1%
Other 710,127 3%
Total 25,493,261 100%
West Virginia Key Facts Top Power Plant Polluters
Toxic Air Pollution
West Virginia’s electric sector ranked
EIGHTH in toxic air
p
ollution in 2009,
All Toxics Mercury
Plant Name Owner(s)
Toxic Air Pollution (lbs)
Pollution
Control
Update?
p
emitting nearly 21.5 million pounds of
harmful chemicals, which accounted for
84% of state pollution and 6% of toxic
pollution from all U.S. power plants.
Mercury Pollution
John E Amos AEP 6,675,594 526
●
Harrison Pow er Station FirstEnergy 3,785,973 134
Willow Island FirstEnergy 2,476,084 79
Philip Sporn AEP 2,265,656 132
Fort Martin Pow er Station FirstEnergy 1,894,128 329
●
West Virginia ranked 10th among all
states in mercury air pollution from power
plants with about 2,520 pounds emitted
in 2009, which accounted for 94% of
state mercury air pollution and 4% of
U.S. electric sector pollution.
●
Kammer AEP 1,664,782 364
Kanaw ha River AEP 1,384,944 82
Mt Storm Dominion 668,969 309
Mountaineer AEP 409,056 311
Albright FirstEnergy 217,091 79
Note: The possibility of already planned retirements or pollution controls at the listed plants may also reduce emissions in future years.
Sources: EPA’s Toxics Release Inventory (2009 data), accessed June 2011; EPA’s National Electric Energy Data System Database v.4.10 (2010).
Pollution controls have been installed since 2009 or are currently under construction. These investments should reduce emissions of mercury
and other toxic air pollutants in future years.
Toxic Industrial Air Pollution in Georgia
Toxic Air Pollution by Sector
St
Toxic Air
Pllti
%of State Toxic
Electricity Generation
Paper Products
Chemicals
Stone, Clay, & Glass
S
ec
t
or
P
o
ll
u
ti
on
(lbs)
%
of
State
Toxic
Air Pollution
Electricity Generation 18,246,617 44%
Paper Products 9,962,289 24%
Chemicals 5,313,550 13%
Stone,
Clay,
&
Glass
Food & Beverages
Other
Stone, Clay, & Glass 5,192,392 12%
Food & Beverages 880,711 2%
Other 2,307,289 6%
Total 41,902,848 100%
Georgia Key Facts Top Power Plant Polluters
Toxic Air Pollution
Georgia’s electric sector ranked NINTH
in toxic air
p
ollution in 2009, emittin
g
over
All Toxics Mercury
Plant Name Owner(s)
Toxic Air Pollution (lbs)
Pollution
Control
Update?
pg
18.2 million pounds of harmful
chemicals, which accounted for 44% of
state pollution and 5% of toxic pollution
from all U.S. power plants.
Mercury Pollution
Harllee Branch Southern 6,155,089 266
Bow en Southern 5,431,270 264
●
Yates Southern 2,284,074 257
Wansley Southern, Oglethorpe & Others 1,738,841 79
●
Scherer Oglethorpe, Southern & Others 1,160,202 889
●
Georgia ranked 13th among all states in
mercury air pollution from power plants
with 1,950 pounds emitted in 2009,
which accounted for 82% of state
mercury air pollution and 3% of U.S.
electric sector pollution.
●
Jack McDonough Southern 643,347 90
Hammond Southern 371,277 64
McIntosh Southern 250,048 0
Kraft Southern 212,162 41
Mid-Georgia Cogeneration Perennial Pow er Holdings 300 0
Note: The possibility of already planned retirements or pollution controls at the listed plants may also reduce emissions in future years.
Sources: EPA’s Toxics Release Inventory (2009 data), accessed June 2011; EPA’s National Electric Energy Data System Database v.4.10 (2010).
Pollution controls have been installed since 2009 or are currently under construction. These investments should reduce emissions of mercury
and other toxic air pollutants in future years.
Toxic Industrial Air Pollution in North Carolina
Toxic Air Pollution by Sector
St
Toxic Air
Pllti
%of State Toxic
Electricity Generation
Paper Products
Chemicals
Food & Beverages
S
ec
t
or
P
o
ll
u
ti
on
(lbs)
%
of
State
Toxic
Air Pollution
Electricity Generation 14,907,994 49%
Paper Products 6,780,337 22%
Chemicals 3,325,752 11%
Food
&
Beverages
Wood Products
Other
Food & Beverages 1,025,463 3%
Wood Products 928,268 3%
Other 3,328,196 11%
Total 30,296,011 100%
North Carolina Key Facts Top Power Plant Polluters
Toxic Air Pollution
North Carolina’s electric sector ranked
10th in toxic air
p
ollution in 2009,
All Toxics Mercury
Plant Name Owner(s)
Toxic Air Pollution (lbs)
Pollution
Control
Update?
p
emitting about 14.9 million pounds of
harmful chemicals, which accounted for
49% of state pollution and 4% of toxic
pollution from all U.S. power plants.
Mercury Pollution
Cliffside Duke 3,516,790 141
●
L V Sutton Progress Energy 2,112,951 110
Lee Progress Energy 1,641,812 88
G G Allen Duke 1,431,792 114
●
Cape Fear Progress Energy 1,430,019 68
North Carolina ranked 23rd among all
states in mercury air pollution from power
plants with about 1,220 pounds emitted
in 2009, which accounted for 68% of
state mercury air pollution and 2% of
U.S. electric sector pollution.
Mayo Progress Energy & Others 1,000,178 96
●
Belew s Creek Duke 882,446 146
Marshall Duke 748,885 289
Riverbend Duke 548,850 31
Buck Duke 499,018 28
Note: The possibility of already planned retirements or pollution controls at the listed plants may also reduce emissions in future years.
Sources: EPA’s Toxics Release Inventory (2009 data), accessed June 2011; EPA’s National Electric Energy Data System Database v.4.10 (2010).
Pollution controls have been installed since 2009 or are currently under construction. These investments should reduce emissions of mercury
and other toxic air pollutants in future years.
Toxic Industrial Air Pollution in South Carolina
Toxic Air Pollution by Sector
St
Toxic Air
Pllti
%of State Toxic
Electricity Generation
Paper Products
Chemicals
Plastics & Rubber
S
ec
t
or
P
o
ll
u
ti
on
(lbs)
%
of
State
Toxic
Air Pollution
Electricity Generation 11,453,391 43%
Paper Products 7,927,152 30%
Chemicals 1,997,620 7%
Plastics
&
Rubber
Primary Metals
Other
Plastics & Rubber 1,136,434 4%
Primary Metals 950,644 4%
Other 3,308,798 12%
Total 26,774,040 100%
South Carolina Key Facts Top Power Plant Polluters
Toxic Air Pollution
South Carolina’s electric sector ranked
11th in toxic air
p
ollution in 2009,
All Toxics Mercury
Plant Name Owner(s)
Toxic Air Pollution (lbs)
Pollution
Control
Update?
p
emitting about 11.5 million pounds of
harmful chemicals, which accounted for
43% of state pollution and 3% of toxic
pollution from all U.S. power plants.
Mercury Pollution
Williams SCANA 3,010,392 157
●
Wateree SCANA 2,670,765 46
●
Cross Santee Cooper 1,115,336 114
Canadys Steam SCANA 947,934 39
H B Robinson Progress Energy 867,223 27
South Carolina ranked 31st among all
states in mercury air pollution from power
plants with nearly 560 pounds emitted in
2009, which accounted for 44% of state
mercury air pollution and 1% of U.S.
electric sector pollution.
Winyah Santee Cooper 762,052 57
Mc Meekin SCA NA 742,004 13
W S Lee Duke 504,476 27
Urquhart SCANA 340,940 23
Jefferies Santee Cooper 173,107 10
Note: The possibility of already planned retirements or pollution controls at the listed plants may also reduce emissions in future years.
Sources: EPA’s Toxics Release Inventory (2009 data), accessed June 2011; EPA’s National Electric Energy Data System Database v.4.10 (2010).
Pollution controls have been installed since 2009 or are currently under construction. These investments should reduce emissions of mercury
and other toxic air pollutants in future years.
Toxic Industrial Air Pollution in Alabama
Toxic Air Pollution by Sector
St
Toxic Air
Pllti
%of State Toxic
Paper Products
Electricity Generation
Chemicals
Stone, Clay, & Glass
S
ec
t
or
P
o
ll
u
ti
on
(lbs)
%
of
State
Toxic
Air Pollution
Paper Products 12,102,413 42%
Electricity Generation 11,418,246 40%
Chemicals 1,276,945 4%
Stone,
Clay,
&
Glass
Primary Metals
Other
Stone, Clay, & Glass 871,347 3%
Primary Metals 787,314 3%
Other 2,116,812 7%
Total 28,573,077 100%
Alabama Key Facts Top Power Plant Polluters
Toxic Air Pollution
Alabama’s electric sector ranked 12th in
toxic air
p
ollution in 2009, emittin
g
over
All Toxics Mercury
Plant Name Owner(s)
Toxic Air Pollution (lbs)
Pollution
Control
Update ?
pg
11.4 million pounds of harmful
chemicals, which accounted for 40% of
state pollution and 3% of toxic pollution
from all U.S. power plants.
Mercury Pollution
E C Gaston Southern 3,864,388 545
●
Widow s Creek Tennessee Valley Authority 1,565,453 83
●
Barry Southern 1,457,332 426
●
James H Miller Jr Southern & Others 1,042,448 1,206
●
Greene County Southern 1,013,924 403
Alabama ranked SIXTH among all states
in mercury air pollution from power plants
with over 3,170 pounds emitted in 2009,
which accounted for 79% of state
mercury air pollution and about 4% of
U.S. electric sector pollution.
Charles R Low man Pow erSouth Energy Cooperative 795,077 37
●
Colbert Tennessee Valley Authority 724,462 100
Gorgas Southern 705,991 272
Mobile Energy Services LLC DTE Energy 181,623 20
Gadsden Southern 67,548 82
Note: The possibility of already planned retirements or pollution controls at the listed plants may also reduce emissions in future years.
Sources: EPA’s Toxics Release Inventory (2009 data), accessed June 2011; EPA’s National Electric Energy Data System Database v.4.10 (2010).
Pollution controls have been installed since 2009 or are currently under construction. These investments should reduce emissions of mercury
and other toxic air pollutants in future years.
Toxic Industrial Air Pollution in Texas
Toxic Air Pollution by Sector
St
Toxic Air
Pllti
%of State Toxic
Chemicals
Electricity Generation
Petroleum Products
Paper Products
S
ec
t
or
P
o
ll
u
ti
on
(lbs)
%
of
State
Toxic
Air Pollution
Chemicals 16,028,305 41%
Electricity Generation 10,155,177 26%
Petroleum Products 5,544,041 14%
Paper
Products
Plastics & Rubber
Other
Paper Products 1,923,754 5%
Plastics & Rubber 1,404,543 4%
Other 4,386,331 11%
Total 39,442,151 100%
Texas Key Facts Top Power Plant Polluters
Toxic Air Pollution
Texas’s electric sector ranked 13th in
toxic air
p
ollution in 2009, emittin
g
nearl
y
All Toxics Mercury
Plant Name Owner(s)
Toxic Air Pollution (lbs)
Pollution
Control
Update ?
pgy
10.2 million pounds of harmful
chemicals, which accounted for 26% of
state pollution and about 3% of toxic
pollution from all U.S. power plants.
Mercury Pollution
Monticello Energy Future Holdings 3,622,494 1,063
Big Brow n Energy Future Holdings 1,679,568 1,362
Martin Lake Energy Future Holdings 930,935 1,566
W A Parish NRG 668,821 845
Limestone NRG 378,252 1,077
Texas ranked FIRST among all states in
mercury air pollution from power plants
with nearly 10,820 pounds emitted in
2009, which accounted for 85% of state
mercury air pollution and 15% of U.S.
electric sector mercury pollution.
Fa y et t e Pow er Pr oje
c
Austin Energy, Low er Colorado River Authority 327,122 380
●
San Miguel
Brazos Electric Pow er Coop., South Texas Electric
C
311,709 524
Harrington Xcel 296,703 290
Welsh AEP 288,273 462
Tolk Xcel 272,185 248
Note: The possibility of already planned retirements or pollution controls at the listed plants may also reduce emissions in future years.
Sources: EPA’s Toxics Release Inventory (2009 data), accessed June 2011; EPA’s National Electric Energy Data System Database v.4.10 (2010).
Pollution controls have been installed since 2009 or are currently under construction. These investments should reduce emissions of mercury
and other toxic air pollutants in future years.
Toxic Industrial Air Pollution in Virginia
Toxic Air Pollution by Sector
St
Toxic Air
Pllti
%of State Toxic
Electricity Generation
Paper Products
Chemicals
Primary Metals
S
ec
t
or
P
o
ll
u
ti
on
(lbs)
%
of
State
Toxic
Air Pollution
Electricity Generation 9,649,281 38%
Paper Products 6,488,679 26%
Chemicals 2,470,838 10%
Primary
Metals
Plastics & Rubber
Other
Primary Metals 1,418,573 6%
Plastics & Rubber 1,383,167 5%
Other 3,794,829 15%
Total 25,205,367 100%
Virginia Key Facts Top Power Plant Polluters
Toxic Air Pollution
Virginia’s electric sector ranked 14th in
toxic air
p
ollution in 2009, emittin
g
over
All Toxics Mercury
Plant Name Owner(s)
Toxic Air Pollution (lbs)
Pollution
Control
Update?
pg
9.6 million pounds of harmful
chemicals, which accounted for 38% of
state pollution and 3% of toxic pollution
from all U.S. power plants.
Mercury Pollution
Chesterfield Dominion 2,741,968 180
●
Chesapeake Dominion 2,023,315 140
Clinc h Riv er A EP 1,159,899 59
Yorktow n Dominion 1,056,592 89
Bremo Bluff Dominion 575,957 98
Virginia ranked 28th among all states in
mercury air pollution from power plants
with about 700 pounds emitted in 2009,
which accounted for 66% of state
mercury air pollution and 1% of U.S.
electric sector pollution.
Clover Dominion, Old Dominion Electric Coop. 361,555 15
Hopew ell Cogeneration SUEZ Energy 326,472 0
James River Cogeneration Cogentrix 292,404 17
●
DEGS of Narrow s LLC Duke 234,376 34
Glen Lyn AEP 217,028 15
Note: The possibility of already planned retirements or pollution controls at the listed plants may also reduce emissions in future years.
Sources: EPA’s Toxics Release Inventory (2009 data), accessed June 2011; EPA’s National Electric Energy Data System Database v.4.10 (2010).
Pollution controls have been installed since 2009 or are currently under construction. These investments should reduce emissions of mercury
and other toxic air pollutants in future years.
Toxic Industrial Air Pollution in Tennessee
Toxic Air Pollution by Sector
St
Toxic Air
Pllti
%of State Toxic
Electricity Generation
Chemicals
Paper Products
Plastics & Rubber
S
ec
t
or
P
o
ll
u
ti
on
(lbs)
%
of
State
Toxic
Air Pollution
Electricity Generation 8,864,747 35%
Chemicals 5,489,828 22%
Paper Products 3,226,994 13%
Plastics
&
Rubber
Food & Beverages
Other
Plastics & Rubber 2,975,428 12%
Food & Beverages 996,002 4%
Other 3,517,571 14%
Total 25,070,569 100%
Tennessee Key Facts Top Power Plant Polluters
Toxic Air Pollution
Tennessee’s electric sector ranked 15th
in toxic air
p
ollution in 2009, emittin
g
All Toxics Mercury
Plant Name Owner(s)
Toxic Air Pollution (lbs)
Pollution
Control
Update ?
pg
nearly 8.9 million pounds of harmful
chemicals, which accounted for 35% of
state pollution and 2% of toxic pollution
from all U.S. power plants.
Mercury Pollution
Cumberland Tennessee Valley Authority 3,598,226 140
Johnsonville Tennessee Valley Authority 2,187,147 190
Kingston Tennessee Valley Authority 1,072,082 100
●
Allen Steam Plant Tennessee Valley Authority 917,939 190
John Sevier Tennessee Valley Authority 574,036 240
Tennessee ranked 24th among all states
in mercury air pollution from power plants
with about 1,170 pounds emitted in
2009, which accounted for 70% of state
mercury air pollution and 2% of U.S.
electric sector pollution.
Pollution controls have been installed since 2009 or are currently under construction. These investments should reduce emissions of mercury
and other toxic air pollutants in future years.
Gallatin Tennessee Valley Authority 280,414 280
Bull Run Tennessee Valley Authority 234,902 33
Note: The possibility of already planned retirements or pollution controls at the listed plants may also reduce emissions in future years.
Sources: EPA’s Toxics Release Inventory (2009 data), accessed June 2011; EPA’s National Electric Energy Data System Database v.4.10 (2010).
Toxic Industrial Air Pollution in Missouri
Toxic Air Pollution by Sector
St
Toxic Air
Pllti
%of State Toxic
Electricity Generation
Plastics & Rubber
Transportation Equipment
Chemicals
S
ec
t
or
P
o
ll
u
ti
on
(lbs)
%
of
State
Toxic
Air Pollution
Electricity Generation 6,360,329 53%
Plastics & Rubber 1,767,336 15%
Transportation Equipment 1,270,931 11%
Chemicals
Food & Beverages
Other
Chemicals 633,995 5%
Food & Beverages 529,517 4%
Other 1,449,518 12%
Total 12,011,626 100%
Missouri Key Facts Top Power Plant Polluters
Toxic Air Pollution
Missouri’s electric sector ranked 16th in
toxic air
p
ollution in 2009, emittin
g
nearl
y
All Toxics Mercury
Plant Name Owner(s)
Toxic Air Pollution (lbs)
Pollution
Control
Update?
pgy
6.4 million pounds of harmful
chemicals, which accounted for 53% of
state pollution and 2% of toxic pollution
from all U.S. power plants.
Mercury Pollution
Sioux Ameren 2,344,989 306
●
Labadie Ameren 740,546 1,297
Asbury Empire District Electric Co 542,499 32
Columbia City of Columbia 540,092 3
Thomas Hill Associated Electric Coop 372,062 270
Missouri ranked FIFTH among all states
in mercury air pollution from power plants
with nearly 3,640 pounds emitted in
2009, which accounted for 87% of state
mercury air pollution and 5% of U.S.
electric sector pollution.
New Madrid Associated Electric Coop 335,140 150
Rush Island Ameren 271,242 553
Mer amec A me r en 213 ,271 336
Montrose Great Plains Energy 211,659 129
Sibley Great Plains Energy 170,590 46
Note: The possibility of already planned retirements or pollution controls at the listed plants may also reduce emissions in future years.
Sources: EPA’s Toxics Release Inventory (2009 data), accessed June 2011; EPA’s National Electric Energy Data System Database v.4.10 (2010).
Pollution controls have been installed since 2009 or are currently under construction. These investments should reduce emissions of mercury
and other toxic air pollutants in future years.
Toxic Industrial Air Pollution in Illinois
Toxic Air Pollution by Sector
St
Toxic Air
Pllti
%of State Toxic
Electricity Generation
Chemicals
Plastics & Rubber
Food & Beverages
S
ec
t
or
P
o
ll
u
ti
on
(lbs)
%
of
State
Toxic
Air Pollution
Electricity Generation 5,583,222 23%
Chemicals 4,923,597 21%
Plastics & Rubber 4,388,135 18%
Food
&
Beverages
Petroleum Products
Other
Food & Beverages 4,117,318 17%
Petroleum Products 1,364,353 6%
Other 3,540,391 15%
Total 23,917,015 100%
Illinois Key Facts Top Power Plant Polluters
Toxic Air Pollution
Illinois’s electric sector ranked 17th in
toxic air
p
ollution in 2009, emittin
g
nearl
y
All Toxics Mercury *
Plant Name Owner(s)
Toxic Air Pollution (lbs)
Pollution
Control
Update?
pgy
5.6 million pounds of harmful
chemicals, which accounted for 23% of
state pollution and 1% of toxic pollution
from all U.S. power plants.
Mercury Pollution
Baldw in Energy Complex Dynegy 889,111 320
●
Coffeen Ameren 521,774 214
●
Tuscola Station SUEZ Energy, Duke 507,528 18
New ton Ameren 488,098 360
●
Pow erton Edison International 443,992 136
Illinois ranked EIGHTH among all states
in mercury air pollution from power plants
with about 2,680 pounds emitted in
2009, which accounted for 79% of state
mercury air pollution and 4% of U.S.
electric sector pollution.
Kincaid Generation LLC Dominion 417,693 233
Joliet 29 Edison International 372,260 212
Joppa Steam Ameren, PPL 278,049 259
●
Dallman City of Springfield 244,559 17
Will County Edison International 241,913 168
Note: The possibility of already planned retirements or pollution controls at the listed plants may also reduce emissions in future years.
Sources: EPA’s Toxics Release Inventory (2009 data), accessed June 2011; EPA’s National Electric Energy Data System Database v.4.10 (2010).
* State has enacted stringent mercury control regulations for the electric sector.
Pollution controls have been installed since 2009 or are currently under construction. These investments should reduce emissions of mercury
and other toxic air pollutants in future years.
Toxic Industrial Air Pollution in Wisconsin
Toxic Air Pollution by Sector
St
Toxic Air
Pllti
%of State Toxic
Paper Products
Electricity Generation
Chemicals
Fabricated Metals
S
ec
t
or
P
o
ll
u
ti
on
(lbs)
%
of
State
Toxic
Air Pollution
Paper Products 6,306,109 49%
Electricity Generation 3,451,772 27%
Chemicals 825,613 6%
Fabricated
Metals
Plastics & Rubber
Other
Fabricated Metals 557,403 4%
Plastics & Rubber 392,729 3%
Other 1,276,555 10%
Total 12,810,181 100%
Wisconsin Key Facts Top Power Plant Polluters
Toxic Air Pollution
Wisconsin’s electric sector ranked 18th
in toxic air
p
ollution in 2009, emittin
g
All Toxics Mercury *
Plant Name Owner(s)
Toxic Air Pollution (lbs)
Pollution
Control
Update ?
pg
nearly 3.5 million pounds of harmful
chemicals, which accounted for 27% of
state pollution and about 1% of toxic
pollution from all U.S. power plants.
Mercury Pollution
Alma Dairyland Pow er Coop 832,523 72
Nelson Dew ey Alliant Energy 551,245 40
Columbia Alliant Energy, Integrys, Madison Gas & Electric 410,088 626
Valley Wisconsin Energy 386,718 5
Pleasant Prairie Wisconsin Energy 347,319 527
Wisconsin ranked 12th among all states
in mercury air pollution from power plants
with nearly 2,000 pounds emitted in
2009, which accounted for 91% of state
mercury air pollution and 3% of U.S.
electric sector pollution.
Genoa Dairyland Pow er Coop 237,993 38
●
Edgew ater Alliant Energy & Others 207,681 177
South Oak Creek Wisconsin Energy 167,200 190
Weston Integrys, Dairyland Pow er Coop. 88,445 190
●
Pulliam Integrys 58,663 100
●
Note: The possibility of already planned retirements or pollution controls at the listed plants may also reduce emissions in future years.
Sources: EPA’s Toxics Release Inventory (2009 data), accessed June 2011; EPA’s National Electric Energy Data System Database v.4.10 (2010).
* State has enacted stringent mercury control regulations for the electric sector.
Pollution controls have been installed since 2009 or are currently under construction. These investments should reduce emissions of mercury
and other toxic air pollutants in future years.
●
Toxic Industrial Air Pollution in New Hampshire
Toxic Air Pollution by Sector
St
Toxic Air
Pllti
%of State Toxic
Electricity Generation
Paper Products
Textiles
Plastics & Rubber
S
ec
t
or
P
o
ll
u
ti
on
(lbs)
%
of
State
Toxic
Air Pollution
Electricity Generation 2,519,676 96%
Paper Pr oduc t s 3 1 , 0 5 1 1 %
Textiles 24,793 1%
Plastics
&
Rubber
Primary Metals
Other
Plastics & Rubber 18,829 1%
Primary Metals 18,527 1%
Other 20,267 1%
Total 2,633,143 100%
New Hampshire Key Facts Top Power Plant Polluters
Toxic Air Pollution
New Hampshire’s electric sector ranked
19th in toxic air
p
ollution in 2009,
All Toxics Mercury
Plant Name Owner(s)
Toxic Air Pollution (lbs)
Pollution
Control
Update?
p
emitting over 2.5 million pounds of
harmful chemicals, which accounted for
96% of state pollution and about 1% of
toxic pollution from all U.S. power plants.
Mercury Pollution
Merrimack Public Service Co of NH 2,254,216 160
●
Schiller Public Service Co of NH 223,866 15
New ington Public Service Co of NH 29,604 1
NAEA New ington Pow er North American Energy Alliance 11,271 0
Indeck Alexandria Indeck 720 0
New Hampshire ranked 38th among all
states in mercury air pollution from power
plants with 175 pounds emitted in 2009,
which accounted for 99% of state
mercury air pollution and less than 1% of
U.S. electric sector pollution.
Pollution controls have been installed since 2009 or are currently under construction. These investments should reduce emissions of mercury
and other toxic air pollutants in future years.
Note: The possibility of already planned retirements or pollution controls at the listed plants may also reduce emissions in future years.
Sources: EPA’s Toxics Release Inventory (2009 data), accessed June 2011; EPA’s National Electric Energy Data System Database v.4.10 (2010).
Toxic Industrial Air Pollution in Iowa
Toxic Air Pollution by Sector
St
Toxic Air
Pllti
%of State Toxic
Food & Beverages
Chemicals
Primary Metals
Electricity Generation
S
ec
t
or
P
o
ll
u
ti
on
(lbs)
%
of
State
Toxic
Air Pollution
Food & Beverages 4,216,459 27%
Chemicals 3,945,660 26%
Primary Metals 2,708,784 18%
Electricity
Generation
Plastics & Rubber
Other
Electricity Generation 2,486,771 16%
Plastics & Rubber 574,086 4%
Other 1,438,910 9%
Total 15,370,670 100%
Iowa Key Facts Top Power Plant Polluters
Toxic Air Pollution
Iowa’s electric sector ranked 20th in toxic
air
p
ollution in 2009, emittin
g
nearl
y
2.5
All Toxics Mercury
Plant Name Owner(s)
Toxic Air Pollution (lbs)
Pollution
Control
Update ?
pgy
million pounds of harmful chemicals,
which accounted for 16% of state
pollution and less than 1% of toxic
pollution from all U.S. power plants.
Mercury Pollution
George Neal North MidAmerican, Alliant Energy 801,266 400
George Neal South MidAmerican, Alliant Energy & Others 489,297 260
Walter Scott Jr Energy Center MidAmerican & Others 348,970 340
●
Ottumw a MidAmerican, Alliant Energy 192,948 323
Fair Station Central Iow a Pow er Cooperative 118,446 16
Iowa ranked 11th among all states in
mercury air pollution from power plants
with about 2,220 pounds emitted in
2009, which accounted for 83% of state
mercury air pollution and about 3% of
U.S. electric sector pollution.
A mes Ele c tr ic Ser v ic e s Pow er Pl
a
Ames City of 113,969 17
Lansing Alliant Energy 93,872 167
●
Riverside MidAmerican 93,330 40
Burlington Alliant Energy 59,603 132
Muscatine Plant #1
Board of Water Electric &
43,401 120
Note: The possibility of already planned retirements or pollution controls at the listed plants may also reduce emissions in future years.
Sources: EPA’s Toxics Release Inventory (2009 data), accessed June 2011; EPA’s National Electric Energy Data System Database v.4.10 (2010).
Pollution controls have been installed since 2009 or are currently under construction. These investments should reduce emissions of mercury
and other toxic air pollutants in future years.
C
Appendix: State Summary Table
State
Electric Sector Rank
by In-State Toxic Air
Pollution
Total Industrial
Toxic Air Pollution
(lbs)
Ele ctr ic Se ctor
Toxic Air Pollution
(lbs)
Ele ctr ic Se ctor
Contribution to State
Toxic Air Pollution (%)
Status of State
Mercury Regulations
Alabama 2 28,573,077 11,418,246 40%
Alaska 1 159,463 60,487 38%
Arizona 1 2,126,315 907,173 43%
Arkansas 2 11,117,456 1,366,705 12%
California 7 7,447,971 273,998 4%
Colorado 1 1,702,504 917,925 54%
●
Connecticut 2 1,522,453 404,466 27%
●
Delaw are 1 3,054,356 2,430,253 80%
●
Dis tr ic t of Columbia 1 4 3 59%
Florida 1 49,039,948 33,442,431 68%
Georgia 1 41,902,848 18,246,617 44%
●
Haw aii 1 1,984,530 1,819,678 92%
Idaho 15 2,586,572 0 0%
Illinois 1 23,917,015 5,583,222 23%
●
Indiana 1 39,634,894 26,798,135 68%
Iow a 4 15,370,670 2,486,771 16%
Kansas 3 6,275,444 995,054 16%
Kentucky 1 41,340,348 31,947,066 77%
Louisiana 4 34,505,184 1,393,764 4%
Maine 15 2,66 4, 694 6 0%
Maryland 1 29,887,235 27,092,233 91%
●
Massachusetts 1 2,578,736 1,768,347 69%
●
Michigan 1 31,276,291 22,731,782 73%
●
Minnesota 2 6,959,957 1,063,733 15%
●
Mississippi 3 13,127,345 2,026,087 15%
State has an electric sector mercury regulation that is at least as stringent as EPA’s proposed utility air toxics rule.
State has an electric sector mercury regulation that is less stringent than EPA’s proposed utility air toxics rule.
Sources: EPA’s Toxic Release Inventory (2009 data), accessed June 2011; State environmental departments.
Missouri 1 12,011,626 6,360,329 53%