Air pollution at street level in European cities docx
Bạn đang xem bản rút gọn của tài liệu. Xem và tải ngay bản đầy đủ của tài liệu tại đây (1.05 MB, 52 trang )
ISSN 1725-2237
Air pollution at street level
in European cities
EEA Technical report No 1/2006
EEA Technical report No 1/2005
Air pollution at street level
in European cities
Cover: EEA
Layout: EEA
Legal notice
The contents of this publication do not necessarily reflect the official opinions of the European
Commission or other institutions of the European Communities. Neither the European Environment
Agency nor any person or company acting on behalf of the Agency is responsible for the use that
may be made of the information contained in this report.
All rights reserved
No part of this publication may be reproduced in any form or by any means electronic or mechanical,
including photocopying, recording or by any information storage retrieval system, without the
permission in writing from the copyright holder. For translation or reproduction rights please contact
EEA (address information below).
Information about the European Union is available on the Internet. It can be accessed through the
Europa server ().
Luxembourg: Office for Official Publications of the European Communities, 2006
ISBN 92-9167-815-5
ISSN 1725-2237
© EEA, Copenhagen 2006
European Environment Agency
Kongens Nytorv 6
1050 Copenhagen K
Denmark
Tel.: +45 33 36 71 00
Fax: +45 33 36 71 99
Web: www.eea.eu.int
Enquiries: www.eea.eu.int/enquiries
3
Contents
Air pollution at street level in European cities
Contents
Acknowledgements 4
Executive summary 5
1 Introduction
7
2 Methodology
9
3 Emissions
10
4 Urban and local scale air quality
11
4.1 Reference year (2000) and validation against measurements 11
4.2 Scenarios 25
5 Conclusions and future work
31
6 References
33
Annex A 35
SEC project layout 35
Annex B 38
Annex C 44
Emissions calculations 44
C1 Urban scale 44
C2 Local scale 44
Annex D 48
Air pollution at street level in European cities
4
Acknowledgements
This report was prepared by the European
Environment Agency and its European Topic Centre
on Air and Climate Change. The contributing
authors were Nicolas Moussiopoulos,
Zissis Samaras, Liana Kalognomou,
Myrto Giannouli, Sofia Eleftheriadou and
Giorgos Mellios from the Aristotle University,
Thessaloniki, Greece.
The EEA project manager was Jaroslav Fiala; the
ETC/ACC task leader was Nicolas Moussiopoulos.
The important comments and suggestions by
André Jol, Jaroslav Fiala and André Zuber as well
as other staff of EEA and DG Environment in the
final preparation phase of this report are gratefully
acknowledged. Many thanks also to the national
focal points and other country representatives for
their useful comments.
Acknowledgements
5
Executive summary
Air pollution at street level in European cities
Executive summary
Traffic-related air pollution is still one of the most
pressing problems in urban areas. Evidence of the
adverse health effects of fine particulate matter
is continuously emerging and it is alarming that
most of the traffic-related emissions are in the
fine particulates range (< PM
2.5
). Human exposure
to increased pollutant concentrations in densely
populated urban areas is high. The improvement of
air quality is therefore imperative. Air quality limit
values, which are aimed at protecting public health,
are frequently exceeded especially in streets and
other urban hotspots.
This report studies the air pollution levels at traffic
hotspot areas in 20 European cities compared to the
urban background concentrations for NO
2
, NO
X
,
PM
10
and PM
2.5
. To analyse and project air quality
both the current situation (reference year 2000) and
two scenarios aimed at 2030 (Current Legislation,
CLE, and Maximum Feasible Reductions, MFR)
were considered. The methodology applied
in the report was developed in the ETC/ACC
'Street Emission Ceiling (SEC)' project. It aims to
determine which local emission reductions are
needed in streets in order to reach certain air quality
thresholds. At its present stage of development,
the SEC methodology allows analysis of air quality
scenario projections at street level, and considers
particular policies and measures at regional, urban
and street scales.
Urban background concentrations were calculated
for 20 European cities using the urban scale model
OFIS. Regional background levels were derived
from EMEP model results. For the reference year, the
results of OFIS agree fairly well with corresponding
Airbase measurement data. Reduced urban
background air quality levels were obtained for both
future scenarios studied. The largest improvement
was for the MFR scenario.
Street increments (i.e. differences between street and
urban background concentrations) were calculated
using the street scale model OSPM. The modelled
street increments vary from city to city because of
street canyon geometry, wind direction and speed
assumed. They are also defined by urban emission
levels that lead to lower or higher urban background
concentrations and by the vehicle fleet composition
that gives lower or higher street scale emissions.
Street level concentrations were calculated for
three hypothetical street canyon configurations
— wide, square and narrow. These are considered to
represent a reasonable range of street canyon types
across Europe. Assuming the same daily traffic load
(20 000 vehicles per day) crossing the three types,
the highest street increments are computed for the
narrow canyon as its configuration leads to trapping
of air pollutants inside the street.
Results for the reference year and a narrow canyon
located in the centre of the city correspond well
with observed street increments. The latter are
found to decrease significantly in both scenarios; the
maximum reduction resulting for the MFR scenario.
OFIS and OSPM model results were further
analysed to discuss air quality limit value
exceedances in the 20 European cities considered.
Overall, the picture resulting for the narrow canyon
situation in the reference year 2000 corresponds
reasonably with the observations of both NO
2
and
PM
10
. The exceedance days calculated for PM
10
in
2000 (according to the 2005 limit value, i.e. daily
average of 50 μg/m
3
not to be exceeded more than
35 days a year) are higher than permitted in almost
all cities in the narrow canyon, in 14 cities in the
square canyon and in half the cities in the wide
canyon case. It should however be noted that the
aspect ratio considered for the wide canyon case
is rather large and probably beyond the range of
applicability of the OSPM model.
For the 2030 air quality projection, the results imply
that at street level and for a narrow canyon the
annual limit value (
1
) for NO
2
will be met in only
very few cases for the CLE scenario and in most
cases for the MFR scenario. However, the indicative
limit value for PM
10
is not expected to be met even
in the MFR scenario. The permitted number of
exceedances, according to the 2010 limit value,
is expected to be met for NO
2
in all cities for the
narrow canyon case including in the CLE scenario.
However, exceedances of the PM
10
indicative limit
(
1
) According to Directive 1999/30/EC, in 2010 the limit values to be met for NO
2
are 40 μg/m
3
(annual average) and 200 μg/m
3
(hourly average not to be exceeded more than 18 times a year) whereas for PM
10
the indicative limit values are 20 μg/m
3
(annual
average) and 50 μg/m
3
(daily average not to be exceeded more that 7 days a year).
Air pollution at street level in European cities
6
Executive summary
value are observed in certain cases including the
MFR scenario. For PM
2.5
the reduction is in line
with the significant reductions in the urban and
in the street scale PM emissions attributed to the
introduction of Euro V and Euro VI compliant
vehicles.
Overall, the model results compare well with
measurements, given the restrictions imposed by
the similarity of the actual street canyon in which
the measurements are made and the hypothetical
street canyon configuration (traffic characteristics,
street canyon location and geometry, etc.). For
this reason, particularly unfavourable cases
observed in certain cities, where exceptionally high
concentrations are recorded, are difficult to model
unless the specific street characteristics are known
in detail. Detailed local traffic data combined with
air quality measurements and data on the specific
street are required in order to evaluate the overall
methodology of this report. These are also necessary
to determine the appropriateness of the selection
of the particular street canyon configurations.
The urban background concentrations produced
with the available top-down emission inventories
should be compared to up-to-date, bottom-up local
emission inventories, where these are available. By
doing this, local city development scenarios can also
be evaluated. Finally, reliable vehicle fleets for new
and non EU Member States are required in order to
obtain accurate street level air quality projections
for these cities, according to the latest version of
TREMOVE.
7
Introduction
Air pollution at street level in European cities
To assist the cost-effectiveness analysis of policy
proposals for revised air quality legislation,
the Clean Air for Europe programme (CAFE)
specifically developed instruments combining
state-of-the-art scientific models with validated
databases which represented the situations of all
Member States and economic sectors. The RAINS
integrated assessment model was used to develop
and analyse policy scenarios. The integrated
assessment approach focuses on regional scale
pollutant concentrations in Europe and primarily
deals with long-range transport and the impact
on vegetation and ecosystems. This is also in
accordance with the analyses needed for the
Convention on Long-range Transboundary Air
Pollution. As ambient concentrations of certain
air pollutants show strong variability at a much
finer scale (e.g. urban and local scale), the CAFE
programme also aims to address these air quality
issues.
Within the framework of CAFE, the City-Delta
project invited the scientific community to study
the urban contribution to air pollution as estimated
by regional scale models. The aim was to identify
and quantify the factors that lead to systematic
differences between urban and rural background
air pollution concentrations. Useful functional
relationships were developed within City-Delta
which allow the determination of urban air
quality levels as a function of rural background
concentrations and local factors. As a limitation,
however, these functional relationships are at
present applicable only to the annual mean of the
anthropogenic part of PM
2.5
(Cuvelier et al., 2004).
Funded by DG Research under the 5th Framework
Programme, the MERLIN project studied the
influence of effective regional air pollution
abatement strategies to urban air quality, and how
sufficient these may be in achieving compliance
with both in-force and future limit values. The
major contribution of urban emissions to urban
scale pollution was confirmed which showed the
need to address the design of air quality abatement
strategies on an urban scale. The OFIS model was
applied in the context of both the City-Delta and the
MERLIN projects. This allowed for the assessment
of the model's performance, while at the same time
1 Introduction
comparing the model results against measurements
and the results of other models. The conclusion
from both projects was that OFIS is a useful tool for
investigating current and future air quality at the
urban scale.
The basis for most current valid air quality
standards are statistical correlations between the
findings of epidemiological studies and measured
urban background air pollution levels. Therefore,
it should be considered as a success that current air
quality assessment tools are capable of describing
adequately urban background concentrations of
regulated air pollutants. However, the majority of
the urban population also spends a considerable
amount of time in streets, which is a typical example
of urban hotspots. Limit values also apply to these
hotspots, where measurements across Europe show
that air quality close to areas with increased traffic
is of particular concern (e.g. EEA fact sheet
TERM 04, 2004). Finer local-scale models are
required to study air quality in streets. The work
of van den Hout and Teeuwisse (2004) revealed the
difficulty of classifying the various types of streets
across European cities. Given that the particular
hotspot characteristics significantly affect air
pollutant concentrations, it considers the various
street geometries and traffic parameters.
Since 2003, the European Environment Agency
(EEA) has been funding the Street Emission
Ceilings (SEC) project within the work programme
of the European Topic Centre on Air and Climate
Change (ETC/ACC). The main aim of SEC is to
study street level air quality and to develop model
assessment systems that may be used for integrated
assessment purposes. At the same time, the study
must also meet the needs of local authorities. Such
systems should allow for the assessment of current
air quality and future scenario projections, while
considering focused policies and measures for the
regional, urban and street scales (Annex A).
This report aims to use the expertise gained in SEC
to provide an estimate of hotspot air pollution levels
that occur at local scale within cities as compared to
the urban background concentration levels. Annual
NO
2
, NO
X
, PM
10
and PM
2.5
values and daily or
Air pollution at street level in European cities
8
Introduction
hourly exceedances are covered where applicable.
Both the reference year situation and scenario
projections are taken into account, while the multi-
scale model application allows the description of
the impact of particular policies and measures at the
regional, urban and street scales. As an option, the
approach suggested may be used to assess the effect
of local measures on air quality at the urban and
local scales.
The OFIS model was used to calculate urban
background concentrations. The satisfactory
performance of OFIS was demonstrated in the
MERLIN and City-Delta projects and by the
successful application of the EMEP/OFIS/OSPM
sequence in SEC. The aforementioned limitations of
the functional relationships developed in the
City-Delta project were also taken into account.
9
Methodology
Air pollution at street level in European cities
The methodology followed in calculating air
pollution levels at hotspot areas across European
cities largely follows the findings and the work
performed during 2003–2004 in the ETC/ACC SEC
project (Annex A). The work presented in this report
follows the description included in the ETC/ACC
2005 Implementation Plan, task 4.4.1.3, 'Support of
the CAFE programme regarding air pollution levels
at hotspots'. Any additional details/clarifications
were discussed with the CAFE Programme
representatives.
Therefore, the methodology used to assess the
impact of street scale emissions on the hotspot air
pollution levels consists of:
(a) the urban scale — OFIS model (Arvanitis and
Moussiopoulos, 2003). This is driven by results
of the EMEP model (URL1) — concentrations
and meteorological data — in order to obtain the
urban background
(b) the local scale — OSPM model (Berkowicz et al.,
1997). This is driven by OFIS model results for
estimating hotspot air pollution levels.
The results included in the report are for NO
2
,
NO
X
, PM
10
and PM
2.5
. For the reference year,
validation of model results has been performed
against measurements available in Airbase (URL 2).
Due to lack of sufficient data for certain cities and
certain pollutants, data from the years 2001, 2002
and in some cases 2003 were used (see Annex B —
additional details are available upon request). They
represent good approximations for the level of the
concentrations measured in 2000. For the projection
of the street increments, a baseline (Current
Legislation) and Maximum Feasible Reductions
(MFR) scenario for the year 2030 are used. These are
defined in Cofala et al. (2005).
2 Methodology
Urban emission inventories were required as input
for the OFIS model. A top-down approach was used
with inventories developed in the MERLIN project
for 20 cities (
2
). For local air quality analysis, specific
street canyon characteristics were required in order
to define particular case studies (types of streets) in
each city. Due to the absence of such detailed data
for street types across Europe, a generic approach
was applied. The hypothetical street canyons for
which the OSPM model was applied were defined
from the 'Typology Methodology'. This represents a
first attempt to categorise street types according to
various parameters and parameter ranges
(van den Hout and Teeuwisse, 2004). TREMOVE
(De Ceuster et al., 2005) and TRENDS (Giannouli
et al., 2005) models were used to calculate the vehicle
fleet data, and local emissions are then calculated
with the COPERT 3 emission model (Ntziachristos
et al., 2000).
Annual average concentrations and annual deltas
(or 'street increments', i.e. the difference between
the street and the urban background concentrations)
were calculated for NO
2
, NO
X
, PM
10
and PM
2.5
for the
20 cities. Hourly NO
2
and daily PM
10
exceedances,
as these are defined by the relevant legislation,
were also calculated for the 20 cities. Based on the
Typology Methodology report, hotspot air quality
analysis was performed for the two specified urban
canyon geometries (square and wide cases). In
addition, a third geometry representing a narrow
street canyon was also considered. The data
available allowed for the analysis of a reference
year (2000) and two alternatives for the year 2030:
the Current Legislation and Maximum Feasible
Reduction scenarios (
3
) described in detail elsewhere
(Cofala et al., 2005). As requested by CAFE
representatives, compatibility with the TREMOVE
model was ensured throughout the report and
comparison of model results against observations is
presented as far as possible.
(
2
) Antwerp, Athens, Barcelona, Berlin, Brussels, Budapest, Copenhagen, Gdansk, Graz, Helsinki, Katowice, Lisbon, London, Marseilles,
Milan, Paris, Prague, Rome, Stuttgart and Thessaloniki.
(
3
) Assumptions on technologies adopted and efficiencies of control technologies in the MFR scenario are available from the RAINS
website: under the scenario CP_MFR_Nov04(Nov04).
Air pollution at street level in European cities
10
Emissions
Gridded urban emission inventories for the
reference year 2000 were prepared by Stuttgart
University, Institute of Energy Economics and the
Rational Use of Energy (IER) within the framework
of MERLIN, using the European Emission model
(Friedrich and Reis, 2004; Schwarz, 2002; Wickert,
2001) The emission inventories were made available
for the aforementioned 20 urban areas.
The urban emission projections for the year 2030
were predicted according to the emission control
scenarios LGEP-CLE and LGEP-MFR (Cofala
et al., 2005). This gave appropriate sectoral emissions
(Cofala, 2004). Since information of this type was
only available at country level and not at city
level, the emission reductions were calculated for
each country (Austria, Belgium, Czech Republic,
Denmark, Finland, France, Germany, Greece,
Hungary, Italy, Poland, Portugal, Spain, United
Kingdom), SNAP category (SNAP 1 to 10 as
described in Annex C, table C1) and pollutant
(NO
X
, VOC, SO
2
, NH3, PM
10
and PM
2.5
) for the year
2030. The emission reductions at urban level were
3 Emissions
then considered equal to those at country level.
This gave the urban emissions per pollutant and
SNAP category for the year 2030. Details on the
methodology followed may be found in Annex C.
Vehicle fleets extracted from TRENDS (Giannouli
et al., 2005) and TREMOVE (De Ceuster et al.,
2005) models were used in order to calculate
reference year local (street) emissions with COPERT
(Ntziachristos et al., 2000) for a narrow street canyon.
A narrow street canyon was assumed to have an
average daily traffic of 20 000 vehicles (see Annex
C, table C4). Generic values were used for the
remaining parameters (vehicle speed, percentage of
heavy-duty vehicles in the fleet — henceforth:
HDV % —, street canyon geometry etc.). For
consistency reasons, these values were assumed
to coincide with those defined in the Typology
Methodology for urban canyons (van den Hout
and Teeuwisse, 2004). The methodology adopted
for the calculation of local scale emissions is further
described in Annex C of this report.
11
Urban and local scale air quality
Air pollution at street level in European cities
4 Urban and local scale air quality
In this section, current and future air quality
at urban and street scale in 20 European cities
is investigated in terms of the annual mean
concentrations for NO
2
, NO
X
, PM
10
and PM
2.5
, and
exceedances of the hourly and daily 2010 limit
values for NO
2
and PM
10
respectively. The model
simulations were performed with the multi-scale
model cascade EMEP/OFIS/OSPM (Arvanitis and
Moussiopoulos, 2003; Berkowicz et al., 1997). This
approach allows a complete analysis of both the
reference year situation and scenario projections as
the impact of air pollution control strategies and
measures are accounted for at all relevant scales
(regional, urban and street scale).
4.1 Reference year (2000) and
validation against measurements
4.1.1 Urban air quality
In Figures 4.1 to 4.5 OFIS model results for the
reference year 2000 are compared to Airbase data
for NO
2
, NO
X
, PM
10
and as far as possible PM
2.5
using urban and suburban background station
measurements. To account for the variability in the
background concentrations in each city, the figures
show the ranges for both observations and model
results. As expected, the model predicts maximum
values for all pollutants (NO
2
, NO
X
, PM
10
and PM
2.5
)
in the city centre. For cities where there is only one
station available, it is not possible to define such
a range. Furthermore, the concentration observed
at the particular location should be treated as
indicative. The appropriateness of the reported
background concentrations depends upon the
number and types of stations in each city. The issue
of 'how well they represent population exposure'
should also be considered. In Figures 4.1 to 4.4 the
average value of all stations in each city (noted as
average in the graphs) is also shown for comparison.
A full list of stations used in this analysis can be
found in Annex B.
Figure 4.1 Mean annual NO
2
urban background concentrations (μg/m
3
) in 20 European cities:
range of OFIS model results for the reference year 2000 compared to the range of
observations and average value of all stations
A
N
TW
A
TH
E
B
AR
C
B
ER
L
B
R
U
S
B
U
D
A
CO
PE
G
D
A
N
G
R
A
Z
H
EL
S
K
A
T
O
LIS
B
LO
N
D
M
AR
S
M
ILA
PA
R
I
PR
A
G
R
O
M
E
S
TU
T
TH
E
S
0
10
20
30
40
50
60
70
80
Concentration (µg/m³)
OFIS
Measurements
Average
Air pollution at street level in European cities
Urban and local scale air quality
12
For the NO
2
concentrations, there is clear agreement
between OFIS model results and urban background
measurements. The spread of the OFIS values
mostly overlaps the spread in the measured
data, though in some cases the maximum value
is overestimated by the model. Good agreement
with measurements is also obtained in the case of
NO
X
, though in some cases an underestimation is
observed. OFIS generally refines the regional model
results, thus leading to a better estimate of the
urban background NO
2
and NO
X
concentrations.
As an exception to this very satisfactory general
agreement, a large discrepancy between model
results and observations is detected for Graz
and Marseilles (Figure 4.1). This is due to an
underestimation of the urban NO
X
emissions which
results from the application of a top-down approach
(from NUTS 3 down to the domain of interest) of
the European emission model (Friedrich and Reis,
2004; Schwarz, 2002; Wickert, 2001). The European
emission model produces gridded emission
inventories. A better result would have occurred
for the emission inventory if a bottom-up approach
(emission inventory using local data) had been used.
Figure 4.2 Mean annual NO
X
urban background concentrations (μg/m
3
) in 20 European cities:
range of OFIS model results for the reference year 2000 compared to the range of
observations and average value of all stations
0
20
40
60
80
100
120
140
160
180
200
220
240
0
20
40
60
80
100
120
140
160
180
200
220
240
Concentration (µg/m³)
ANTW
ATHE
BARC
BERL
BRUS
BUDA
COPE
GDAN
GRAZ
HELS
KATO
LISB
LOND
MARS
MILA
PARI
PRAG
ROME
STUT
THE
S
OFIS Measurements
Average
Urban and local scale air quality
Air pollution at street level in European cities
13
Figure 4.3 Mean annual PM
10
urban background concentrations (μg/m
3
) in 20 European cities:
range of OFIS model results for the reference year 2000 compared to the range of
observations and average value of all stations
OFIS Measurements
Average
10
20
30
40
50
60
70
80
AN
TW
A
TH
E
B
AR
C
B
ER
L
BR
U
S
B
U
D
A
C
O
PE
G
D
A
N
G
R
A
Z
H
EL
S
K
A
T
O
LIS
B
LO
N
D
M
A
R
S
M
ILA
PA
R
I
PR
A
G
R
O
M
E
STU
T
TH
E
S
Concentration (µg/m³)
Figure 4.4 Mean annual PM
2.5
urban background concentrations (μg/m
3
) in 20 European cities:
range of OFIS model results for the reference year 2000 compared to the range of
observations and average value of all stations
OFIS
Measurements
Average
0
5
10
15
20
25
30
35
0
5
10
15
20
25
30
35
Concentration (µg/m³)
AN
TW
ATH
E
B
A
R
C
B
ER
L
BR
U
S
B
U
D
A
C
O
PE
G
D
A
N
G
R
A
Z
H
E
L
S
K
A
T
O
LISB
LO
N
D
M
AR
S
M
ILA
PA
R
I
PR
A
G
R
O
M
E
S
TU
T
TH
E
S
Air pollution at street level in European cities
Urban and local scale air quality
14
For PM
10
, a reasonably good comparison with
measurements is achieved. As neither the regional
(EMEP) nor the urban scale (OFIS) model accounts
for natural primary PM sources, such as windblown
dust (African dust and local soil resuspension), sea
salt or organic aerosols, a constant value of 17 μg/m
3
has been assumed for all cities to account for these
PM sources. The value was estimated as an average
across all data available for the annual mean PM
10
concentration measured at the EMEP Measurement
network stations (28 stations in 2001, 30 stations in
2002) (URL3). It should be noted that these stations
are unevenly located across Europe since there
are many countries with no data. Therefore, this
estimate may either overestimate or underestimate
natural sources in some cases. For example, it
should perhaps be larger in the case of cities located
in dry costal areas of Southern Europe where PM
sources such as African dust, local soil resuspension
and sea salt would make a larger contribution,
Similarly, this should be the case for coastal cities in
Northern Europe where sea salt would again play
an important role in PM
10
concentrations. Overall, it
must be noted that primary PM
10
emission data are
not as robust as those for other air pollutants. This,
combined with the complex formation, deposition
and resuspension processes, leads to uncertainties
for the modelled PM
10
ambient concentrations.
Also, OFIS, like many urban scale models, does
not yet account for the formation of secondary
organic particulates. This is an omission that could
lead to an underestimation of the modelled PM
10
concentrations.
For PM
2.5
there are very few measurements
to validate the model results. In cases such as
Brussels, Helsinki, London and Paris the limited
data are found to be within the range of the model
results. However, in cases such as Berlin, Lisbon
and Marseilles an underestimation is observed.
A possible reason for this is that the formation of
secondary organic particulates is not accounted for
by OFIS.
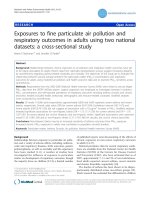
In Figure 4.5 the number of exceedances of the daily
PM
10
limit value (50 μg/m
3
) has been computed.
The constant value of 17 μg/m
3
in the daily average
model results has been included in the computation.
The model results compare well with the measured
data. The overestimation or the underestimation
of the number of exceedances in most cases clearly
follows the overestimation or underestimation
observed in the annual mean concentration results
(see Figure 4.3). Although it seems reasonable to add
a constant value of ~ 17 μg/m
3
to the annual mean
PM
10
model results, the constant value needed to be
added to the daily average model results in order to
calculate exceedance days is a more complex issue.
This constant value will vary largely from city to city
depending on its location (e.g. southern/northern
Europe, coastal or non-coastal city) and season
(e.g. windy summer days). This gives an uncertainty
of perhaps ± 3–5 μg/m
3
, which is considerable in
view of the comparison with the limit value. The
variation of PM
10
concentrations across Europe is
obviously an important scientific issue and deserves
special attention. However, this goes beyond the
scope of the report. Despite the limitations of the
approach followed in this analysis, Figure 4.5
still provides a useful insight into the amount of
exceedances in cities across Europe.
Exceedances above the hourly NO
2
limit value
for 2010 (200 μg/m
3
) are rarely observed in the
urban and suburban background station data
and the urban scale model results. When they are
observed, they tend to be below the allowed number
of exceedances (18 times a year). Therefore, this
comparison is only presented for the traffic station
data and OSPM model results (see Section 4.1.2).
Urban and local scale air quality
Air pollution at street level in European cities
15
Figure 4.5 Number of daily exceedances of the 50 μg/m
3
limit value for PM
10
in 20 European
cities: OFIS model results for the city centre and the suburbs compared to
observations
Station data OFIS suburbs
OFIS centre
THES (2)
STUT (7)
ROME (1)
PRAG (5)
PARI (6)
MILA (3)
MARS (3)
LOND (8)
LISB (4)
KATO (4)
HELS (1)
GRAZ (3)
GDAN (6)
COPE (1)
BUDA (1)
BRUS (6)
BERL (5)
BARC (1)
ATHE (3)
ANTW (1)
50
1000 150 200
Note: The number of urban background stations available in each city is noted in brackets.
Air pollution at street level in European cities
Urban and local scale air quality
16
4.1.2 Local air quality
The NO
2
, NO
X
, PM
10
and PM
2.5
concentrations
measured at urban traffic stations across Europe are
higher than those at urban background stations. This
is due to increased local emissions from road traffic.
The concentrations measured at traffic stations largely
depend on a number of factors, namely: the specific
street configuration; the traffic characteristics; the
orientation of the street with respect to the prevailing
wind direction; the location of the street and the
location of the traffic station in the street itself. Hence,
it is difficult to define a representative range of values.
For the same reasons, the concentrations modelled will
largely depend on the specific street configurations
considered and also the HDV % and the average vehicle
speed assumed. These considerations are the most
important parameters governing the street emissions.
In the analysis that follows, the streets were assumed
to be centrally located, i.e. the urban background
concentrations were assumed to be adequately
described by the OFIS model results for the centre of
the city. The street orientation was assumed to be 'east
to west', and the wind speed and direction for each city
were derived from the EMEP data. The yearly average
wind speeds for each city can be found in Annex D. For
quantifying the hotspot contributions, it is convenient
to introduce street increments, i.e. the difference
between the street and the urban background
concentrations. Model results are presented, and street
increments comparison against measurements is
performed.
The measured street increments were calculated
using the maximum measured street and background
concentrations in each city. These were considered to
represent as far as possible the concentrations observed
close to the centre of the city, and so were comparable
to the modelled street increments. Inevitably, this
introduces an uncertainty since the increment
depends critically on the location of the respective
urban background and traffic stations, which are
often not close to each other. This can lead to either
an overestimation or an underestimation of the street
increments depending on whether the street station is
located in the city centre and the urban background
station is far from the centre or vice-versa. Moreover,
agreement or disagreement between measured and
modelled street increments will be strongly affected by
the question of how similar the actual street geometry,
orientation, traffic characteristics etc. are compared
to the hypothetical streets studied. Answering this
question, however, would have required a detailed
analysis of the characteristics of the street canyons
where the traffic stations operate; a task well beyond
the scope of the present study.
Street increments for NO
2
, NO
X
, PM
10
and PM
2.5
were calculated with the OSPM model for three
hypothetical street canyon configurations. The square
(height and width = 15 m) and wide (height = 15 m,
width = 40 m) canyons were defined according to van
den Hout and Teeuwisse (2004). The third canyon
was selected to represent a narrow canyon case
(height = 15 m and width = 10 m). It was assumed that
the number of vehicles crossing each type of canyon
and corresponding emissions would differ depending
on the canyon width. It was also the assumption that
the narrow canyon had 20 000 vehicles per day, the
square 30 000 vehicles per day and the wide 60 000
vehicles per day.
As expected, the differences between the street
increments computed for the three canyon geometries
are generally small. In most cases the largest increments
are observed for the wide canyon due to the increased
number of vehicles, and hence the emissions that lead
to high street-level concentrations within this canyon.
It should, however, be noted that the aspect ratio of the
wide canyon case (2.7), following van den Hout and
Teeuwisse (2004), is rather large. Thus, the applicability
of the OSPM model is doubtful. The results of the
modelled against the measured street increments for
the narrow canyon case and for the reference year
(2000) are presented in Figures 4.6 to 4.9. The hourly
NO
2
and daily PM
10
exceedances for the narrow
case are also shown in Figures 4.10 and 4.11. Details
concerning the calculations of the street emissions
can be found in Annex C. Here, the methodology is
analysed and the emissions for the narrow canyon with
20 000 vehicles per day are presented. These differ from
city to city according to the specific fleet composition
and contribution of each vehicle category to the total
street emissions. The HDV % and the average vehicle
speed (26 km/h) used for the emission calculations were
defined by the Typology Methodology report (van den
Hout and Teeuwisse, 2004). The report foresees one of
two discrete values (7 % or 15 %). Based on TRENDS/
TREMOVE model results for the country scale, the
larger value was used only for Lisbon.
In order to study the street increment sensitivity to
an increased HDV %, in Section 4.1.2.1, the narrow
case results using 7 % HDV are compared to results
using 15 % HDV for selected cities. Finally, in order
to understand the influence of the different canyon
geometries on the street level concentrations, OSPM
model results were also computed for the three
canyon types. Here, the same number of vehicles per
day (20 000) was assumed. The results for PM
10
are
shown in Figures 4.13 and 4.14, Section 4.1.2.2.
Urban and local scale air quality
Air pollution at street level in European cities
17
Figure 4.6 Mean annual NO
2
street increments (μg/m
3
) for the reference year 2000 in
20 European cities: model results for the narrow canyon case compared to
observations
0
10
20
30
40
50
60
ANTW
ATHE
BARC
BERL
BRUS
BUDA
COPE
GDAN
GRAZ
HELS
KATO
LISB
LOND
MARS
MILA
PARI
PRAG
ROME
STUT
THES
Concentration (µg/m³)
Modelled
Measured
Figure 4.7 Mean annual NO
X
street increments (μg/m
3
) for the reference year 2000 in
20 European cities: model results for the narrow canyon case compared to
observations
Concentration (µg/m³)
Modelled
Measured
0
50
100
150
200
250
300
ANTW
ATHE
BARC
BERL
BRUS
BUDA
COPE
GDAN
GRAZ
HELS
KATO
LISB
LOND
MARS
MILA
PARI
PRAG
ROME
STUT
THES
The aim of the calculations and the results presented in
the figures below is not to show an ideal comparison
with measurements. Due to the aforementioned
constraints this is not possible. Instead, the aim is to
provide an order of magnitude of the street increments
for the various pollutants across European cities.
Air pollution at street level in European cities
Urban and local scale air quality
18
For the narrow street canyon, large but comparable
variations of the measured and the modelled street
increments of NO
2
(10–57 μg/m
3
and 16–53 μg/m
3
respectively) are observed from city to city. In the
case of Marseilles, an unrealistically low street
increment (to be considered representative for
the whole city) of 4 μg/m
3
is observed. This could
be due to the high concentration recorded at the
background station or to the low concentration
recorded at the traffic station. However, detailed
information on the exact station location would
be required in order to draw conclusions on the
representativeness of these stations. In the case of
NO
X
, the range of the measured street increments
varies significantly. A lower than expected street
increment is calculated in some cases due to
unrealistically low traffic station measurements,
such as the case of Katowice. Here, the traffic station
is located outside the urban core and hence is not
representative of the concentrations measured at
traffic stations inside Katowice. In other cases, such
as Berlin, London and Thessaloniki, an exceptionally
high traffic measurement is recorded which gives
a large measured street increment. The modelled
increment range is 87–166 μg/m
3
whereas the
measured range is 32–275 μg/m
3
.
For PM
10
the range of the modelled street increments
in the narrow street canyon is 5–15 μg/m
3
. The
average value is 10 μg/m
3
. The average value of
the measured street increments from the stations
in Figure 4.8 (as many station pairs as possible, not
considering their proximity) is 13 μg/m
3
. However,
if the exceptionally large increments in Rome and
Thessaloniki are not considered, this drops to
11 μg/m
3
. These large increments appear to be due
to exceptionally high concentrations measured
at traffic stations. However, this issue cannot be
studied further as details on the precise street
canyon configurations are not available. In analyses
conducted using 16 station pairs (traffic and urban
background station pairs) for 2002 and for stations
located close to each other (i.e. less than 1 km apart)
the annual mean PM
10
street increment was found
to be 6.9 μg/m
3
(EEA, 2005b). Bearing in mind all
the limitations associated with the comparison
of measured and modelled street increments,
the modelling approach seems to reproduce the
observed PM
10
concentrations fairly well.
Figure 4.8 Mean annual PM
10
street increments (μg/m
3
) for the reference year 2000 in
20 European cities: model results for the narrow canyon case compared to
observations
Concentration (µg/m³)
Modelled
Measured
0
5
10
15
20
25
30
ANTW
ATHE
BARC
BERL
BRUS
BUDA
COPE
GDAN
GRAZ
HELS
KATO
LISB
LOND
MARS
MILA
PARI
PRAG
ROME
STU
T
THE
S
Urban and local scale air quality
Air pollution at street level in European cities
19
For PM
2.5
the range of the modelled street increments
for the narrow canyon is 4–10 μg/m
3
. From the limited
data available, the measured increment is found
to range from 2 μg/m
3
in Helsinki to 11.3 μg/m
3
in
London. In the case of London, the street increment
is calculated using the traffic station located at
Marylebone Road and the urban background station at
Bloomsbury. The corresponding modelled increment
for London for the wide canyon is ~ 4 μg/m
3
. For
Marylebone, the difference between these two values
can be attributed to an underestimation of the street
level concentrations since the urban background
measurements correspond well with the model
results (see Figure 4.4 and corresponding analysis).
The modelled street concentrations may have been
underestimated since the actual HDV % of Marylebone
is 10 %, whereas the hypothetical street canyon assumes
7 %, and also Marylebone has much more traffic
(~ 85 000 vehicles per day) than that assumed in the
wide canyon case (60 000 vehicles per day).
Overall, the comparison of modelled street increments
against measurements shows reasonable results.
However, one has to bear in mind all the limitations
associated with this comparison. These limitations
include the actual distance between the location of the
traffic and urban background stations, their distance
from the city centre and the differences in the street
canyon geometries considered. It is apparent that a
measured increment exceeding the modelled one
could be associated with the use of a much too low
urban background value. On the other hand, the
opposite could well imply that the actual highest traffic
concentrations in the city exceed the measured street
concentrations. Also, in terms of the model results and
assumptions, it is likely that the average vehicle speed
of 26 km/h considered following van den Hout and
Teeuwisse (2004) may be rather low. This could have
led to slightly increased estimates of the exhaust PM
emissions, and consequently an overestimation of the
predicted concentrations. Furthermore, it is uncertain
how accurately the non-exhaust PM
10
and resuspension
emissions were estimated (see Annex C). Depending
on whether the PM emission sources are overestimated
or underestimated, the corresponding PM
10
street
level concentrations will be affected. This would give a
larger or smaller street increment respectively. Finally,
the comparison also reveals the restrictions of the
hypothetical street canyon configurations considered
in this analysis. The worst street increments may have
also been (see Rome and Thessaloniki PM
10
street
increments, Berlin, London and Thessaloniki NO
X
street
increments and London PM
2.5
increments) the worst
street canyon configurations, i.e. the street geometry
and traffic characteristics may not have been explicitly
considered.
Figure 4.9 Mean annual PM
2.5
street increments (μg/m
3
) for the reference year 2000 in
20 European cities: model results for the narrow canyon case compared with
observations
Concentration (µg/m³)
Modelled
Measured
0
2
4
6
8
10
12
ANTW
ATHE
BARC
BERL
BRUS
BUDA
COPE
GDAN
GRAZ
HELS
KATO
LISB
LOND
MARS
MILA
PARI
PRAG
ROME
STUT
THES
Air pollution at street level in European cities
Urban and local scale air quality
20
The hourly NO
2
and daily PM
10
exceedances at street
level were also calculated using the OSPM model for
the three different street configurations. In Figures 4.10
Figure 4.10 Number of hourly NO
2
exceedances of the 200 μg/m
3
limit value in 20 European
cities for the narrow canyon case
0 20 40 60 80 100 120 140 160 180
THES (3)
STUT (2)
ROME (9)
PRAG (6)
PARI (4)
MILA (5)
MARS (1)
LOND (10)
LISB (5)
KATO (1)
HELS (3)
GRAZ (1)
GDAN (0)
COPE (2)
BUDA (1)
BRUS (1)
BERL (7)
BARC (11)
ATHE (6)
ANTW (1)
Station data
OSPMn
and 4.11 the model results are compared to measured
exceedances observed at various traffic stations across
each city.
Note: The number of urban trafc stations available in each city is noted in brackets.
Urban and local scale air quality
Air pollution at street level in European cities
21
The exceedance results for both NO
2
and PM
10
are
reasonably good. However, the exceptionally high
exceedances observed at specific stations (worst cases)
cannot be modelled, since (as was also noted in the
street increment analysis) the worst street canyon
cases have not been considered. For PM
10
the overall
under-estimation or over-estimation of the exceedances
observed for certain cities (Antwerp, Athens, Graz,
Paris) follows from the over-estimation or under-
estimation of the urban background concentrations
(OFIS results). These were requested as input by the
street scale model OSPM (see also Figure 4.3) since they
play an important role in the concentrations computed
at street scale. In cities such as Berlin, Copenhagen
and Prague, where there is fair agreement between
modelled and measured urban background levels
(Figure 4.3); the exceedances calculated at street level
are also in agreement with the exceedances measured
at the various traffic stations. Overall, the accuracy
of the modelled exceedances appears to be very
sensitive to the accuracy of the modelled annual mean
concentrations.
4.1.2.1 The influence of an increased HDV %
In order to study the street increment sensitivity to the
HDV %, the street emissions for Athens, Berlin, Milan,
Rome, Stuttgart and Thessaloniki were also computed
based on an HDV % of 15 %. In Figure 4.12 the street
increments corresponding to these emissions for the
narrow street canyon with 20 000 vehicles per day are
compared to the street increments for the same street
canyon, but based on an HDV % of 7 %.
Figure 4.11 Number of daily PM
10
exceedances of the 50 μg/m
3
limit value in 20 European
cities for the narrow canyon case
Station data
OSPMn
0 50 100 150 200 250 300
THES (2)
STUT (2)
ROME (2)
PRAG (6)
PARI (1)
MILA (4)
MARS (1)
LOND (5)
LISB (2)
KATO (1)
HELS (4)
GRAZ (1)
GDAN (0)
COPE (1)
BUDA (1)
BRUS (0)
BERL (5)
BARC (9)
ATHE (4)
ANTW (2)
Note: The number of urban trafc stations available in each city is noted in brackets.
Air pollution at street level in European cities
Urban and local scale air quality
22
The consideration of a higher HDV % at street level
increases all pollutant concentrations. However, this
depends on the specific composition of the HDVs
in each city. In countries such as Greece (Athens
and Thessaloniki) where old technology and more
polluting vehicles are still used, the increase is
larger than in German or Italian cities. The NO
2
concentration increases by 5–7 μg/m
3
, NO
X
by
30–51 μg/m
3
, PM
10
by 4–6 μg/m
3
and PM
2.5
by
3–5 μg/m
3
.
Figure 4.12 Mean annual NO
2
, NO
X
, PM
10
and PM
2.5
street increments (μg/m
3
) in six European
cities for a narrow street canyon with 20 000 vehicles per day, assuming a HDV %
of 7 % and 15 %
0
10
20
30
40
50
60
ATHE BERL MILA ROME STUT THES
Concentration (μg/m
3
)
7 % HDV
15 % HDV
NO
2
Concentration (μg/m
3
)
7 % HDV
15 % HDV
0
50
100
150
200
ATHE BERL MILA ROME STUT THES
NO
X
Concentration (μg/m
3
)
7 % HDV 15 % HDV
PM
10
0
2
4
6
8
10
12
14
16
ATHE BERL MILA ROME STUT THES
Concentration (μg/m
3
)
7 % HDV 15 % HDV
PM
2.5
0
2
4
6
8
10
12
14
ATHE BERL MILA ROME STUT THES
Urban and local scale air quality
Air pollution at street level in European cities
23
4.1.2.2 The influence of the different street canyon
geometries
In order to study the influence of the different
canyon geometries on the street level concentrations,
OSPM model results were computed for the three
canyon types. Here, the same number of vehicles per
day (20 000) was assumed. The results for PM
10
are
shown in Figures 4.13 and 4.14.
The highest street increments are observed in the
narrow canyon case which due to its configuration
has the effect of trapping the air pollutants inside the
street. This results in high street level concentrations.
Assuming the same amount of vehicles per day
in the square and wide cases, the PM10 street
increments are found to be lower by 33 % and 67 %
compared to the concentrations in the narrow
canyon.
Similar to the street increments, the largest number
of exceedances is observed in the narrow canyon
case. The model results show that for the reference
year 2000, the allowed number of daily PM
10
exceedances (35 days per year according to the
2005 limit value defined in Directive 1999/30/EC) is
exceeded in almost all cities in the narrow canyon, in
14 cities in the square canyon and in half the cities in
the wide canyon case.
Figure 4.13 Mean annual PM
10
street increments (μg/m
3
) for the reference year 2000 in 20
European cities: model results for the narrow, square and wide canyons compared
to observations
0
5
10
15
20
25
30
ANTW
ATHE
BARC
BERL
BRUS
BUDA
COPE
GDAN
GRAZ
HELS
KATO
LISB
LOND
MAR
S
MILA
PAR
I
PRAG
ROME
STUT
THES
OSPMn OSPMs OSPMw Measured
Concentration (µg/m³)