A Practical Approach to Water Conservation for Commercial and Industrial Facilities pot
Bạn đang xem bản rút gọn của tài liệu. Xem và tải ngay bản đầy đủ của tài liệu tại đây (21.14 MB, 395 trang )
A Practical Approach to Water
Conservation for Commercial
and Industrial Facilities
Elsevier UK Job Code:APR Chapter:Revised-Prelims 8-5-2007 5:45p.m. Page:iii Trimsize:156mm×234mm
Fonts used:Optima Margins:Top:30pt Gutter:20mm Font Size:10/12pt Text Width:115mm Depth:46 Lines
A Practical Approach to Water
Conservation for Commercial
and Industrial Facilities
Mohan Seneviratne
Queensland Water Commission, Australia
AMSTERDAM
•
BOSTON
•
HEIDELBERG
•
LONDON
NEW YORK
•
OXFORD
•
PARIS
•
SAN DIEGO
SAN FRANCISCO
•
SINGAPORE
•
SYDNEY
•
TOKYO
Butterworth-Heinemann is an imprint of Elsevier
Butterworth-Heinemann is an imprint of Elsevier
Linacre House, Jordan Hill, Oxford OX2 8DP, UK
30 Corporate Drive, Suite 400, Burlington, MA 01803, USA
First edition 2007
Copyright © 2007, Mohan Seneviratne. Published by Elsevier Ltd. All rights reserved
The right of Mohan Seneviratne to be identified as the author of this work has been
asserted in accordance with the Copyright, Designs and Patents Act 1988
No part of this publication may be reproduced, stored in a retrieval system
or transmitted in any form or by any means electronic, mechanical, photocopying,
recording or otherwise without the prior written permission of the publisher
Permissions may be sought directly from Elsevier’s Science & Technology Rights
Department in Oxford, UK: phone (+44) (0) 1865 843830; fax (+44) (0) 1865 853333;
email: Alternatively you can submit your request online by
visiting the Elsevier web site at and selecting
Obtaining permission to use Elsevier material
Notice
No responsibility is assumed by the publisher for any injury and/or damage to persons
or property as a matter of products liability, negligence or otherwise, or from any use
or operation of any methods, products, instructions or ideas contained in the material
herein. Because of rapid advances in the medical sciences, in particular, independent
verification of diagnoses and drug dosages should be made
British Library Cataloguing in Publication Data
A catalogue record for this book is available from the British Library
Library of Congress Cataloging-in-Publication Data
A catalog record for this book is available from the Library of Congress
ISBN: 978-1-85-617489-3
For information on all Butterworth-Heinemann publications
visit our web site at books.elsevier.com
Printed and bound in Great Britain
07080910 10987654321
Working together to grow
libraries in developing countries
www.elsevier.com | www.bookaid.org | www.sabre.org
Dedicated to my parents Barbara and Yase
This page intentionally left blank
Contents
Foreword xvi
About the Author xviii
Acknowledgement
xix
1 Water Conservation – A Priority for Business 1
1.1 Introduction 1
1.2 Global Water Resources Availability 2
1.3 Human Need for Safe Drinking Water and Proper Sanitation 3
1.4 Meeting Agricultural Needs 6
1.5 The Impact of Climate Change 8
1.6 Business Sector Water Usage 11
1.7 Nine Reasons for Business to Reduce Their Water
Consumption
15
1.8 Conclusion 22
References 22
2 Basic Water Chemistry 25
2.1 Overview 25
2.2 Solubility Principles 26
2.3 Common Substances Found in Water 26
2.3.1 pH 26
2.3.2 Dissolved Gases 28
2.3.2.1 Carbon dioxide and Alkalinity 28
2.3.2.2 Oxygen O
2
29
2.3.2.3 Ammonia NH
3
29
2.3.2.4 Hydrogen Sulphide H
2
S 30
2.3.3 Dissolved Ions 30
2.3.3.1 Conductivity and Total Dissolved Solids 30
2.3.3.2 Hardness, Calcium and Magnesium 32
2.3.3.3 Chlorides 35
2.3.3.4 Sodium 36
2.3.3.5 Iron 36
2.3.3.6 Manganese 36
2.3.3.7 Silica 37
2.3.3.8 Phosphate 37
2.3.3.9 Nitrate 37
2.3.3.10 Boron 37
2.3.3.11 Cyanide 38
viii Contents
2.3.4 Suspended Solids and Turbidity 38
2.3.5 Colour 38
2.3.6 Organics in Water 39
2.3.6.1 Biochemical Oxygen Demand 39
2.3.6.2 Chemical Oxygen Demand 39
2.3.7 Micro-organisms 40
2.3.7.1 Viruses 40
2.3.7.2 Bacteria 40
2.3.7.3 Protozoa 41
2.3.7.4 Algae 42
2.3.7.5 Helminths 42
2.3.7.6 Fungi 42
2.3.8 Heavy Metals 42
2.3.8.1 Chromium 42
2.3.8.2 Cadmium 43
2.3.8.3 Lead 43
2.3.8.4 Mercury 44
2.3.9 Radionuclides 44
References 44
3 Saving Water: Step by Step 46
3.1 Developing a Sustainable Water Management Plan 46
3.2 Step 1: Seek Senior Management Commitment 50
3.3 Step 2: Appoint A Water Conservation Manager 51
3.3.1 Responsibilities of the Water Conservation
Manager
51
3.4 Step 3: Gather Baseline Data and Review Usage 52
3.5 Step 4: Identify Improvement Opportunities 55
3.5.1 Carry Out an Assessment of Management
Systems
55
3.5.1.1 One-2-Five Water
®
– Management
Diagnostic System
55
3.5.2 Technical Assessment 56
3.5.2.1 How Detailed Should the Water Audit Be? 57
3.5.2.2 Estimating Water-Saving Potential 59
3.5.2.3 Complying with Regulatory Standards 60
3.5.2.4 Carrying out a Water Audit 62
3.5.2.5 Develop a Water Balance 65
3.5.2.6 Identifying Other Opportunities to Reduce
Water Use 65
3.6 Step 5: Preparing the Plan Prioritising the
Opportunities
67
3.7 Step 6: Report the Results 68
3.8 Conclusion 71
References 71
Contents ix
4 Measuring Flow and Consumption 73
4.1 Flow Measurement 73
4.2 Types of FlowMeters 75
4.2.1 Positive Displacement Meters (volumetric) 75
4.2.2 Velocity Meters 76
4.2.2.1 Mechanical Meters 77
4.2.2.2 Non-Mechanical Meters 78
4.3 Selecting a Flowmeter 80
4.4 Dataloggers 80
4.5 Chemical Methods of Flow Measurement 82
4.6 Conclusion 82
5 Cooling Water Systems 83
5.1 Introduction 83
5.2 Types of Cooling Systems 84
5.2.1 Open Recirculating Cooling Water Systems 85
5.2.1.1 Recirculating Cooling Water Systems –
Operational Principles
86
5.2.1.2 Recirculating Cooling Water Systems –
Basic Concepts
88
5.3 Types of Cooling Towers 92
5.3.1 Induced Draught Cross-flow Cooling Towers 93
5.3.2 Induced Draught Counter-flow Cooling Towers 93
5.3.3 Forced Draught Wet Cooling Towers 94
5.3.4 Evaporative Condensers 94
5.4 Water Conservation Opportunities 94
5.4.1 Reducing Involuntary Water Loss 95
5.4.1.1 Minimising Overflow of Water from
Cooling Tower Basins
95
5.4.1.2 Incorrect Piping Configuration 96
5.4.1.3 Leakage from Pipes, Joints and Pump
Glands
96
5.4.1.4 Drift Loss 96
5.4.1.5 Splash 96
5.4.2 Reducing Voluntary Water Loss 96
5.4.2.1 Increasing Cycles of Concentration 97
5.4.2.2 Install Flowmeters on Make-up and
Blowdown Lines and Conductivity Meters
in Blowdown Lines
98
5.4.2.3 Operate Blowdown in Continuous Mode 98
5.4.2.4 Install Sidestream Filtration 99
5.4.3 Improving Operating Practices 100
5.4.3.1 Shut Off the Unit When not in
Operation
100
5.4.3.2 Minimise Process Leaks to the Cooling
System
101
x Contents
5.5 Alternative Water Sources 101
5.5.1 Maximum Allowable Concentrations 101
5.6 Cooling Water Treatment for Recirculating Water Systems 104
5.6.1 Scaling 105
5.6.1.1 Scaling Indices 107
5.6.1.2 What the LSI is Not 108
5.6.1.3 Scale-control Methods 108
5.6.2 Fouling 109
5.6.3 Corrosion 109
5.6.4 Biofouling and Microbial Growth 111
5.6.4.1 Microbiological Control 112
5.7 Role of Water Treatment Contractors in Water
Conservation
114
5.8 Conclusion 115
References 115
6 Alternatives to Wet Cooling Towers 117
6.1 Air-conditioning and Refrigeration Systems 117
6.2 Energy Conservation = Water Conservation 118
6.3 Alternative Heat Rejection Systems 123
6.3.1 Air-Cooled Condensers 124
6.3.2 Hybrid Cooling Towers 125
6.3.3 Combination Cooling Systems 127
6.3.4 Geothermal Cooling Systems 129
References 130
7 Steam Systems 132
7.1 Introduction 132
7.2 Steam System Principles 133
7.2.1 Pre-treatment 134
7.2.2 Steam Generation 139
7.2.2.1 Firetube Boilers 139
7.2.2.2 Watertube Boilers 140
7.2.2.3 Waste Heat Recovery Boilers 143
7.2.3 Steam Distribution System 143
7.2.3.1 Thermostatic Traps 144
7.2.3.2 Mechanical Traps 144
7.2.3.3 Thermodynamic Traps 144
7.2.3.4 Fixed Orifice Condensate Discharge Traps
(FOCDT)
145
7.3 Steam and Energy Conservation Opportunities 146
7.3.1 Repair Steam Leaks 147
7.3.2 Maximise Condensate Recovery 148
7.3.2.1 Condensate Quality and System
Protection
150
7.3.2.2 Minimise Water Logging of Pipes 151
Contents xi
7.3.3 Minimising Boiler Water Blowdown 151
7.3.3.1 Blowdown Control 151
7.4 Calculating the “True” Cost of Steam 154
References 155
8 Industrial Water Reuse Technologies 157
8.1 Introduction 157
8.2 A Step-by-Step Approach to Water Reuse 159
8.2.1 Establishing the Goals of the Study 160
8.2.1.1 Goals 160
8.2.1.2 Project Boundaries 160
8.2.2 Gather Data 161
8.2.3 Identify the Project 161
8.2.4 Technical Assessment 164
8.2.5 Implementation 164
8.3 Pollutants Found in Reuse Streams 164
8.4 Removal of Pollutants 165
8.4.1 Order of Removal 167
8.5 Removal of Suspended Solids 167
8.5.1 Screening 168
8.5.2 Sedimentation 170
8.5.3 Settling 171
8.5.4 Chemically Aided Settling – Coagulation 172
8.5.5 Filtration 173
8.6 Removal of Fats, Oils and Greases 175
8.6.1 Sources of Fats, Oil and Grease 175
8.6.2 Free FOG Removal – Skimming 176
8.6.3 Emulsified FOG Removal 176
8.6.3.1 Air Flotation 177
8.6.3.2 Ultrafiltration 179
8.7 Removal of Biodegradable Organics 180
8.7.1 Activated Sludge Process 184
8.7.2 Anaerobic Processes 188
8.7.2.1 Performance 190
8.7.3 Membrane Bioreactors 191
8.8 Removal of Heavy Metals 192
8.8.1 Chemical Precipitation 193
8.8.2 Ion Exchange 196
8.9 Adsorption 197
8.10 Membranes for Removal of Dissolved Ions 198
8.10.1 Overview 198
8.10.2 Dead-End and Cross-Flow Filtration 201
8.10.2.1 Dead-end Filtration 201
8.10.2.2 Cross-flow Filtration 201
xii Contents
8.10.3 Membrane Types 202
8.10.3.1 Microfiltration 202
8.10.3.2 Ultrafiltration 205
8.10.3.3 Nanofiltration 205
8.10.3.4 Reverse Osmosis 206
8.10.4 Membrane Structure 206
8.10.5 Membrane Configurations 207
8.10.5.1 Spiral Wound 207
8.10.5.2 Hollow Fibre 207
8.10.5.3 Tubular 208
8.10.5.4 Plate and Frame 209
8.10.6 Membrane Performance Monitoring 213
8.10.6.1 Silt Density Index 214
8.10.6.2 Assessment of Scaling
Tendencies
215
8.10.6.3 Membrane flux 215
8.10.6.4 Permeate Recovery 216
8.10.7 Disposal of Brine Streams 217
8.10.8 Considerations When Selecting Membrane
Systems
217
8.10.9 Electrodialysis and Electrodialysis
Reversal
219
References 219
9 Making a Financially Sound Business Case 221
9.1 Introduction 221
9.2 Management Functions 222
9.3 Making a Good Business Case 222
9.3.1 Identifying Hidden Costs 224
9.4 Computing Cash Flows 226
9.5 Investment Appraisal Methods 228
9.5.1 Payback Method 228
9.5.2 Return on Investment Method 230
9.5.3 Discounted Cash Flow Methods 230
9.5.4 Net Present Value Analyses 231
9.5.5 Internal Rate of Return 233
9.6 Assessing Project Risk 233
References 235
10 The Hospitality Sector 236
10.1 Introduction 236
10.2 Benchmarking Water and Energy
Consumption
237
10.2.1 Benchmarking Water Consumption 237
10.2.2 Benchmarking Energy Consumption 238
Contents xiii
10.3 Steps to Achieve Water Savings 240
10.3.1 Water Management Policy 240
10.3.3 Identifying the Best Opportunities 241
10.3.2 Gathering Consumption and Billing Data and
Metering Water Consumption 241
10.3.3.1 Guest Rooms 241
10.3.3.2 Public Amenities 244
10.3.3.3 Kitchens 252
10.3.3.5 Laundry 259
10.3.3.6 Ice-Making Machines 259
10.3.3.7 Swimming Pools 262
10.3.3.8 Staff Rooms 262
10.3.3.9 Irrigation 262
10.3.3.4 Cooling Tower: Air-Conditioning and
Refrigeration 258
10.4 Staff Awareness Programmes 264
10.5 Guest Awareness Programmes 264
References 265
11 Commercial Buildings, Hospitals and Institutional Buildings 267
11.1 Introduction 267
11.2 Commercial Property – Office and Retail 267
11.2.1 Industry Structure and Water Usage 267
11.2.2 Water-Usage Benchmarks 269
11.2.2.1 Energy Consumption 270
11.2.2.2 Shopping Centres 271
11.2.3 Water-Saving Opportunities 272
11.3 Hospitals 275
11.3.1 Benchmarking Water Usage 276
11.3.2 Benchmarking Energy Consumption 277
11.3.3 Water Conservation Opportunities 278
11.3.3.1 Monitor Leakage 278
11.3.3.3 Steam Systems 279
11.3.3.4 Taps, Toilets and Urinals 279
11.3.3.5 Food Preparation 280
11.3.3.6 In-house Laundries 280
11.3.3.7 Medical Equipment 281
11.3.3.8 Increase Staff Awareness 285
11.3.3.9 Floor cleaning 285
11.3.3.2 Air-conditioning and Refrigeration
Systems 279
11.4 Correctional Centres 285
11.4.1 Water Usage Benchmarks 286
11.4.2 Water Conservation Opportunities 286
References 288
xiv Contents
12 Swimming Pools 291
12.1 Introduction 291
12.1.1 Swimming Pool Benchmarks 291
12.2 Water Conservation Opportunities 292
12.2.1 Reducing Leakage 293
12.2.2 Water-Efficient Fixtures 293
12.2.3 Optimising Filter Backwash Cycles 294
12.2.4 Minimising Evaporation 296
References 299
13 Food Processing and Beverage Industry 300
13.1 Introduction 300
13.2 Water and Energy Usage 301
13.2.1 Water Usage 301
13.2.2 Energy Usage 303
13.3 Understanding the Process and Where Water is
Used. 306
13.4 Benchmarking Water Usage and Comparing it Against
Best Practice
307
13.5 Water Minimisation Measures in the Food-Processing
Industry
310
13.5.1 Avoiding Water Usage 310
13.5.2 Reducing Water Usage – Spray Nozzles 312
13.5.3 Reducing Water Usage – Washing 316
13.5.4 Reducing Water Usage – Clean-in-Place 316
13.5.5 Reducing Water Usage – Liquid Ring Vacuum
Pumps
320
13.5.6 Reducing Water Usage – Amenities Blocks 325
13.5.7 Reducing Water Usage – Evaporative
Condensers and Cooling Towers
325
13.5.8 Reducing Water Usage – Steam Systems 326
13.5.9 Reusing Water 326
13.5.10 Notes on Water-Reuse Applications 327
References 328
14 Oil Refining 330
14.1 Introduction 330
14.2 Oil Refining Processes 332
14.2.2 Thermal and Catalytic Cracking 332
14.2.3 Hydrotreating 333
14.2.4 Reforming 333
14.2.5 Alkylation and Polymerisation 333
14.2.6 Coking 333
14.2.7 Blending 333
14.2.1 Desalting, Crude Distillation and Vacuum
Distillation 332
Contents xv
14.3 Water Usage 335
14.3.1 Cooling Water Systems 335
14.3.2 Steam Systems 335
14.3.3 Wastewater Systems 337
14.3.4 Energy Usage 338
14.4 Water Conservation Opportunities 339
14.4.1 Reduction in Water Consumption 341
References 342
15 Laundries 343
15.1 Introduction 343
15.2 Industry Structure 344
15.2.1 Large Commercial Laundries 344
15.2.2 Large Hospital Laundries 344
15.2.3 Large and Small On-premise Laundries 344
15.3 Types of Laundry Equipment 345
15.3.1 Washer-Extractor 346
15.3.2 Continuous Batch Washers or Tunnel Washers 347
15.4 Benchmarking 348
15.5 Water Conservation 349
15.5.1 Water and Energy Reuse 349
15.5.2 Reuse for Wash Water Quality 350
15.5.3 Reuse for Rinse Water Quality 351
15.5.4 Ozone Disinfection 353
355References
Glossary of Terms 357
364
364
369
372
Appendix
Worksheets
Conversions
Index
Chapter 1
Water Conservation – A Priority
for Business
Not a single drop of water received from rain should be allowed
to escape into the sea without being utilised for human benefit –
King Parakrama Bahu the Great of Sri Lanka (1153–1186)
1.1 Introduction
Water is life. We recognise the value of water and its role in our day-to-day
activities. Religions have recognised the role water plays in our well being. In
developed societies, due to past investments in water infrastructure we have
come to expect that water will be available 365 days of the year. We have
being brought up with the notion that as long as we pay for it we have the right
to consume as much as we want. Since there is no substitute to water, water
prices have not reflected its intrinsic value and traditionally is subsidised.
Con-
sequently water is cheap relative to other resource costs. This has led to global
fresh water consumption to rise faster than it is replenished. Between 1990 and
1995, fresh water consumption rose more than twice the rate of population
growth. According to a report released by the International Water Management
Institute (IWMI) at the Stockholm World Water Conference in 2006, a third of
the world’s population (roughly 2 billion people) is facing water scarcity now,
not in 2025 as earlier predictions forecasted [1]. Water scarcity is not only a
third-world problem. In recent years water scarcity have affected developed
countries too. For example, in Australia the one in a hundred year drought has
made water a political issue. It has highlighted the competing needs of
agricul-
ture, the low water prices enjoyed by the farming community which has led
to wasteful practices and the need to supply the urban population with water
where the majority of the populations live as well as the challenge to maintain
environmental flows in the rivers. The world’s water is in a crisis. But it is more
a crisis of management of water rather than a water crisis. Therein lies the triple
paradox of water. As the World Business Council for Sustainable Development
(WBCSD) succinctly puts it: It is cheap, scarce and wasted [2].
2 A Practical Approach to Water Conservation
Water quality is also decreasing and so far has not made the headlines.
This alone could bring about a water crisis according to the 2006 Stockholm
Water Laureate Professor Asit Biswas [3]. For an example, the rapid
indus-
trialisation of China and India will contribute to severe degradation of water
quality in those countries if preventive measures are not taken.
Protecting the available water resources is therefore our shared responsi-
bility. Business is part of the solution from the supply side as well as from
the demand side. This chapter presents nine compelling arguments on why
reducing water usage makes good business sense.
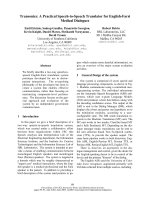
1.2 Global Water Resources Availability
From a global perspective, only 35 million km
3
(equal to 3.0%) of the world’s
water is fresh. Ninety seven percent is seawater and not readily available
for human consumption. Of the 3.0%, permanently frozen in the Arctic and
Antarctica,groundwater,swampandpermafrostconstitute2.5%.Sothatleaves
only 0.5% (equal to 105 000
km
3
) in rivers and lakes to meet the needs of
humans and the requirements of the planet’s fresh water ecosystems. Figure 1.1
graphically shows the available global water resources.
Table 1.1 shows that 98% of the world’s fresh water (0.5% of the total) is in
aquifers.
Freshwater – available
0.50%
Freshwater – frozen
2.50%
Seawater
97.00%
Figure 1.1 Global water resources [4]
Courtesy of the World Business Council for Sustainable Development – Facts and Trends.
Geneva, Switzerland. August 2005.
Water Conservation 3
Table 1.1 Where is this 0.5% of fresh water?
Water resource km
3
Million acre-ft Number of Olympic- Percentage
sized swimming
pools
∗
(×10
6
)
Aquifers 10000000 8107013 4000000 97.9%
Rainfall on land 119000 96473 47600 1.2%
(net of rainfall
after accounting
for evaporation)
Natural lakes 91000 73774 36400 0.89%
Man-made storage 5000 4054 2000 0.05%
facilities
Rivers 2120 1719 848 0.02%
Total 10217120 8283032 4086848 100%
∗
1 Olympic-sized swimming pool is assumed to hold 2500 m
3
of water.
Adapted from the World Business Council for Sustainable Development – Facts and
Trends.
Geneva Switzerland. August 2005.
Case Study: World’s Largest Aquifer Going Dry [5]
The world’s largest aquifer is the Ogallala aquifer in the United States. It
supplies water for irrigation to one-third of the United States crops and
provides drinking water to Colorado, Kansas, Nebraska, New Mexico,
Oklahoma, South Dakota, Texas and Wyoming. In other words it contains
enough water to cover the entire United States to a depth of
one-and-
a-half feet. Even this aquifer is predicted to run dry in two decades due
to over abstraction of water. Nebraska, Kansas and Texas were pumping
88% of all the Ogallala water between them, a massive 20 969 million
m
3
/yr (17 million acre ft / yr in 1991) more than the Colorado river.
Global demand for water needs to
•
satisfy human needs for safe drinking water and proper sanitation
•
expand agricultural production to meet population growth
•
meet business needs to provide more goods and services for a growing
population and
•
minimise the impact of climate change on water resources.
1.3 Human Need for Safe Drinking Water
and Proper Sanitation
The world’s increasing water demands are driven by an increase in global
population and urbanisation. The world’s population is expected to increase
4 A Practical Approach to Water Conservation
from approximately 6 billion in the year 2000 to 8–10 billion people in 2050,
with 90% of future population growth occurring in developing countries [6].
Over the next three decades, urban growth will bring a further 2 billion
people into cities in the developing countries, doubling their size to about
4 billion people. These cities are growing at a rate of 70 million people
per year [7].
This growth will result in the creation of mega-cities with populations in
excess of 10 million people in each city. In 1950 there was only one
mega-
city – New York. In 1975 there were 5 and by the year 2015 it is expected
that 23 cities around the globe will become mega-cities – 19 of them will
be located in developing countries. Table 1.2 shows the 10 largest cities in
the world in the year 2000.
These countries already suffer from severe water stress and myriad other
social issues. Over 1 billion people or (one in six) live without regular access
to safe drinking water. Rapid urbanisation creates squatter towns and slums.
For example, currently 40–50% of the population in Jakarta (Indonesia) and
a third in Dhaka (Bangladesh), Calcutta (India) and Sao Paulo (Brazil) live
in slums [7]. These increases in population will increase the demand for
water. Poor sanitation conditions result in increased child mortality. For
example, there is one toilet for every 500 people in the slums of Nairobi
(Kenya). Leakage rates for most of these cities’ water distribution systems are
in the high thirties. That is, only two-thirds of the water supplied reaches
consumers, whereas in the developed world, approximately 90% of the
water supplied reaches the consumer. Poverty also increases the occurrence
of water theft – that is, unaccounted for water losses. Figure 1.2 shows the
Table 1.2 The 10 largest cities in the world in 2000
City Country Population (millions)
Tokyo Japan 26.44
Mexico City Mexico 18.07
Sao Paolo Brazil 17.96
New York USA 16.73
Mumbai (Bombay) India 16.09
Los Angeles USA 13.21
Calcutta India 13.06
Shanghai China 12.89
Dhaka Bangladesh 12.52
Delhi India 12.44
Buenos Aires Argentina 12.02
Jakarta Indonesia 11.02
Osaka Japan 11.01
Rio de Janeiro Brazil 10.65
Karachi Pakistan 10.03
Source: UN Habitat: Global Urban Observatory. Nairobi. 2003.
Urbanization and Water Stress
Water stress in regions around mega-cities as a ratio of total withdrawals divided by
estimated total availability
0–0.2 Low water stress 0.2–0.4 Medium water stress More than 0.4 Severe water stress
Paris
Beijing
Los Angeles
New York
New Delhi
Tokyo
Osaka
Dhaka
Shanghai
Mexico City
Cairo
Karachi
Bombay
Calcutta
Rio de Janiero
Sao Paulo
Buenos Aires
Figure 1.2 The global water challenge – urbanisation and freshwater stress
Source: World Business Council for Sustainable Development – Business in the World of Water. Geneva, Switzerland.
August 2006.
Water Conservation 5
6 A Practical Approach to Water Conservation
urbanisation and water stress in regions around mega-cities as a ratio of total
water withdrawals divided by estimated total availability [8].
Whilst almost all the mega-cities are predicted to suffer from water short-
ages, the problem is particularly acute in China; it is predicted that 550 cities
will experience severe water shortages [8].
1.4 Meeting Agricultural Needs
With nearly 70% of global fresh water being used for agriculture (80%
in Asia) it will be increasingly difficult to meet global food requirements
for a growing population. The development of fresh water resources for
human use has compromised natural ecosystems that depend on these
resources.
Table 1.3 shows that countries with abundant rainfall, such as in
the United Kingdom and France, use relatively small amounts of water
for irrigation, whereas countries with low rainfall (which are typically
developing countries) use nearly 90% of their water consumption for
irrigation.
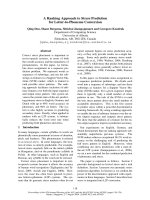
Case Study: Water Usage in Agriculture in Australia
The water consumption breakdown for year 2000–01 (Figure 1.3) illus-
trates the heavy use of water in agriculture even though the GDP (gross
domestic product) of agriculture has declined significantly from 20% in
the first half in the 20th century to 2.9% in 2001–02.
Table 1.3 Sectoral use of fresh water by selected countries
Country Agricultural (%) Industrial (%) Domestic and commercial (%)
India
Egypt
China
Australia
∗
Netherlands
France
United Kingdom
93
88
87
67
32
12
1
3
5
7
12
63
71
78
4
7
6
12
5
17
21
∗
Environment flows and water supply accounts for the remainder.
Sources: World Business Council for Sustainable Development Industry. Fresh Water and
Sustainable
Development. April 1998 and Australian Bureau of Statistics Water Account
Australia
2000–01.
Water Conservation 7
Water Consumption in Australia 2000–01
Environment
Household
Other
Water Supply
Electricity and gas
Manufacturing
Mining
Agriculture
0 5000 10000 15000 20000
million m
3
/yr (GL/yr)
Figure 1.3 Water consumption in Australia 2000–01
Source: Australian Bureau of Statistics.
To cater for an increase in population to 8–10 billion people by 2050, the Food
and Agriculture Organisation estimates food demand will double in a
simi-
lar timeframe. To produce this quantity of food, the additional water use is
expected to increase by 50% over the next 30 years to 5600
km
3
/yr to erad-
icate undernutrition and feed an additional 3 billion people. This is almost
as much water as the present global consumptive water use in irrigation [9].
Compounding this problem is
•
the trend towards water-intensive farming
•
over-extraction of water resources
•
evaporation of water from open channels
•
pollution of these water sources due to heavy reliance on pesticides
and fertilizers
•
poor land management practices and
•
heavily subsidised low water prices encouraging wasteful practices.
Consequently, water has become the number one limiting factor for food
production in many parts of Asia and sub-Saharan Africa. The solution is
to increase water productivity, that is produce more food from each unit of
water. The water used in the production process of an agricultural or
indus-
trial product is called the virtual water contained in the product [9, 10, 11].
Table 1.4 shows the virtual water requirement per kilogram of some common
agricultural products for some selected countries. For example, to produce
1 kg of beef, 13 000 L of water (or more) is required.
Table 1.4 shows that livestock products have a higher virtual water content
than cereals and this is understandable. It also shows that USA and Australia
are more efficient producers of food than India for the selected products.
Export trade in food is in fact trade in
water. When countries living in water-
stressed areas export food, they are in effect exporting water, which further
exacerbates the water shortage problem of that country. The largest of the
water exporting countries include USA, Canada, Germany and Australia.
8 A Practical Approach to Water Conservation
Table 1.4 Average virtual water content of some selected products for
some of selected countries [9, 10]
Food item Water requirement m
3
/ton
USA Australia India
Rice (paddy)
Wheat
Soybeans
Cotton seed
Beef
Pork
Poultry
Lamb
1,275
849
1,869
2,535
13,193
3,946
2,389
5,977
1,022
1,588
2,106
1,887
16,482
4,397
7,736
6,692
2,850
4,124
8,264
17,112
5,909
2,914
6,947
Case Study: Australia’s International Trade and Water Exports
Australia’s managed water use is 24 000 GL/yr (24 000 million m
3
/yr
or 19.5 million acre-ft). Australia exports the equivalent of 7500 GL of
water/year embodied in goods and services and imports 3500 GL/year [12].
This leaves a net outflow of 4000 GL/year roughly the equivalent to the water
consumption of the entire urban sector excluding manufacturing. Given the
decreasing contribution that agriculture makes to the Australian economy,
the question arises whether the net outflow of 4000 GL/yr is in the nation’s
long-term interest.
Figure 1.4 shows the virtual water flows in traded crops.
Whilst the problem of under nourishment is a developing-country prob-
lem, over capacity and excess of food is a developed-country problem.
Obesity, unhealthy food habits, more convenient type foods are driving up
water demand in the world. Government subsidies also encourage
over-
production. In the Organisation for Economic Cooperation and Development
(OECD) countries, farmers receive more than one-third of their income from
government subsidies, in total over US$300 billion each year [9].
Increases in life styles in the developing countries will further increase
meat consumption which means increased water consumption compared to
a
cereals- or pulses-based diet.
1.5 The Impact of Climate Change
Much has been written about the impact of climate change. Recently there
have been a record number of reports providing evidence that climate change
is occurring and more importantly the cost of not doing anything to combat
it could cost the world trillions of dollars and the extinction of 40% of the
Water Conservation 9
Virtual Water Flows in Traded Crops
Products are transported around the world, along with the water embedded in them.
Eastern Europe
North America
Western
Europe
FSU
Central America
North Africa
Middle
East
Central and South
Asia
South
America
Central Africa
Southeast
Asia
Southern Africa
Oceanania
Virtual water trade balances of thirteen world regions over the period 1995–1999.
Green to yellow coloured regions have net virtual water export; white to red coloured regions have net virtual
water import. The black arrows show the largest net virtual water flows between regions (>100
Gm
3
per year).
Net exporter
Net importer
–1030 –240 –140 –135 –45 –22 –5 12 20 151 222 380 833
Net virtual water import, Gm
3
1Gm
3
–10
6
m
3
Source: Adapted form Hoekstra, Hung, and IHE Delft, “Virtual Water Trade,” 2002.
26
Figure 1.4 Virtual water flows in traded crops
Source: World Business Council for Sustainable Development – Business in the World of Water.
Geneva, Switzerland. August 2006.
species. The principle factors driving climate change are well-documented
global warming and greenhouse gas effect.
The question is what impact/effect climate change will have on humans,
environment, the economy and the water supplies. A wide-ranging UK study
conducted by the former chief economist of the World Bank, Sir Nicholas
Stern, is the latest and paints a bleak future if no action is taken [13].
The predicted impacts of global warming include the following:
•
Higher maximum temperatures with more hot days and heat waves in
nearly all land areas. The earth’s surface temperature has increased on
average by
06
C ever since temperature measurements were started
in the 1800s. All of the 10 warmest years have occurred since 1990
including each year since 1995. Climate models indicate a global
tem-
perature increase of
14–58
C 25–104
F by 2100 [10]. In Australia
the temperatures could increase by
1–6
C [14]. What this means is
that a city like Brisbane will have in excess of 20 days with average
temperatures above
35
C by 2070 [14].
10 A Practical Approach to Water Conservation
•
Will disrupt traditional rainfall and runoff patterns.
•
Up to 40% of species will face extinction.
•
Longer and more frequent droughts. Already two regional cities in
Australia has almost run out of water. If this pattern continues there is
going to be migration of people from these cities to the capital cities
which have more resources.
•
Extreme weather could reduce global gross domestic product up to
1% [13].
•
An increase in severity and more frequent weather-related catastrophes
like Hurricane Katrina. For an example, the total economic loss from
weather-related catastrophes amounted to US$80 billion out of a total
of 216 billion [15]. An increase in ocean temperatures will lead to a
doubling of Category 4 and 5 hurricanes. Insurance companies will have
trouble covering these disasters due to their severity and frequency.
•
Decrease in water quality by changing water temperatures, flows,
runoff rates and timing, with significant potential impacts on water
users [16].
•
Changes in natural water availability will affect water management,
allocations, prices and reliability [16].
•
Increase in regional conflicts. As the river flows change patterns,
regional conflicts amongst countries that share these rivers are going
to increase. There are over 2000 regional international treaties sharing
water rights in river basins. Some predict that the next world war will
be fought over water not oil.
•
Impacts on global food production due to global warming, change in
rainfall patterns and the increase in carbon dioxide levels resulting in
higher food prices. For an example, a more variable monsoon on the
Indian subcontinent can impact on the food production of a quarter of
a billion people in Bangladesh.
•
Hotter, drier summers mean increased demand for water for per-
sonal use and air-conditioning. According to a study conducted by the
CSIRO, for every degree of global warming, evaporation will increase
by 8%.
Case Study: Impacts of Drought in Australia – Grain Harvest Worst in
10 Years
Australia is heading for its smallest harvest in 10 years. Australian Bureau
of Agricultural and Resource Economics predicted that in the 2006
finan-
cial year economic growth will reduce by 0.7% points. A$6.2 billion
would be wiped from the value of farm production, a 35% decrease.
Wheat harvest alone has reduced from 20 to 9.5 million tons.
Adapted from: Sydney Morning Herald. 30 October 2006. p. 9.