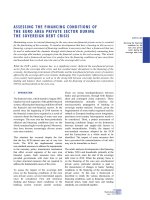
The Euro Imbalances and Financial Deregulation: A Post-Keynesian Interpretation of the European Debt Crisis pot
Bạn đang xem bản rút gọn của tài liệu. Xem và tải ngay bản đầy đủ của tài liệu tại đây (750.3 KB, 37 trang )
Working Paper No. 702
The Euro Imbalances and Financial Deregulation:
A Post-Keynesian Interpretation of the European Debt Crisis
by
Esteban Pérez-Caldentey
UN Economic Commission for Latin America and the Caribbean
Matías Vernengo*
University of Utah
January 2012
* The opinions here expressed are the authors’ own and may not coincide with that of the institutions with
which they are affiliated. A preliminary version of this paper was presented at Universidad Autónoma de
México (UNAM) on September 9, 2011, and at the University of Texas at Austin on November 4, 2011. We
thank, without implicating them, Jörg Bibow, Heiner Flassbeck, James K. Galbraith, Tom Palley, Carlo Panico,
Ignacio Perrotini, and other conference participants for their comments on a preliminary version.
The Levy Economics Institute Working Paper Collection presents research in progress by
Levy Institute scholars and conference participants. The purpose of the series is to
disseminate ideas to and elicit comments from academics and professionals.
Levy Economics Institute of Bard College, founded in 1986, is a nonprofit,
nonpartisan, independently funded research organization devoted to public service.
Through scholarship and economic research it generates viable, effective public policy
responses to important economic problems that profoundly affect the quality of life in
the United States and abroad.
Levy Economics Institute
P.O. Box 5000
Annandale-on-Hudson, NY 12504-5000
Copyright © Levy Economics Institute 2012 All rights reserved
ISSN 1547-366X
1"
"
ABSTRACT
Conventional wisdom suggests that the European debt crisis, which has thus far led to severe
adjustment programs crafted by the European Union and the International Monetary Fund in
both Greece and Ireland, was caused by fiscal profligacy on the part of peripheral, or noncore,
countries in combination with a welfare state model, and that the role of the common
currency—the euro—was at best minimal. This paper aims to show that, contrary to
conventional wisdom, the crisis in Europe is the result of an imbalance between core and
noncore countries that is inherent in the euro economic model. Underpinned by a process of
monetary unification and financial deregulation, core eurozone countries pursued export-led
growth policies—or, more specifically, “beggar thy neighbor” policies—at the expense of
mounting disequilibria and debt accumulation in the periphery. This imbalance became
unsustainable, and this unsustainability was a causal factor in the global financial crisis of 2007–
08. The paper also maintains that the eurozone could avoid cumulative imbalances by adopting
John Maynard Keynes’s notion of the generalized banking principle (a fundamental principle of
his clearing union proposal) as a central element of its monetary integration arrangement.
Keywords: European Union; Current Account Adjustment; Financial Aspects of Economic
Integration
JEL Classifications: F32, F36, O52
"
2"
"
INTRODUCTION
Conventional wisdom suggests that the European debt crisis—which led to severe adjustment
programs sponsored by the European Union (EU) and the International Monetary Fund (IMF) in
Greece, Ireland, and Portugal—was caused by fiscal profligacy on the part of peripheral or
noncore countries and a welfare state model, and that the role of the common currency (the
euro) along with the Maastricht Treaty (1992) was, at best, minimal.
1
In particular, the German
view, as Charles Wyplosz (2010) aptly named it, is that a solution for the crisis involves the
eurozone’s Stability and Growth Pact (SGP). The alternative view, still according to Wyplosz, is
that a reform of EU institutions is needed in order to impose fiscal discipline on the sovereign
national institutions, since a revised SGP would be doomed to fail.
Both views, which dominate discussions within the EU, presume that the problem is
fiscal in nature. In both cases, the crisis is seen as in traditional neoclassical models—in which
excessive fiscal spending implies that, at some point, economic agents lose confidence in the
ability of the State to pay and service its debts, and force adjustment. Excessive spending also
leads to inflationary pressures, which would be the reason, in this view, for the loss of external
competitiveness and not the abandonment of exchange rate policy implicit in a common
currency. In other words, the conventional view implies that the balance of payments position is
the result of the fiscal crisis.
Finally, the conventional story also relegates financial deregulation to a secondary place
in the explanation of the crisis.
2
The idea is that if countries had balanced their budgets and
avoided the temptation to create a welfare state, then excessive private spending would not have
""""""""""""""""""""""""""""""""""""""""""""""""""""""""
1
The euro was initially introduced as an accounting currency on January 1, 1999, replacing the former European
Currency Unit (ECU) at a ratio of one-to-one. The euro entered circulation on January 1, 2002. Seventeen out of 27
member states of the European Union use the euro as a common currency. These are: Belgium, Ireland, France,
Luxembourg, Austria, Slovakia, Germany, Greece, Italy, Malta, Portugal, Finland, Estonia, Spain, Cyprus, the
Netherlands, and Slovenia. Among these, Austria, Belgium, France, Germany, and the Netherlands are referred to
as core countries. Greece, Ireland, Italy, Portugal, and Spain are referred to as nonccore or peripheral countries. The
member countries of the European Union which have not adopted the euro are Bulgaria, the Czech Republic,
Denmark, Latvia, Lithuania, Hungary, Poland, Romania, Sweden, and the United Kingdom.
2
See Soros 2010 for a different view. Soros understands the European Crisis as a banking rather than a fiscal crisis.
More recently Soros (2011) has argued that the European Crisis is a by-product of the 2008 Crash which forced the
financial system to “substitute the sovereign credit of governments for the commercial credit that had collapsed”
(Soros 2011). From here, it follows that the crisis made"the"health "of"the European Banks fall prey to the state of
European public finances. Note also that, in spite of the blame placed on lax government finances, there is broad
recognition that European governments have injected significant bailout packages into the financial sector, and that
this was necessary. As of September 2011, available data for Ireland, Greece, and Spain show that governments’
support to the financial sector net of its estimated recovery amounted to 38 percent, 5.4 percent, and 2.1 percent of
their respective GDP. See IMF 2011a.
3"
"
resulted from perverse public policy incentives, and investors and banks would have been more
aware of the risks involved. So, what is needed in Europe is a good dose of tough love. Noncore
countries must adopt a realistic position regarding their fiscal accounts and ensure the
compliance with the budget thresholds agreed upon in the Maastricht Treaty, as well as
renounce their welfare state objectives. A generalized commitment to fiscal discipline will allow
Europe’s economy to bounce back to its trend—often associated with some measure of the
natural rate of unemployment—of its own volition, without the need for fiscal stimulus.
The old Treasury View, which Keynes and his disciples fought for back in the 1930s, is
alive and well not just in academia, but also in the corridors of power, Finance Ministries,
Central Banks, and international financial organizations which have been instrumental in the
response to the crisis.
3
This paper presents an alternative view of the European crisis.
It sustains that, contrary to conventional wisdom, the euro, and its effects on external
competitiveness—and particularly on the management of macroeconomic policy (both fiscal
and monetary)—and financial deregulation are central to explaining the crisis.
More precisely, arguing from an aggregate demand perspective, this paper shows that
the crisis in Europe is the result of an imbalance between core and noncore countries inherent to
the euro economic model.
4
Underpinned by a process of monetary unification and financial
deregulation, core countries in the eurozone pursued export-led growth policies or, more
specifically, “beggar thy neighbor” policies at the expense of mounting disequilibria and debt
accumulation in the noncore countries or periphery. This imbalance became unsustainable and
surfaced in the course of the Global Crisis (2007-2008). Unfortunately, due to the fact that, in a
crisis, governments must increase expenditure (even if only through automatic stabilizers) in
order to mitigate its impact, while at the same time revenues tend to decline (due to output
contraction or outright recession), budget deficits are inevitable and emerge as a favorite cause
of the crisis itself.
The remainder of the paper is divided into five sections. The proceeding section provides
a simple post-Keynesian heuristic model, providing an integral explanation of the crisis and a
foundation for arguing that the fiscal crisis—which demands a renegotiation of currents debts—
""""""""""""""""""""""""""""""""""""""""""""""""""""""""
3
For a survey of fiscal policy responses to the crisis, see Pérez-Caldentey and Vernengo 2010.
4
This is essentially the same point made by Papadimitriou and Wray (2011); in other words, that this problem is
not due to profligate spending by some nations but rather the setup of the European Monetary Union (EMU) itself.
Also, it should be pointed out that several post-Keynesians, e.g. Philip Arestis, Victoria Chick, and Wynne Godley,
to mention a few, had been critical of the EMU over the years.
4"
"
is not at the heart of the crisis. It was, in fact, a result of the overall crisis. The following section
describes the process of financial liberalization, deregulation, and integration in Europe, and its
effects on financial flows and on the banking system of core and noncore countries. The third
section explains, using some key macroeconomic features, the contradictions inherent to the
euro economic model. The last section provides some conclusions and sorts out the facts and the
myths about the European crisis. A central conclusion is that the solution to the European crisis
requires a profound reform of the euro institutionality and its core principles, and not simply a
fiscal or financial reform. A monetary arrangement such as the euro must include Keynes’
generalized banking principle, which ensures the recycling of surpluses and that the burden of
adjustment be shared by both debtor and creditor economies.
MODELING WHAT TYPE OF CRISIS?
It is essential to distinguish first between an external and an internal debt crisis. Further, it is
also important to note that an external crisis could be a balance of payments or currency crisis in
which debt restructuring is unnecessary; or a debt crisis in which default is unavoidable.
However, it must be noted that both kinds of crises are intertwined in the conventional
literature.
5
In fact, in the traditional currency crisis models (e.g. Krugman 1979), the original source
of the external crisis is a domestic debt crisis. Even more recent models—which include the role
of self-fulfilling expectations and the role of financial sector imbalances (e.g. Krugman 1999)—
remain committed to the assumption that public sector finances are central to currency crises.
6
As in the case of the EU after the adoption of the euro in 1999, an important
characteristic of public debt is that it is denominated in a currency that the sovereign national
units do not directly control, and it is akin to foreign denominated debt. Further, since the euro
members cannot devalue their currencies with respect to each other, the traditional result of
currency crisis models (that is, a severe devaluation of the national currency) cannot occur—at
least not for the national units.
""""""""""""""""""""""""""""""""""""""""""""""""""""""""
5
In particular, the literature on domestic debt default is somewhat unclear on the reasons for governments to reduce
the value of debt by monetizing debt—which is, in monetarist fashion, presumed to cause inflation no matter
what—or to outright default on its obligations. See, for example, Calvo 1988. In fact, public debt denominated in
domestic currency can always be monetized, so there is no reason for default—and in many circumstances, when
the economy is not close to full employment in particular, it might not be inflationary to do so.
6
For a discussion of currency crisis models, see Burnside et al. 2007.
5"
"
The adjustment mechanism, in such a case, must be on the level of activity.
7
Thus, the
model we develop assumes a fixed nominal exchange rate, as well as assuming that changes in
the level of output are central for balance of payments adjustment.
The rate of change of the real exchange rate behaves according to the following rule:
(1) 0 < a < 1, ϕ>0
where e stands for real exchange rate, p for domestic price level, and ff are financial flows.
8
For
this and the other equations of the model, dots refer to changes in levels of the variables and
asterisks for foreign variables. Thus, equation (1) states that the real exchange rate is an inverse
function of the rate of inflation, and is positively related to financial flows.
In turn, financial flows (ff) are postulated as dependent upon the degree of financial
liberalization (FL) and on capacity utilization, to which they respond positively. In other words,
real variables, and not just financial, might also affect the flows off capital. That is,
(2) ; g<0, β>0, 0<ψ<1
where k is the capital stock, y is the level of output.
The next step is the description of the domestic price level dynamics. Prices are
determined as a markup over costs, which is represented as:
9
(3)
where w is the nominal wage, b is the inverse of labor productivity, p* is the price of imported
goods, m is the import coefficient, and p is the share of profits in total income. Conflict over
""""""""""""""""""""""""""""""""""""""""""""""""""""""""
7
Ford (1962) is the classical locus of the notion that countries in the periphery adjusted their balance of payments
disequilibria by variations of the level of income. Interestingly enough, this suggests that countries tied to a
common currency are, in some respects, similar to peripheral countries.
8
Since the nominal exchange rate is fixed, the real exchange rate is the ratio of foreign to domestic prices.
9
This is in accordance with the full cost pricing tradition, but for simplicity we assume only labor and imported
input costs.
6"
"
income distribution is represented by the behavior of firms, which increase prices whenever the
share of profits fall below a certain level. This is represented as follows:
(4)
where p-bar is the target profit share desired by capitalists. From (2), (3), and (4), we can rewrite
(1) as follows:
(5)
Income determination follows traditional Keynesian lines, and can be written as:
(6) ; δ>0, m>0, x>0, λ<0
where x corresponds to exports, i the rate of interest, G government expenditure, and d private
debt.
10
Government expenditure depends on its taxing capacity (τy) and on the cost to raise
funds, which is given mainly by the difference in interest rates paid on a bond of a given
eurozone country ( and those paid on a German bond (
(7) ; 0<τ<1 and φ<0.
""""""""""""""""""""""""""""""""""""""""""""""""""""""""
10
Equation (5) is essentially a multiplier which includes an accelerator term, which in this model suggests that
accumulation would be associated with a certain capital-output ratio. The multiplier cum accelerator was termed a
supermultiplier by John Hicks, and is typical of Kaldorian models of growth. For discussions of Kaldorian models,
see McCombie and Thirlwall 1994 and Bortis 1997.
7"
"
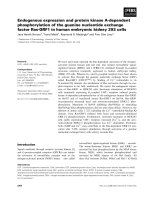
Figure 1
Output and exchange rate dynamics
Equations (5) and (6) form a dynamic system which determines the real exchange rate and the
level of income of the economy, represented in Figure 1.
Equation (2) suggests that an increase in capacity utilization tends to attract capital flows
and leads to a real appreciation, which is represented by the negatively sloped e-dot schedule.
Equation (6) simply suggests that exports respond positively to real exchange depreciations and
lead to output increase, displayed in the positively sloped y-dot schedule. The solution of the
dynamic system provides a stable node and allows for simple comparative static analysis.
11
""""""""""""""""""""""""""""""""""""""""""""""""""""""""
11
The Jacobian matrix which determines the local stability properties of the system is: , and if its
determinant is positive and the trace is negative the system is stable as represented in Figure 1.
8"
"
Let’s assume that wages expand. This would translate into higher domestic prices and a
more appreciated real exchange rate. This would be represented by an inward shift of the e-dot
schedule and would reduce the level of output (since it would have a negative impact on
exports), and through the supermultiplier, would lead to a reduction in income. A financial crisis
can be represented by a collapse of spending (say as a result of a fall in d, private debt or G,
public spending), which would lead to an upward shift on the y-dot schedule.
The fall in capacity utilization would lead to an outflow of capital and a depreciation of
the currency—typical of currency crisis. The final effect of the combination of higher wages and
a financial crisis on the real exchange rate would depend on the relative strength of both forces,
but it would be unequivocally contractionary. Figure 8 shows a situation in which appreciation
of the real exchange rate prevails, moving from E0 to E1. This represents the effects of the crisis
in the deficit countries, where, in the absence of nominal exchange rate depreciation, the
adjustment of the balance of payments must be carried by variations in the level of activity.
9"
"
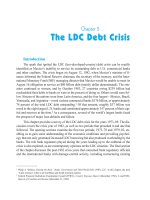
Figure 2
Contraction and appreciation
Although not explicitly modeled, it is presumed that contraction has a negative impact
on tax revenue and requires an expansion of spending associated with the safety net to protect
the unemployed. As a result, in the post-Keynesian perspective, the fiscal crisis (i.e. the increase
in deficits and domestic debt) is the result—rather than the cause—of the external crisis.
The stylized crisis depicted in Figure 2 illustrates the European crisis in a post-
Keynesian framework. Higher unit labor costs in the peripheral countries of Europe (relative to
core countries) led to loss of competitiveness and increasing external problems—which,
combined with the financial crisis, implied a collapse of output and a fiscal crisis. The inability
10"
"
to depreciate the nominal exchange rate, and the absence of a supra-national fiscal authority
who could transfer resources, implies that contraction is the solution for the external imbalances.
FINANCIAL INTEGRATION/DEREGULATION IN EUROPE AND THE EURO
The road to financial integration in Europe began in early 1957 with the signing of the Treaty of
Rome, which set out the basics for the creation of a European single market for financial
services. However, in spite of several initiatives in this direction, the progress was slow. Only
by the late 1980s and early 1990s, spurred by the Single European Act (1987), did most
European countries embark definitely on a financial liberalization strategy.
During this time, most countries lifted capital controls, deregulated interest rates, and
adopted the European Directives—which are considered to be a crucial step toward the
foundation of the Single Market Program in banking and financial services.
12
These were meant
to harmonize rules, supervision, and regulation of financial institutions, as well as to establish
the principle of home country control and the so-called European Passport (branches and the
provision of services across borders throughout the EC); see Table 1 below.
13
The thrust for financial deregulation was further pursued by the adoption of a five-year
financial harmonization program: the Financial Services Action Plan (1999).
""""""""""""""""""""""""""""""""""""""""""""""""""""""""
12
“Directives” are legislative acts requiring member states to achieve specific results without dictating the means.
13
The first banking directive introduced the Single Banking License in 1989, a significant step toward the
unification of banking legislation and regulation.
11"
"
Table 1
Financial liberalization and integration in Europe prior to the introduction of the euro
Lifting of
capital controls
Interest rate
deregulation
First Banking
Directive
Second
Banking
Directive
Belgium
1991
1990
1993
1994
Denmark
1982
1988
1980
1991
France
1990
1990
1980
1992
Germany
1967
1981
1978
1992
Greece
1994
1993
1981
1992
Ireland
1985
1993
1989
1992
Italy
1983
1990
1985
1992
Luxemburg
1990
1990
1981
1993
Netherlands
1980
1981
1978
1992
Portugal
1992
1992
1992
1992
Spain
1992
1992
1987
1994
United
Kingdom
1979
1979
1979
1993
Source:
Buch and Heinrich 2002
The FSAP was meant to harmonize the EU Member States’ rules on a whole range of
financial services, including securities, banking, insurance, mortgages, pensions, and other
forms of financial transactions through the implementation of 42 measures in these different
areas. More specifically, its objectives included: 1) the development of a single market for
wholesale financial services; 2) the creation of open and secure retail markets; 3) the
establishment of clear, efficient, prudential rules and supervision of financial services; and 4)
the establishment of the conditions for an optimal single financial market.
Member countries’ commitment to the FSAP was reinforced by a series of initiatives
including the Lisbon Agenda (2000), the re-launching of the Lisbon Strategy (2005), and the
White Paper (2005). As stated in the latter:
Financial markets are pivotal for the functioning of modern economies. The more
they are integrated, the more efficient the allocation of economic resources and
long run economic performance will be. Completing the single market in
financial services is thus a crucial part of the Lisbon economic reform process;
and essential for the EU’s global competitiveness (European Commission 2005-
2010, p. 5).
12"
"
Most of the measures of the FSAP passed the EU legislative process at the end of 2003;
see Kalemi-Ozcan et al. (2010). The latest available public releases show that 25 out of 27
countries of the European Union had provided information on the entry into force of the
directives of the FSAP.
14
The progress of financial liberalization is reflected in the Chinn-Ito index (2011), which
measures openness in capital account transactions. The higher the value of the index, the greater
the degree of openness of an economy to cross-border capital transactions. As Table 2 shows,
the level of financial openness increased systematically throughout the 1990s, reflecting the fact
that European countries— in particular, the core and noncore countries (that is, countries that
adopted the euro as their common currency)—became, on average, more “financially open.”
Both groups of countries reached the status of full liberalization after the adoption of the euro.
""""""""""""""""""""""""""""""""""""""""""""""""""""""""
14
See European Commission 2011. The countries that have not provided information are Bulgaria and Rumania.
The directives for which there is no information on the date of entry into force include the directives on takeover
bids (2004/25), taking up and pursuit of the business of credit institutions (2006/48), capital adequacy (2006/49),
transparency (2004/109), markets and financial institutions (2004/39), and money laundering (2005/60). Some of
these are part of the Lamfalussy initiatives (directives 109 and 39). The money laundering is a complement to the
FSAP. Since the Global Crisis the EU adopted post directives (European Commission 2011).
13"
"
Table 2
European Union
Chinn-Ito Index of capital account liberalization for selected country groupings
1990-2009
1990-1994
1995-1999
2000-2004
2005-2009
Core Countries
83.2
96.1
97.4
100.0
Noncore Countries
19.5
80.5
96.6
100.0
Other Euro Countries
-37.9
-9.5
24.7
81.3
Non-Euro Countries
8.8
39.0
66.9
87.9
Note:
The Chinn-Ito index is expressed in terms of its highest value for all countries considered in their
sample. Thus, a value of 100 means complete liberalization.
Core countries include: Austria, Belgium, France, Germany, and the Netherlands. Noncore countries
include: Greece, Ireland, Italy, Portugal, and Spain. Other euro countries include: Estonia, Malta, the
Slovak Republic, and Slovenia. Non-euro countries are comprised of Sweden and the United Kingdom.
Source:
Based on Chin and Ito 2008.
The process of harmonization and intra-European liberalization of flows was parallel to
the process of the establishment and introduction of the euro, which came into effect on January
1, 2002. The establishment of a single currency and monetary union was based on prior
compliance with convergence criteria including: inflation, fiscal balances, exchange rate, and
interest rate convergence set out in the Maastricht Treaty.
15
Exchange rate convergence was meant to avoid the manipulation of the exchange rate
prior to the establishment of a monetary union in order to achieve an improved competitive
position at the time of entry. The justification of inflation and budget convergence was the
avoidance of an inflationary bias in the monetary union.
Fiscal convergence meant, in practice, that governments had to achieve a ratio of
planned or actual government deficit to GDP at market prices equal to or less than 3 percent at
any time. The 3 percent budget sustainability criterion, which was independent of the cycle,
combined with earlier legislation contained in the Pact for Growth and Stability (1997), required
""""""""""""""""""""""""""""""""""""""""""""""""""""""""
15
The four convergence criteria are defined in article 109j of the Maastricht Treaty (in its Chapter IV under the
heading Transitional Provisions), and are explained in one of the protocols. The interest rate convergence criterion
is defined as “the durability of convergence achieved by the Member State and of its participation in the Exchange
Rate Mechanism of the European Monetary System being reflected in the long-term interest rate levels.” (European
Council 1992a, p. 24) This is explained in the protocols as follows: “The criterion on the convergence of interest
rates…of this Treaty shall mean that, observed over a period of one year before the examination, a Member State
has had an average nominal long-term interest rate that does not exceed by more than 2 percentage points that of, at
most, the three best performing Member States in terms of price stability. Interest rates shall be measured on the
basis of long term government bonds or comparable securities, taking into account differences in national
definitions” (European Council 1992b, p. 30).
14"
"
European countries to balance their budget or be in a surplus position in the medium run; i.e.,
countries had to run surpluses in good times in order to offset deficits in bad times.
Interest rate convergence is interpreted as a measure to limit arbitrage opportunities, thus
limiting capital gains and losses prior to the entry into force of the monetary union. However,
this criterion is considered redundant (Kenen 1995; De Grauwe 2003). In fact, financial
deregulation, capital mobility, and exchange rate convergence (and eventually the adoption of a
unique currency) lead to nominal interest rate convergence. In this sense, as put by De Grauwe:
“Once countries were expected to join European Monetary Union (EMU), long-term interest
rates converged automatically” (Ibid., p. 136). In addition, under interest rate parity theorem
conditions, nominal exchange rate and inflation convergence were tantamount to real,
uncovered interest parity conditions.
The process of harmonization of EU financial legislation and regulation, and the process
of adoption of a single currency led to an increase in cross-border financial flows and, as
expected, a process of convergence of interest rates. The growth of financial flows can also be
ascertained by the expansion of the balance sheet of European countries. As shown in Table 3,
the external position of member countries of the European Union banks (core, noncore, and
non-euro countries included)
vis-à-vis
all sectors in assets and liabilities as percentages of GDP
increased rapidly throughout the liberalization and the adoption of euro period.
A similar phenomenon occurred with the evolution of the size of capital markets; see
Table 4. The size of capital measured in terms of GDP increased by more than a third in core
countries, and more than doubled in noncore countries during the consolidation period of
financial liberalization and regulation, and following the adoption of the euro.
16
""""""""""""""""""""""""""""""""""""""""""""""""""""""""
16
Available evidence indicates that the majority of assets are nationally owned—75 percent, according to Allen et
al. 2011.
15"
"
Table 3
Growth in balance sheets in the European Union measured by the external position of
banks (assets and liabilities)
vis-à-vis
all sectors as percentages of GDP
1990-2011 (Averages)
Assets
Period
Core countries
Noncore countries
Non-Euro
1990-1995
47.40
22.52
58.97
1996-2001
61.96
55.74
76.40
2002-2010
118.31
96.15
131.37
Liabilities
Period
Core countries
Noncore countries
Non-Euro
1990-1995
41.79
19.89
63.26
1996-2001
63.40
60.31
84.35
2002-2010
102.44
107.22
148.44
Note:
Core countries include: Austria, Belgium, France, Germany, and the Netherlands. Noncore countries
include: Greece, Ireland, Italy, Portugal, and Spain. Non-euro countries include Sweden and the United
Kingdom.
Source:
Bank for International Settlements 2011, Table 2A.
Table 4
Size of Capital Markets 1990-2009 as percentage of GDP in core, noncore, and
eurozone countries of Europe
1990-2009 (Averages)
Core
Noncore
Eurozone
1990-1994
1.61
0.79
n/a
1995-1999
2.04
1.14
1.76
2000-2004
2.51
1.96
2.27
2005-2009
2.82
3.22
2.63
Note:
Core countries include: Austria, Belgium, France, Germany, the Netherlands. Noncore countries
include: Greece, Ireland, Italy, Portugal, and Spain.
Source:
European Central Bank 2011.
The empirical evidence that has attempted to isolate both the effects of financial
liberalization and deregulation and those of the euro on the increase in cross-border flows
highlights the importance of both sets of policy, but attributes greater importance to the latter
(i.e., the adoption of the euro). This is explained mainly by to the elimination of exchange rate
risk due to the adoption of a single currency (Ibid.). Recent evidence presented by Kalemi-
16"
"
Ozcan et al. (2010) indicates that bilateral bank holdings and transactions among the euro area
economies increased by roughly 40 percent following the adoption of the euro.
17
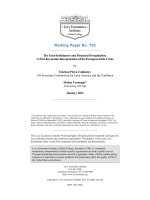
At the same time, financial liberalization and the process of adoption of the euro brought
about a clear and marked convergence in both short and long term interest rates. Figure 3 below
shows that the secondary market yields of 10-year government bonds for core and noncore (or
peripheral) countries stood at 6 percent and 10 percent, respectively, and reached 5 percent for
both country groupings in January 2002 (the month and year the euro was implemented). As
well, the dispersion for all eurozone member states declined from 5 percent to 1 percent in the
same period, and registered further declines thereafter until the 2008-2009 Global Crisis.
Figure 3
European Union. Average secondary market yields of government bonds with
maturities of close to ten years for core and noncore (peripheral) countries and dispersion, in
percentages. April 1993-April 2011 (Monthly Data).
Source:
Authors’ own, based on European Central Bank 2011.
Interest rate convergence lowered interest rate margins especially in noncore countries.
Between 1990-1995 and 1996-2001, interest rate margins—as a percentage of total earning
assets—declined from 3.9 percent to 2.8 percent, while these remained roughly constant in core
countries. This translated into a decline in the rate of return over assets in noncore countries
from 0.8 percent to 0.5 percent between 1990-1995 and 1996-2001; see Table 5 below.
""""""""""""""""""""""""""""""""""""""""""""""""""""""""
17
Other estimates reach a much higher figure.
Adoption"of"Euro"(January"2002)"
17"
"
In the face of a decline in ROA (as in the case of noncore countries between 1990-1995
and 1996-2007), or for a roughly constant ROE (as in the case of both core and noncore
countries between 1996-2001 and 2002-2007), the levels of profitability (ROE) of the financial
system can be maintained or increased by higher levels of leverage (or indebtedness).
18
The
levels of leverage were particularly high in some of the core countries. Available evidence on
Germany, provided by Bloomberg, shows that leverage for the major banks increased on
average from 27 to 45 between 1996 and 2007. As well, data for 2007 for 14 of the major
financial institutions of Europe (located in core countries) indicates that the average leverage
ratio was 34 (with a maximum of 50).
19
""""""""""""""""""""""""""""""""""""""""""""""""""""""""
18
The simple banking profit identity, also known as the Du Pont de Nemours and Company return over equity
(ROE) decomposition, states that the ratio of earnings to equity equals the product of the ratio of earnings to assets
and assets to equity. That is,
( )*( )
where and thus,
*
Earnings Earnings Assets
Equity Assets Equity
Assets
Leverage
Equity
Earnings Earnings
Leverage
Equity Asets
=
=
=
As a result, for a given assets to equity ratio, the greater the leverage, the greater the profit opportunities captured
by the ratio of earnings over equity.
19
To put things in perspective: If the leverage ratio is equal to 10, then debt and equity finance represent 90 percent
and 10 percent of the financial intermediary’s acquisition of assets, respectively. With a leverage ratio of 34, the
respective debt and equity ratios are 97 percent and 3 percent, respectively.
18#
#
Table 5
Selected indicators of the performance of the banking system in the European Union (1990-2007)
Core Countries
Period
Financial Deepening
Costs/Income
Interest margins
ROA
Concentration
Z-Score
1990-1995
92.5
72.8
2.3
0.3
67.2
15.4
1996-2001
103.5
67.8
2.5
0.9
67.2
9.4
2002-2007
108.2
70.2
2.1
1.0
68.2
7.3
Noncore countries
Period
Financial Deepening
Costs/Income
Interest margins
ROA
Concentration
Z-Score
1990-1995
56.8
67.6
3.9
0.8
72.1
23.9
1996-2001
73.3
70.8
2.8
0.5
66.7
25.6
2002-2007
112.8
66.5
2.2
0.4
68.9
15.8
Eurozone Countries
Period
Financial Deepening
Costs/Income
Interest margins
ROA
Concentration
Z-Score
1990-1995
77.0
65.8
3.1
0.6
73.7
18.1
1996-2001
77.3
69.9
2.7
0.7
68.8
12.7
2002-2007
101.3
67.6
2.4
0.8
70.8
10.4
Note:
Core countries include: Austria, Belgium, France, Germany, and the Netherlands. Noncore countries include: Greece, Ireland, Italy, Portugal, and Spain.
“Financial deepening” is measured by private credit, deposit money banks, and other financial institutions. “Costs/Income” is measured as total costs, as a share
of total income of all commercial banks. “Interest margins” equals the accounting value of a bank's net interest revenue, as a share of its interest-bearing (total
earning) assets. ROA equals “rate of return over assets.” “Concentration” refers to assets of three largest banks as a share of assets of all commercial banks. “Z-
Score” is estimated as ROA+equity/assets/sd(ROA); the standard deviation of ROA, sd(ROA), is estimated as a 5-year moving average.
Source:
Based on Beck and Demirgüç-Kunt 2009.
19#
#
The freedom of financial flows which moved throughout Europe and abroad, low
borrowing costs, easy access to liquidity via leveraging, and no exchange rate risk provided a
false sense of prosperity in a low-risk environment.
STYLIZED FACTS OF THE EURO IMBALANCES
The constraints imposed on government activities in the name of ‘fiscal sustainability’ by the
Maastricht Treaty (jointly with the Stability and Growth Pact) placed private expenditure and
exports at the center stage of aggregate demand, and as the linchpins of growth.
Core countries were able to pursue wage moderation and restraint policies to contain
labor costs below those of noncore countries—as in the case of Germany and Austria, and more
generally, in the case of the other countries (Belgium, France, and the Netherlands). As Table 6
below shows, between 2000 and 2007, unit labor costs remained essentially constant, increasing
merely 7 percent on average for core countries. Contrarily, labor unit costs for noncore countries
witnessed a clear upward trend, increasing by 24 percent for the same period. Under a fixed
regime, and within a context where the bulk of trade is intraregional (roughly around 70 percent
using the export market share), this amounted to a real devaluation, and a basis to pursue export-
led growth policies—and indeed, more precisely, “beggar thy neighbor” policies.
20
Noncore countries did not have the means to counteract and offset core countries’
“beggar thy neighbor” policies. The euro common currency arrangement precludes nominal
depreciations to compensate for the increase in wages in the periphery relative to those in core
countries. Further, there are few mechanisms for large fiscal transfers which would compensate
the loss of output associated with reduced competitiveness in the countries with higher costs.
########################################################
20
Computations were undertaken with WITS (2011) for the 27 European Union member states for 2006 using the
SITC Rev.3.
20#
#
Table 6
Average unit labor costs indices for noncore and core countries (2000=100)
Average noncore
countries
Average core
countries
Ratio of noncore to core
country unit labor costs
2000
100
100
1.00
2001
102.5
102.4
1.00
2002
106.5
104.6
1.02
2003
110.1
106.0
1.04
2004
112.4
106.0
1.06
2005
116.9
106.7
1.10
2006
120.4
107.4
1.12
2007
124.3
108.5
1.15
2008
130.1
111.5
1.17
2009
132.0
116.7
1.13
2010
129.5
116.2
1.11
Source:
Based on Eurostat (2011).
Faced with higher relative labor costs and real exchange appreciations, which
undermined their external competitiveness, noncore countries were left with the option of
growing by increasing internal aggregate demand. This is illustrated in Figure 4, which shows
gross formation of fixed capital (GFFC; i.e. investment demand) as a percentage of GDP
between 1996 and 2007, the year prior to the explosion of the Global Crisis. In 1996, both core
and noncore countries had a similar GFFC relative to GDP (20 percent and 21 percent
respectively). Thereafter, the GFFC shot up in noncore countries, while in core countries it
stagnated or declined. From the year of the implementation of the euro (2002) until 2007, GFFC
in noncore countries was roughly 4 percentage points of GDP above that of core countries.
21
########################################################
21
A similar exercise using domestic final consumption over GDP, instead of investment, shows a similar result. For
the period 2002-2007, final consumption averaged 78 percent and 75 percent of GDP for noncore and core
countries, respectively.
21#
#
Figure 4
Eurozone: Gross formation of fixed capital (GFFC) as a percentage of GDP for core
and noncore countries (1996-2007)
Source:
Based on World Bank 2011
Greater domestic demand and higher labor costs (real exchange rate appreciation) in the
periphery had a negative impact on its constituent countries’ external positions. As shown in
Figure 5 and Table 7 below, the current account balance for noncore countries deteriorated
during the finalization of the European integration process, and even more so following the
introduction of the euro. In other words, it seems fairly reasonable to believe that unit labor
costs impacted the external performance of European economies, and that the common currency
was central to the outcome.
Contrarily, core countries’ external positions remained in surplus and improved
following the introduction of the euro. In 2001, core countries registered, on average, a surplus
on their current account equivalent to 0.9 percent of GDP. In 2007, the surplus had increased to
3.6 percent of GDP, on average (see Appendix for data at the country level).
22
########################################################
22
In the period 2001-2007, at the country level, only France in 2005, 2006, and 2007, and Austria in 2001
registered deficits in the current accounts. With the exception of France in 2007, the current account deficits were
below 1 percent of GDP. See Appendix.
22#
#
Figure 5
Current account balances for noncore countries 1980-2010, as percentages of GDP
Source:
World Bank 2011
Table 7
Financial balances of core and noncore countries as percentages of GDP,
2001-2010 (averages)
2001
2002
2003
2004
2005
2006
2007
2008
2009
2010
Current Account Balance
Average Core
Countries
0.9
2.6
2.7
3.6
3.2
3.9
3.6
2.5
2.5
3.0
Average
Noncore
Countries
-4.4
-3.9
-3.6
-4.2
-6.1
-7.4
-8.5
-9.2
-6.4
-5.6
Fiscal Balance
Average Core
Countries
-1.0
-2.3
-2.8
-2.4
-2.3
-0.8
-0.6
-1.0
-5.5
-5.0
Average
Noncore
Countries
-2.3
-2.3
-2.4
-2.7
-2.6
-1.7
-1.8
-5.5
-11.3
-
13.2
Private Sector Balance
Average Core
Countries
1.5
4.4
4.9
5.5
5.0
4.5
4.1
3.2
6.8
6.9
Average
Noncore
Countries
-2.1
-1.6
-1.2
-1.5
-3.5
-5.7
-6.7
-3.7
4.9
7.5
Sources:
Based on World Banks 2011; Eurostat 2011
23#
#
Yet, while the external sector deteriorated, and contrary to conventional wisdom,
noncore countries managed to maintain fiscal positions within the guidelines set out in the
Maastricht Treaty. Following the adoption of the euro and until the onset of the crisis, all
noncore countries’ fiscal deficits, on average, were below 3 percent of GDP and, with the
exception of 2006 and 2007, were below or at the level of average core countries’ fiscal deficits.
Moreover, a more detailed analysis at the country level also shows that fiscal deficits
were not endemic to noncore countries. Ireland and Spain, two noncore countries, were able to
reach fiscal surpluses. Ireland’s fiscal accounts were continually in surplus between 2001 and
2007. Spain was able to register budget surpluses between 2005 and 2007; see Appendix.
The expansion of internal demand was sustained by the decline in interest rates (i.e.,
interest rate convergence) in the noncore countries and, more importantly, by the process of
financial integration and deregulation. The latter permitted finance to flow from core to noncore
countries where the relative rates of return were higher. Easy access to finance permitted the
funding of increasing current account deficits and also private debt accumulation.
As shown in Table 7 above, private balances show a rising average deficit for noncore
countries since the introduction of the euro. In 2002, the private sector deficit of the noncore
countries averaged 1.6 percent of GDP and increased to reach 6.7 percent of GDP in 2007.
The private sector deficits are, to a great extent, the result of household indebtedness—
particularly significant in some of the peripheral countries of Europe like Ireland, Portugal, and
Spain, and to a lesser degree in Greece and Italy. As noted by Zarco (2009), the total liabilities
of households and non-profit institutions serving households as a percentage of their disposable
income increased in most countries between 2000 and 2007. It was over 100 percent in 2007 for
Germany, Spain, and Portugal, and was over 200 percent for Denmark in the same year (Zarco
2009, p.4).
24#
#
Figure 6
Growth rate of mortgage loans for selected European countries (1999-2007)
Source:
ECB 2009
Further, according to the European Central Bank (2009), the growth rates of mortgage loans in
the peripheral countries increased significantly; see Figure 6 above. Arguably, in certain
countries of the periphery, a housing bubble—similar to the one in the United States—had
developed with the process of financial deregulation.
Private debt accumulation (underpinned by financial liberalization which allowed
finance to flow from core to noncore countries), in turn, contributed to underpinning internal
aggregate demand growth and imports. Thus, the lending boom in the periphery allowed core
countries to pursue a strategy of export-led growth.
The imbalances between a set of core countries growing at the expense of mounting
disequilibria and debt accumulation in the noncore countries or periphery made them vulnerable
to changing external conditions, as shown by the onset and impact of the Global Crisis (2007-
2008).
23
Unfortunately, due to the fact that in a time of crisis, governments must increase
expenditure (even if only through automatic stabilizers) in order to mitigate its impact, while at
the same time revenues tend to decline (due to output contraction or outright recession), budget
########################################################
23
Cesaratto and Stirati (2011) suggest that German mercantilism—that is, the stagnant wages and export-led
strategy of growth in Germany—is at the center of the crisis. Our analysis suggests that export-led strategy was a
feature of the ensemble of core countries.