Air pollution from traffic and cancer incidence: a Danish cohort study potx
Bạn đang xem bản rút gọn của tài liệu. Xem và tải ngay bản đầy đủ của tài liệu tại đây (309.37 KB, 11 trang )
RESEARC H Open Access
Air pollution from traffic and cancer incidence:
a Danish cohort study
Ole Raaschou-Nielsen
1*
, Zorana J Andersen
1
, Martin Hvidberg
2
, Steen S Jensen
2
, Matthias Ketzel
2
, Mette Sørensen
1
,
Johnni Hansen
1
, Steffen Loft
3
, Kim Overvad
4
and Anne Tjønneland
1
Abstract
Background: Vehicle engine exhaust includes ultrafine particles with a large surface area and containing absorbed
polycyclic aromatic hydrocarbons, transition metals and other substances. Ultrafine particles and soluble chemicals
can be transported from the airways to other organs, such as the liver, kidneys, and brain. Our aim was to
investigate whether air pollution from traffic is associated with risk for other cancers than lung cancer.
Methods: We followed up 54,304 participants in the Danish Diet Cancer and Health cohort for 20 selected cancers
in the Danish Cancer Registry, from enrolment in 1993-1997 until 2006, and traced their residential addresses from
1971 onwards in the Central Population Registry. We used modeled concentration of nitrogen oxides (NO
x
) and
amount of traffic at the residence as indicato rs of traffic-related air pollution and used Cox models to estimate
incidence rate ratios (IRRs) after adjustment for potential confound ers.
Results: NO
x
at the residence was significantly associated with risks for cervical cancer (IRR, 2.45; 95% confidence
interval [CI], 1.01;5.93, per 100 μg/m
3
NO
x
) and brain cancer (IRR, 2.28; 95% CI, 1.25;4.19, per 100 μg/m
3
NO
x
).
Conclusions: This hypothesis-generating study indicates that traffic-related air pollution might increase the risks for
cervical and brain cancer, which should be tested in future studies.
Background
It has be en known for decades that urban air is polluted
by mutagenic and carcinogenic substances [1], although
at concentrations much lower than those in e.g. cigar-
ette smoke and certain work environments. Nielsen
et al. [2] found that the concentrations of mutagenic
polycyclic aromatic hydrocarbons (PAHs) in Copenha-
gen were similar to those in other cities in industrialized
countries a nd co ncluded that t raffic w as the major
source of PAHs in Copenhagen in the early 1990s. Ubi-
quitous air pollution with low levels of carcinogens is a
public health concern, because large populations a re
exposed; therefore, even a marginally increased risk for
cancer at the individual level would result in many cases
at the population level.
Ultrafine particles, < 100 nm in diameter, have
received much attention since the 1990s because of
their high numbers and large surface area [3]. They
constitute about 50% of the total surface area of depos-
ited particles in the lung [4]. The airways are the pri-
mary target organs, b ut accumulating e vidence from
experiments in animals shows that ultrafine particles
can translocate to other organs, such as the liver, kid-
neys, heart and brain [5-7]. Although the number of
particles that accumulate in secondary target organs is
several orders of magnitude lower than the lung dose, it
may not be negligible for carcinogenic processes [4,8].
Previous epidemiological studies have shown associa-
tions between ambient air pollution and risk for lung
cancer [9-13], but other cancers might also be associated
with exposure to polluted air. Cancers of the mouth,
pharynx, and larynx are strongly related to smoking and
might therefore also be related to other sources of air
pollution, as indicated by associations with exposure to
combusted indoor fuel [14] and occupational exposure to
engine exhaust [15-18].
Bladder cancer has been associated with residence in a
polluted city area in a few studies of the general popula-
tion [19,20] and with occupational exposure to air pollu-
tion (traffic, engine exhaust, PAHs) in several (but not
* Correspondence:
1
Institute of Cancer Epidemiology, Danish Cancer Society, Strandboulevarden
49, 2100 Copenhagen, Denmark
Full list of author information is available at the end of the article
Raaschou-Nielsen et al. Environmental Health 2011, 10:67
/>© 2011 Raaschou-Niel sen et al; licensee BioMed Central Ltd. This is an Open Access article distributed under t he terms of the Creative
Commons Attribution Licen se ( which permits unrestricted use, distribution, and
reproduction in any medium, provided the origi nal work is properly cited.
all) studies [21-24]. Other cancers have b een studied
only sparsely in relation to air pollution. Occupational
exposure to diesel engine exhaust was associated with
risks for cervical [17], ovarian [23], and gastric cancer
[25], and several studies indicated associations between
occupations associated with exposure to air pollution
and risk for kidney cancer [15,16,26]. An ecological
association was foun d between ambient air emissions of
volatile organic compounds and brain cancer incidence
in Indiana, USA [27], and a rece nt study indicated that
air pollution at the residence increased the risk for
breast cancer [28]. Benzene at relatively high occupa-
tional concentrations is a known leukemogen, and a few
studies have suggeste d that ambient concentrations near
point sources [29] and traffic [30] might be associated
with risk for hematological cancers.
We have rece ntly reported on traf fic-relate d air pollu-
tion and lung cancer i n a large Danish cohort [13]. The
individual-level assessment of exposure for all cohort
members fa cilitates a hypothesis-gene rating screening of
possible associations with other cancers than lung cancer.
The aim of the study report ed here was to investigate
whether air pollution from traffic at the residence was
associated with risks for 20 selected, re latively frequent
cancers in a large Danish cohort.
Methods
Design and study participants
During 1993-1997, 57,053 men (48% ) and women (52%)
aged 50-64 years and living in Copenhagen and Aarhus
areas were recruited into the Diet, Cancer and Health
cohort study [31]. The baseline examination included a
self-administered questionnaire on dietary habits, which
covered 192 food and beverage items. The participants
also filled in a questionnaire on smoking habits (status,
intensity, and duration), occupation, length of school
attendance, reproductive factors, history of diseases and
medication, and a number of other health-related items
[31]. Smoking intensity was calculated by equating a cigar-
ette to 1 g, a cheroot or a pipe to 3 g, and a cigar to 4.5 g
of tobacco. Staff in the study c linics obtained anthropo-
metric measurements, including height and weight. Rele-
vant Danish ethical committees and data protection
agencies approved the study, and written informed con-
sent was obtained from all participants.
Each cohort member was followed up for cancer
occurrence until 27 June 2006 in the Danish Cancer
Registry [32] and t he Danish Pathology Data Bank by
use of the unique personal identification number. We
traced the date of death, emigration, or disappearance
and retrieved the addresses of each cohort member
between 1 January 1971 and 27 June 2006 in the Central
Population Registry by use of the personal identification
number. The dates of moving into and leaving each
address were noted, and the addresses were linked to
the Danish address database to obtai n geographical
coordinates (denoted in the following as ‘ geocodes’ ),
which were obtained for 94% of the addresses.
Exposure assessment
The outdoor concentration of NO
x
was calculated for
each year at the residential addresses of each cohort
member with the Danish AirG IS modeling system (s ee
and [33]). Air-
GIS is based on a geographical information system and
provides estimates of traffic-related air pollution with
high temporal and address level spatial resolution. Air
pollution at a location is calculated as the sum of three
contributors: (1) local air pollution from street traffic,
calculated from input data on traffic (intensity and
type), emission factors for the car fleet, street and build-
ing geometry, and meteorology; (2) urban background,
calculated from data on urban vehicle emission density,
city dimensions, and building heights; and (3) regional
background, estimated from trends at rural monitoring
stations and from national vehicle emissions.
Input data for the AirGIS system were established from
various sources and were integrated into the model. A
geographical information system (GIS) road network,
including construction year and traffic data for the period
1960-2005, was developed and a database on emission fac-
tors for the Danish car fleet, with data on light- and
heavy-duty vehicles back to 1960, was built and entered
into the emission module of the street pollution model.
The national topographic GIS database of buildings was
supplemented by the construction year and b uilding
height from the national Buildi ng and Dwel ling Register,
which provided the correct st reet and building geometry
for a given year at a given address. The geocodes of an
address refer to the location of the front door with a preci-
sion within 5 m for most addresses. With the geocode of
an address and a specified year as the starting point, the
AirGIS system automatically generates street configuration
data for the street pollution model, including street orien-
tation, street width, building heights in wind sectors, traffic
amount, speed and type as well as other data required as
inputs for the modeling system. Air pollution is calculated
in 2 m height at the façade of the address building. The
AirGIS system has been successfully validated in several
studies [34-36] and the correlation between modeled and
measured 1/2-year mean NO
2
concentrations at 204 posi-
tions in the greater Copenhagen area showed a correlation
coefficient (r) of 0.90 with measured concentrations being
on average 11% lower than the modeled [35]. We also
compared modeled and measured one-month mean
concentrations of NO
x
and NO
2
over a 12-year period
(1995-2006) in a busy street in Copenhagen (Jagtvej,
25,000 vehicles per d ay, street canyon), which showed
Raaschou-Nielsen et al. Environmental Health 2011, 10:67
/>Page 2 of 11
correlation coefficients (r) of 0.88 for NO
x
and 0.67 for
NO
2
. The modeled mean concentration over the whole
12-year period w as 6% lower than the measured concen-
trations for NO
x
and 12% lower for NO
2
[36]. Thus, the
model predicted both geographical and temporal variation
well.
We used the concentration of nitrogen oxides (NO
x
)
as an indicator of air pollution from traffic because NO
x
level correlates strongly with other traffic-related pollu-
tants in Danish s treets, such as pa rticles: r =0.93for
total particle number concentration (size, 10-700 nm)
and r = 0.70 for particles with a diameter < 10 μm [37].
We calculated the time-weighted average NO
x
concen-
tration at all addresses from 1 January 1971 until cancer
diagnosis, censoring, or end of follow-up and e ntered it
as a time-dependent variable into the statistical cancer
risk model. If NO
x
could not be calculated because of
failed geocoding of an address, we imputed the concen-
tration from that calculated at the preceding address, or
that at the subsequent address if the NO
x
concentration
was missing for the first address. We included only par-
ticipants for whom the residential addresses were
known and geocoded for 80% or more of the time
between 1 January 1971 and censoring, i.e. persons for
whom NO
x
concentrations were imputed for less than
20% of the time.
We used the geocode of the address at the time of enrol-
ment into the cohort and the GIS road network with traf-
fic data to derive two variables indicating the amount of
traffic near the residence: presence of a street with a traffic
density > 10,000 vehicles per day within 50 m of the resi-
dence, and the total number of kilometers driven by vehi-
cles within 200 m of the residence each day.
We considered the calculated NO
x
concentration a s
our primary exposure variable because it takes into
account a number of factors that affect traffic-related air
pollution and because it reflects exposure over several
decades. The two supplementary measures of traffic at
the residence are simple indicators that reflect only the
time of enrolment into the cohort. The three exposure
indicators correlated moderately, with correlation coeffi-
cients of 0.53 between calculated NO
x
and presence of a
major road within 50 m, 0.43 between calculated NO
x
and traffic lo ad within 200 m, and 0.43 between pre-
senceofamajorroadwithin50mandtrafficload
within200m.WegavemostweighttotheNO
x
mea-
sure in interpreting the results, so that the results for
the two traffic indicators could strengthen or weaken
interpretation of an effect of NO
x
as a traffic-related air
polluter.
The Danish AirGIS modeling system cannot provide
reliable estimates for historical particulate matter con-
centrations because the required input data on historical
urban background concentrations and historical emis-
sion factors for the Danish car fleet are not available.
Statistical methods
The end-points for the risk analyses were first primary
cancers others than lung can cer. We included only can-
cer types of which there were more than 30 cases during
follow-up. Incidence rate ratios (IRRs) were estimated
with Cox proportional hazards models, and 95% confi-
denc e intervals (CIs) were ca lculat ed on the basis of the
Wald test. Age was the time scale, which ensured that
the risk estimates were base d on comparisons of indivi-
duals at exactly the same age, and analyses were cor-
rected for delayed entry at the time of enrolment.
People with a cancer diagnosis before entry were
excluded from the analyses. Participants were censored
atthetimeofdeath,thetimeoflosstofollow-updue
to emigration or disappearance, the time of a cancer
diagnosis other than that under study, or 2 7 June 2006
(end of follow-up), whichever came first.
The analyses were adjusted for potential confounding
factors defined a priori for each cancer site on the basis of
two criteria: 1) being an established or likely risk factor
for the cancer and 2) data being available. These were:
smoking status (never, former, current), smoking intensity
(lifetime average, linear), smoking duration (linear), envir-
onmental tobacco smoke (dichotomous, no or low, i.e. “no
smoker in the home and environmental tobacco smoke at
work for less than 4 h/day”, versus high), length of school
attendance (< 8, 8-10 and > 10 years), physical activity
during leis ure time (sports: yes/no and h/week for active
people (linear)), body mass index (kg/m
2
; linear), dietary
intake of fruit (linear), vegetables (linear), red meat (lin-
ear), fiber (linear), selenium (sum of diet and supplements;
linear), calcium (sum of diet and supplements; linear),
alcohol intake (yes/no and g/day (linear)), use of hormone
replacement therapy (never/ever and duration for ever
users (linear)), use of oral contraceptives (never/ever and
duration for ever users (linear)), nu mber of childbirths
(none/any and number (linear)), age at first childbirth
(none/any and age (lin ear)), lactation (none/any and time
(linear)), previous benign breast tumor (yes/no), previous
diagnosis of hypertension (yes/no), skin reaction to sun
(severe or moderate burning, light to no burn), ta nning
during summer (very or moderately dark, faint or not
tanned), nevi (no or few, moderate or many) and freckles
(none or few, some or many). Moreover, we defined
dichotomous indicators of exposure to occupational carci-
nogens specific to each cancer site from questionnaire
responses about jobs held for a minimum of 1 year and
from evaluations in the International Agency for Research
on Cancer series (see Addi-
tional file 1).
Raaschou-Nielsen et al. Environmental Health 2011, 10:67
/>Page 3 of 11
We tested the linearity of the adjusted associations
between NO
x
concentration and risk for each of the 20
cancers by the likelihood ratio test, i.e. testing whether
adding non-linear terms improved the fit over the linear
model; p < 0.05 was used as criterion for n on-linearity.
The exposure-response function for 19 sites did not devi-
ate significantly from linearity, while a deviation of border-
line significance was found for pancreas cancer. Thus, for
all 20 cancers we estimated the IRRs as linear functions
per 100-μg/m
3
increment in NO
x
and per 10
4
vehicle km/
day traffic load within 200 m of the residence. Non-linear
exposure-response curves with 95% confidence limits are
presented graphically for selected cancers. These functions
were estimated with the cph function, survival library, R
statistical software 2.9.0 using restricted cubic spline in the
coxph function. The plots were produced with the plot
function in the design library and reflect exposure-
response functions after adjustment for cancer-specific
sets of potential confounders.
Results
Of the 57,053 cohort members, 571 were excluded
because of a cancer diagnosis before enrolment, 2 because
of uncertain date of cancer diagnosis, 960 for which an
address history was not available in the Central Population
Registry or their baseline address could not be geocoded,
and 1,216 because exposure was assessed for less than
80% of the time between 1 January 1971 and diagnosis or
censoring. Table 1 shows the baseline characteristics of
the 54,304 cohort members who were included, who were
followed up for an average of 9.6 years. The participants
were on average 56.7 years old at enrolment, and there
were slightly more women than men. About one third had
never smoked; the median duration of smoking among
ever smokers was 33 years. The median time-weighted
average NO
x
concentration at the residences between
1971 and the censoring date was 21.9 μg/m
3
(minimum,
13.8 μg/m
3
; maximum, 347 μg/m
3
). At enrolment, 8.3% of
the cohort members lived at a residence within 50 m of a
street with a traffic density > 10,000 vehicles per day.
Table 2 shows the IRRs of 20 cancers in association with
concentrations of NO
x
at the residence. Table 3 shows
IRRs in association with amount of traffic at the residence.
In the adjusted analyses, three sites showed significant
associations: primary liver cancer in association with traffic
within 200 m of the residence, cervical cancer in associa-
tion with NO
x
at the residence, a major street within 50 m
of the residence and traffic within 200 m of the residence,
and brain cancer in association with NO
x
at the residence
and a major street within 50 m of the residence.
Adjustment for pote ntial confounders decreased the
IRRs for many cancers, including some sm oking-related
cancers, such as esophagus and bladder cancer, and
breast cancer, whereas the IRR for e.g. cervical cancer
was less strongly affected by adjustment.
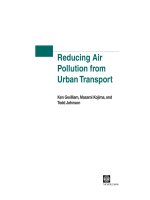
Figure 1 shows adjusted exposure-response functions
between NO
x
concentration at the residence and risks for
each of the three cancers for which significant IRRs are
shown in Tables 2, 3. The risk for cervical cancer
increased steadily with increasing exposure, the risk for
brain cancer incre ased mostly at con centrations in the
lower end of the exposure range, and the risk for liver can-
cer increased mostly in the upper end of the exposure
range.
Discussion
We found significant associations and exposure-
response patterns between traffic-rel ated air pollution at
the residence and risks for cervical and brain cancer.
The strengths of this study include a 10-year prospective
follow-up of a relatively large cohort and adjustment for
potential confounders. Individual assessment of the expo-
sure of all cohort members allowed us to link air pollution
to all major types of cancer. Virtually complete follow-up
for incident cancers was possible through nationwide
population-based registries, and complete follow-up for
vital status was available from the Central Population
Registry. Another strength of the study is the availability
of residential address histories dating back to 1971, so that
exposure could be assessed over several decades. A limita-
tion of this study is the relatively few cases of some types
of cancer, although more than 100 cases were identified
for 11 of the 20 cancers included. The inclusion of cancers
at 20 different sites means that the results should be inter-
preted with caution. The positive findings for cancers at
sites for which there is no or little previous epidemiologi-
cal evidence of an association with air pollution should be
considered as the basis for hypothesis-generating.
Exposure assessment is a major challenge in studies of
the health effects of lo ng-term exposure to air pollution.
We used three markers of air pollution from traffic at resi-
dences, which were moderately correlated (r, 0.43-0.53).
The outdoor NO
x
level at all addresses was calculated
over decades from a validated model that requires com-
prehensive input data; the two other markers are simple,
intuitively understandable measures of tr affic at the resi-
dence at the time of enrolment. The dispersion models we
used to assess NO
x
levels at the addresses of study partici-
pants have been successfully validated [34-36] and applied
[12,13,38]. Although markers of air pollution concentra-
tions are inevitably somewhat uncertain, the resulting
non-differential miscla ssification would create artif icial
associations only in rare situations [39]. If the geocoding,
and therefore also the exposure assessment, failed at an
address, we imputed the air pollution concentration from
the previous or next address. Since the imputation strategy
Raaschou-Nielsen et al. Environmental Health 2011, 10:67
/>Page 4 of 11
was identical for all cohort members and the ability of
geocoding an address is unlikely to be associated with
later development of cancer, we would expect the resulting
misclassification of exposure to be non-differential. We
minimized the degree of misclassification by including
only cohort members for whom air pollution was success-
fully assessed for at least 80% of the time from 1971 until
diagnosis/censoring/end-of-follow up.
Table 1 Characteristics of 54,304 study participants at baseline and NO
x
concentrations and traffic at their residences
Characteristic No. (%) Mean/median (5th-95th percentile)
Age at enrolment (years) 56.7/56.2 (50.7-64.2)
Gender
Male 25869 (47.6%)
Female 28435 (52.4%)
Length of education (years)
< 8 17996 (33.1%)
8-10 24994 (46.0%)
> 10 11255 (20.7%)
Sport activity in leisure time
No 25149 (46.3%)
Yes 29123 (53.6%)
Hours/week among active 2.4/2.0 (0.5-7.0)
Body mass index 26.1/25.5 (20.4-33.4)
Fruit intake (g/day) 176.6/140.3 (19.0-467.4)
Vegetable intake (g/day) 173.2/157.8 (47.8-352.7)
Alcohol intake
Abstainers 1256 (2.3%)
Drink alcohol 53048 (97.7%)
Amount of alcohol (g/day)
a
20.0/13.3 (1.1-65.0)
Hormone replacement therapy
b
Never 11835 (41.6%)
Ever 16328 (57.4%)
Duration of use (years)
c
7.9/6.0 (2.0-20.0)
Smoking
Never 19081 (35.1%)
Former 15600 (28.7%)
Current 19557 (36.0%)
Intensity (g/day)
d
16.3/14.8 (3.8-34.4)
Duration (years)
d
29.5/33.0 (6.0-46.0)
Environmental tobacco smoke
No/low 19268 (35.5%)
High 34768 (64.0%)
NO
x
at front door
e
(μg/m
3
) 28.4/21.9 (14.8-69.4)
Major road
f
within 50 m
No 49813 (91.7%)
Yes 4491 (8.3%)
Traffic load within 200 m
(10
3
vehicle km/day)
4.7/2.6 (0.28-15.5)
a
Among those drinking alcohol
b
For 28,163 women for whom there was information on both present and past use
c
Among ever users
d
Smoking intensity and duration among ever smokers
e
Time-weighted average for the period 1 January 1971 to the censoring date
f
More than 10,000 vehicles per day
Raaschou-Nielsen et al. Environmental Health 2011, 10:67
/>Page 5 of 11
This study shows an exposure-response association
between concentration of NO
x
at residence and risk for
cervical cancer, and associations were also seen for indi-
cators of traffic at the residence. Occupational exposure
to diesel engine exhaust was previously associat ed with
risk for cervical cancer in a study with no adjustment for
tobacco smoking [17], but to our knowledge no study has
been conducted of the exposure of the general popula-
tion to ambient air pollution. We adjusted our analyses
for smoking, education, and oral contraceptive use but
Table 2 Incidence rate ratios for cancer in association with NO
x
at the residence from 1971 onwards
Cancer site (ICD-7) IR
a
N
b
N
cases
c
Incidence rate ratio
(95% CI),
per 100 μg/m
3
NO
x
Adjustment variables
d
Crude Adjusted
Buccal cavity and
pharynx (140-148)
0.19 53177 94 1.94
(1.01;3.76)
1.63
(0.79;3.37)
Smoking
e
, education, fruit, alcohol, occupation
Esophagus (150) 0.15 53177 77 1.62
(0.72;3.62)
1.21
(0.49;2.98)
Smoking, education, fruit, alcohol, occupation
Stomach (151) 0.15 53177 80 0.80
(0.27;2.35)
0.65
(0.21;2.02)
Smoking, education, fruit, vegetables, occupation
Colon (153) 0.81 52609 414 1.11
(0.74;1.67)
0.93
(0.60;1.46)
Smoking, physical activity, red meat, fiber, alcohol, BMI, HRT, occupation
Rectum (154) 0.47 52609 246 0.83
(0.46;1.50)
0.80
(0.43;1.48)
Smoking, physical activity, red meat, fiber, alcohol, BMI, HRT, occupation
Liver (155.0) 0.10 54160 57 2.14
(0.96;4.75)
1.66
(0.70;3.94)
Smoking status, alcohol, education, occupation
Pancreas (157) 0.21 54171 112 0.70
(0.27;1.83)
0.64
(0.24;1.71)
Smoking status, BMI, education, occupation
Larynx (161) 0.11 53177 64 1.22
(0.45;3.31)
0.80
(0.26;2.46)
Smoking, education, fruit, alcohol, occupation
Breast (170) 3.57 27735 987 1.39
(1.09;1.77)
1.16
(0.89;1.51)
BMI, education, alcohol, childbirths (number and age at first), lactation, HRT,
benign breast disease, physical activity, occupation
Cervix (171) 0.13 27678 35 2.78
(1.18;6.58)
2.45
(1.01;5.93)
Smoking, education, oral contraceptives
Uteri (172) 0.62 27836 171 1.30
(0.71;2.35)
1.15
(0.60;2.21)
HRT, oral contraceptives, BMI, physical activity, number of childbirths, smoking
status
Ovary (175) 0.40 28157 111 0.88
(0.36;2.13)
0.81
(0.33;1.99)
Number of childbirths, oral contraceptives, HRT, lactation, occupation
Prostate (177) 2.61 25803 673 0.97
(0.68;1.38)
0.96
(0.67;1.37)
Education, selenium intake, calcium intake, occupation
Kidney (180) 0.20 46259 95 2.14
(1.21;3.79)
1.73
(0.89;3.73)
BMI, smoking, hypertension, education, occupation
Bladder (181) 0.42 53234 221 1.54
(0.96;2.46)
1.32
(0.80;2.19)
Smoking, education, occupation
Melanoma (190) 0.42 53964 226 0.50
(0.23;1.07)
0.52
(0.24;1.11)
Education, skin reaction, tanning, nevi, freckles
Brain (193) 0.17 54304 95 2.28
(1.24;4.17)
2.28
(1.25;4.19)
Occupation
Non-Hodgkin
lymphoma (200, 202)
0.36 54245 197 1.11
(0.61;2.03)
1.11
(0.61;2.03)
Education, occupation
Myeloma (203) 0.12 54262 68 0.31
(0.06;1.56)
0.31
(0.06;1.56)
BMI
Leukemia (204) 0.21 54238 117 0.44
(0.15;1.33)
0.47
(0.16;1.39)
Smoking status, occupation
BMI, body mass index; HRT, hormone replacement therapy
a
Crude incidence rate per 1,000 person-years for the full cohort, i.e. before exclusions because of failed exposure assessment or missing information on potential
confounders
b
Number of cohort members contributing to the analyses, i.e. without missing information about exposure or any of the potential confounders
c
Number of cases contributing to the analyses, i.e. without missing information about exposure or any of the potential confounders
d
See Methods section for further specification
e
Adjustment for smoking status, intensity and duration (if not otherwise speci fied)
Raaschou-Nielsen et al. Environmental Health 2011, 10:67
/>Page 6 of 11
had no information on human papillomavirus (HPV)
infection, which is a major cause of cervical cancer [40].
It is possible that HPV infection is more prevalent among
women living in areas with heavy traffic and air pollution.
Early findings of associations between smoking and cervi-
cal cancer were similarly suspected of confounding by
HPV infection, although today smoking is an established
risk factor for this cancer. Further, we cannot exclude the
possibility that compliance with the nation-wide cervical
cancer screening program differs in areas with high and
low levels of air pollution due to differences in educa-
tional level. However, the educational level differed only
little between cohort members living at addresses w ith
high and low air pollution levels [13] and the results in
the present study was adjusted for educational level mini-
mizing the potential for confounding. The hypothesis of
an association between air pollution and risk for cervical
cancer should be further investigated in a study with con-
trol for HPV infection ( in addition to other risk factors),
preferably with more power than the current study.
We found an exposure-response association between
NO
x
at the residence and risk for brain cancer, which was
almost doubled for people living close to a street with high
traffic density. In general, the causes of brain cancer
remain unknown, although high-dose ionizing radiation
and certain genetic syndromes are established risk factors
[41]. These, however, seem unlikely to be associated with
air pollution at the residential address. A previous study in
Denmark indicated a higher risk for brain cancer in asso-
ciation with agricul tural class and higher inco me [42].
These factors are probably inversely associated with air
pollutionfromtrafficinDenmark,and,iftheywererisk
factors for brain tumors, we would expect any confound-
ing to have decreased the IRR for brain cancer in associa-
tion with air pollution. There is growing experimental
evidence that ultrafine particles can reach the brai n both
via the systemic circulati on through the blood-brain bar-
rier and via the olfactory neuronal pathway [3,5], causing
an inflammatory response [43,44]. Further, a recent study
showed that exposure to diesel engine exhaust causes
functional changes in the human brain indicating cortical
stress response [45]. Boeglin et al. [27] showed an ecologi-
cal association between emissions of volatile organic com-
pounds and brain cancer incidence rates at county level in
Table 3 Incidence rate ratios for cancer in association with markers of traffic at residence at the time of enrolment
into the cohort between 1993 and 1997
Cancer site (ICD-7) Incidence rate ratio
a
(95% CI)
Major street within 50 m
(yes versus no)
Per 10
4
vehicle km/day
within 200 m
Crude Adjusted
b
Crude Adjusted
b
Buccal cavity and pharynx (140-148) 0.92 (0.45;1.90) 0.85 (0.41;1.77) 0.98 (0.68;1.41) 0.87 (0.59;1.29)
Esophagus (150) 1.59 (0.82;3.10) 1.38 (0.71;2.68) 1.20 (0.84;1.72) 1.07 (0.73;1.58)
Stomach (151) 1.01 (0.46;2.19) 0.92 (0.42;1.98) 1.08 (0.74;1.58) 1.00 (0.70;1.48)
Colon (153) 1.13 (0.82;1.55) 0.89 (0.41;1.95) 1.04 (0.88;1.23) 0.99 (0.66;1.47)
Rectum (154) 1.03 (0.67;1.58) 1.00 (0.64;1.56) 0.94 (0.75;1.18) 0.92 (0.72;1.16)
Liver (155.0) 1.58 (0.74;3.34) 1.40 (0.66;2.98) 1.55 (1.09;2.20) 1.45 (1.00;2.09)
Pancreas (157) 0.92 (0.47;1.82) 0.79 (0.38;1.63) 0.78 (0.53;1.14) 0.73 (0.49;1.09)
Larynx (161) 1.24 (0.56;2.72) 1.03 (0.47;2.27) 1.28 (0.88;1.87) 1.13 (0.75;1.70)
Breast (170) 1.11 (0.90;1.38) 0.98 (0.78;1.22) 1.08 (0.98;1.21) 0.98 (0.88;1.10)
Cervix (171) 4.67 (2.29;9.52) 4.36 (2.12;8.95) 1.88 (1.27;2.79) 1.70 (1.12;2.58)
Uteri (172) 1.15 (0.70;1.90) 0.96 (0.55;1.66) 1.19 (0.94;1.52) 1.15 (0.90;1.49)
Ovary (175) 0.50 (0.20;1.23) 0.49 (0.20;1.19) 0.88 (0.61;1.26) 0.80 (0.54;1.17)
Prostate (177) 0.88 (0.67;1.17) 0.91 (0.69;1.21) 0.91 (0.79;1.05) 0.96 (0.83;1.11)
Kidney (180) 1.29 (0.71;2.35) 0.90 (0.44;1.87) 1.10 (0.80;1.51) 1.10 (0.78;1.54)
Bladder (181) 1.06 (0.68;1.66) 0.94 (0.60;1.48) 1.20 (0.97;1.47) 1.09 (0.87;1.35)
Melanoma (190) 0.69 (0.40;1.19) 0.65 (0.37;1.14) 0.83 (0.64;1.08) 0.83 (0.64;1.09)
Brain (193) 1.89 (1.07;3.34) 1.89 (1.07;3.36) 1.27 (0.93;1.75) 1.27 (0.93;1.75)
Non-Hodgkin lymphoma (200, 202) 0.91 (0.54;1.51) 0.90 (0.54;1.51) 1.06 (0.83;1.35) 1.06 (0.83;1.35)
Myeloma (203) 1.06 (0.46;2.45) 1.06 (0.46;2.45) 0.78 (0.48;1.29) 0.78 (0.48;1.29)
Leukemia (204) 0.79 (0.39;1.62) 0.81 (0.39;1.66) 0.73 (0.50;1.09) 0.75 (0.51;1.11)
a
Based on same data as the analyses shown in Table 2
b
Adjustments identical to those in Table 2
Raaschou-Nielsen et al. Environmental Health 2011, 10:67
/>Page 7 of 11
the USA; but a large cohor t study with individual adjust-
ment for po tent ial confounders showed that people who
lived in metropolitan areas with higher air pollution levels
measured at routine monitoring network stations did not
have a higher r isk for death from brain cancer [46].
Although our study is smaller, it has several advantages,
including individual exposure assessment, thus accounting
for within-city variations in air pollution concentrations,
which might explain t he difference in re sults. Further-
more, we studied brain cancer incidence, whereas the US
study measured mortality. If survival after brain cancer dif-
fers in different metropolitan areas and survival correlates
with air pollution levels, the results of a mortality study
would differ from those of a study of incidence. We
recommend that studies be conducted to replicate our
finding of an increased incidence of brain cancer in asso-
ciation with individual-level exposure to air pollution.
We found a borderline significantly increased risk for
liver cancer associated with traffic within 200 m of the
residence, after adjustment for relevant confounders,
although there was n o significant association with NO
x
levels. There is consistent evidence that liver cancer is
associated with tobacco smoking [47]. One of the few
previous epidemiological studies on ambient air pollu-
tion and liver cancer was a retrospective cohort study,
which showed an increased risk in urban b us drivers
and tramway employees [16]. Mucociliary clearance of
particles deposited in the airways usually leads to gastro-
intestinal exposure due to swallowing, and, in exp eri-
mental studies, intragastric exposure of animals to diesel
exhaust particles induced oxidative stress and DNA
damage in the liver [48]. In addition, particles translo-
cated to the circulation accumulated in Kupfer cells in
the liver, with very slow elimination and further poten-
tial oxidative stress [49].
Our study also sh owed that the risk for kidney cancer
increased with NO
x
concentration at the residence. Sev-
eral studies of occupational groups, such as transport
workers, d rivers, policemen, metal foundry workers, and
gasoline service station wor kers exposed to gasoline
vapors, engine exhaust, PAHs, and other air pollutants,
have indicated weakly increased risks for kidney cancer
[15,16,26], although the literature is neither consistent
[23] nor conclusive [50]. The indication in the present
study of an association between ambient air pollution at
the residence and risk for kidney cancer in a general
population should be confirmed before conclusions can
be drawn.
Our study showed a weak, ins ignificant association
between traffic-related air pollution and risk for breast
Figure 1 Non-linear exposure-response functions (filled lines; 95% confidence limits indicated by dashed lines) between average NO
x
concentration (μg/m
3
) at residences from 1971 onwards and risks for primary liver cancer, cervical cancer and brain cancer. The
functions were adjusted for cancer-specific sets of potential confounders, listed in the last column of Table 2. The figure includes the exposure
range between the 5
th
and 95
th
percentiles (14.8-69.4 μg/m
3
NO
x
). The exposure distribution is marked on the x-axis.
Raaschou-Nielsen et al. Environmental Health 2011, 10:67
/>Page 8 of 11
cancer. A rec ent study in Montreal, Canada, s howed
that the risk for breast cancer was associated with NO
2
concentrations at the residence [28], and a study in New
York, USA, indicated an association between early-life
exposure to air pollution at the residence an d risk for
this cancer [51]. PAH-induced breast tumor mutations
might explain any link between air pollution and risk
for breast cancer [52].
Previous studies have shown associations between
risks for upper aerodigestive tract cancers and indoor
fuel combustion [14] and occupational exposure to
engine exhaust [15-18], and our study also indicated a
possible association between ambient traffic-related air
pollution and cancers of the buccal cavity and pharynx,
although the result was insignificant.
Our results showed a weak, insignificant association
between traffic-related air pollution and bladder cancer.
The evidence of an association between ambient air pol-
lution and bladder cancer in the general population is
not conclusive [19,20,30].
Benzene at relatively high occupational concentrations is
a known leukemogen, and a few studies have suggested
that ambient concentrations near poin t sources [29] a nd
near traffic [30] might be associated with risks for hemato-
logical cancers, whereas other studies found no such asso-
ciation [53,54]. The exposure of the general population to
benzene is much lower than the lowest effect level seen in
studies of occupa tional exposure, so that any relate d risk
for leukemia in the general population would probably not
be detecta ble with current methods [55]. Our results are
in accordance with this notion.
Although we found associations between NO
x
concen-
tration and the risks for some cancers, NO
x
is an indicator
of vehicle engine exhaust, which is a complex mixture of
many carcinogenic and mutagenic chemicals [1]. The NO
x
concentration correlates closely with that of particulate
matter, especially the ultrafine fraction emitted from diesel
engines in Danish streets [37]. Although it is difficult to
disentangle the effects of single air pollutants in epidemio-
logical designs, particulate matter from traffic emissions
appears to be the most important determinant of cancer
risk. Ultrafine particles have a large surface area and con-
tain absorbed PAHs, transition metals and other sub-
stances, which cause oxidative stress, inflammation and
direct and indirect genotoxicity [56,57]. Further, there is
evidence that ultrafine particles can translocate from the
airways to other organs [7], which might explain our find-
ing of higher risks fo r cervical and brain cancer in cohort
members living at residences with high levels of traffic-
related air pollution.
Conclusions
In conclusion, this cohort study shows significant asso-
ciations between traffic-related air pollution at
residential addresses over several decades and risks for
cervical and brai n cancer. Although experimental evi-
dence shows that ultrafine particles can translocate from
the airways to other organs, our r esults are based on
hypothesis-generating screening of 20 cancers and
future epidemiological studies are needed to provide
further information on possible risks for cancer asso-
ciated with traffi c-rel ated air pollution. In particular the
hypotheses of associations with brain and cervical can-
cer require further testing.
Additional material
Additional file 1: Occupations and jobs associated with risks for
each cancer.
List of abbreviations
IRR: incidence rate ratio; CI: confidence interval; PAH: polycyclic aromatic
hydrocarbon; GIS: geographical information system.
Acknowledgements
The project was supported by the Danish Agency for Science, Technology
and Innovation, as part of the Danish Centre of Excellence on Air Pollution
and Health, AIRPOLIFE (grant 2052-03-0016), and by the Danish Cancer
Society. These funding agencies had no role in the design, data collection,
analyses and interpretation of data, writing the manuscript, decision to
submit the manuscript or any other aspect of the scientific work.
Author details
1
Institute of Cancer Epidemiology, Danish Cancer Society, Strandboulevarden
49, 2100 Copenhagen, Denmark.
2
Department for Atmospheric Environment,
National Environmental Research Institute, Aarhus University, Denmark.
3
Section of Environmental Health, Department of Public Health, University of
Copenhagen, Denmark.
4
Department of Epidemiology, Institute of Public
Health, Aarhus University, Denmark.
Authors’ contributions
ORN conceived and designed the study, participated in acquisition of
environmental data and exposure assessment, participated in planning of
data analyses and drafted the manuscript. ZA participated in planning of the
statistical analyses and performed record linkages, data processing and
statistical analyses. MH, SSJ and MK developed the air pollution modeling
system and conducted the air pollution calculations. JH defined the
occupations associated with risk for each cancer. SL contributed to the
manuscript. AT and KO established the Diet Cancer and Health cohort and
provided cohort data. All authors participated in interpretation of data,
commented on the manuscript and approved the final manuscript.
Competing interests
The authors declare that they have no competing interests.
Received: 14 April 2011 Accepted: 19 July 2011 Published: 19 July 2011
References
1. International Agency for Research on Cancer: Diesel and gasoline engine
exhausts and some nitroarenes. IARC Monographs on the Evaluation of
the Carcinogenicity of Chemicals to Humans. Lyon: IARC Press; 198946.
2. Nielsen T, Feilberg A, Binderup ML: The variation of street air levels of
PAH and other mutagenic PAC in relation to regulations of traffic
emissions and the impact of atmospheric processes. Environ Sci Pollut Res
Int 1999, 6:133-137.
3. Oberdorster G, Utell MJ: Ultrafine particles in the urban air: to the
respiratory tract–and beyond? Environ Health Perspect 2002, 110:
A440-A441.
Raaschou-Nielsen et al. Environmental Health 2011, 10:67
/>Page 9 of 11
4. Schmid O, Moller W, Semmler-Behnke M, Ferron GA, Karg E, Lipka J,
Schulz H, Kreyling WG, Stoeger T: Dosimetry and toxicology of inhaled
ultrafine particles. Biomarkers 2009, 14(Suppl 1):67-73.
5. Oberdorster G, Sharp Z, Atudorei V, Elder A, Gelein R, Kreyling W, Cox C:
Translocation of inhaled ultrafine particles to the brain. Inhal Toxicol
2004, 16:437-445.
6. Elder A, Gelein R, Silva V, Feikert T, Opanashuk L, Carter J, Potter R,
Maynard A, Ito Y, Finkelstein J, Oberdorster G: Translocation of inhaled
ultrafine manganese oxide particles to the central nervous system.
Environ Health Perspect 2006, 114:1172-1178.
7. Kreyling WG, Semmler-Behnke M, Seitz J, Scymczak W, Wenk A, Mayer P,
Takenaka S, Oberdorster G: Size dependence of the translocation of
inhaled iridium and carbon nanoparticle aggregates from the lung of
rats to the blood and secondary target organs. Inhal Toxicol 2009,
21(Suppl 1):55-60.
8. Peters A, Veronesi B, Calderon-Garciduenas L, Gehr P, Chen LC, Geiser M,
Reed W, Rothen-Rutishauser B, Schurch S, Schulz H: Translocation and
potential neurological effects of fine and ultrafine particles a critical
update. Part Fibre Toxicol 2006, 3:13.
9. Pope CA III, Burnett RT, Thun MJ, Calle EE, Krewski D, Ito K, Thurston GD:
Lung cancer, cardiopulmonary mortality, and long-term exposure to fine
particulate air pollution. JAMA 2002, 287:1132-1141.
10. Nyberg F, Gustavsson P, Jarup L, Bellander T, Berglind N, Jakobsson R,
Pershagen G: Urban air pollution and lung cancer in Stockholm.
Epidemiology 2000, 11:487-495.
11. Vineis P, Hoek G, Krzyzanowski M, Vigna-Taglianti F, Veglia F, Airoldi L,
Autrup H, Dunning A, Garte S, Hainaut P, Malaveille C, Matullo G,
Overvad K, Raaschou-Nielsen O, Clavel-Chapelon F, Linseisen J, Boeing H,
Trichopoulou A, Palli D, Peluso M, Krogh V, Tumino R, Panico S, Bueno-de-
Mesquita HB, Peeters PH, Lund EE, Gonzalez CA, Martinez C, Dorronsoro M,
Barricarte A, Cirera L, Quiros JR, Berglund G, Forsberg B, Day NE, Key TJ,
Saracci R, Kaaks R, Riboli E: Air pollution and risk of lung cancer in a
prospective study in Europe. Int J Cancer 2006, 119:169-174.
12. Raaschou-Nielsen O, Bak H, Sorensen M, Jensen SS, Ketzel M, Hvidberg M,
Schnohr P, Tjonneland A, Overvad K, Loft S: Air pollution from traffic and
risk for lung cancer in three Danish cohorts. Cancer Epidemiol Biomarkers
Prev 2010, 19:1284-1291.
13. Raaschou-Nielsen O, Andersen ZJ, Hvidberg M, Jensen SS, Ketzel M,
Sørensen M, Loft S, Overvad K, Tjonneland A: Lung cancer incidence and
long-term exposure to air pollution from traffic. Environ Health Perspect
2011, 119:860-865.
14. Sapkota A, Gajalakshmi V, Jetly DH, Roychowdhury S, Dikshit RP, Brennan P,
Hashibe M, Boffetta P: Indoor air pollution from solid fuels and risk of
hypopharyngeal/laryngeal and lung cancers: a multicentric case-control
study from India. Int J Epidemiol 2008, 37:321-328.
15. Lynge E, Andersen A, Nilsson R, Barlow L, Pukkala E, Nordlinder R,
Boffetta P, Grandjean P, Heikkila P, Horte LG, Jakobsson R, Lundberg I,
Moen B, Partanen T, Riise T: Risk of cancer and exposure to gasoline
vapors. Am J Epidemiol 1997, 145:449-458.
16. Soll-Johanning H, Bach E, Olsen JH, Tuchsen F: Cancer incidence in urban
bus drivers and tramway employees: a retrospective cohort study. Occup
Environ Med 1998,
55:594-598.
17. Boffetta P, Dosemeci M, Gridley G, Bath H, Moradi T, Silverman D:
Occupational exposure to diesel engine emissions and risk of cancer in
Swedish men and women. Cancer Causes Control 2001, 12:365-374.
18. Tarvainen L, Kyyronen P, Kauppinen T, Pukkala E: Cancer of the mouth and
pharynx, occupation and exposure to chemical agents in Finland [in
1971-95]. Int J Cancer 2008, 123:653-659.
19. Liu CC, Tsai SS, Chiu HF, Wu TN, Chen CC, Yang CY: Ambient exposure to
criteria air pollutants and risk of death from bladder cancer in Taiwan.
Inhal Toxicol 2009, 21:48-54.
20. Castano-Vinyals G, Cantor KP, Malats N, Tardon A, Garcia-Closas R, Serra C,
Carrato A, Rothman N, Vermeulen R, Silverman D, Dosemeci M,
Kogevinas M: Air pollution and risk of urinary bladder cancer in a case-
control study in Spain. Occup Environ Med 2008, 65:56-60.
21. Silverman DT, Hoover RN, Mason TJ, Swanson GM: Motor exhaust-related
occupations and bladder cancer. Cancer Res 1986, 46:2113-2116.
22. Kogevinas M, ’t Mannetje A, Cordier S, Ranft U, Gonzalez CA, Vineis P,
Chang-Claude J, Lynge E, Wahrendorf J, Tzonou A, Jockel KH, Serra C,
Porru S, Hours M, Greiser E, Boffetta P: Occupation and bladder cancer
among men in Western Europe. Cancer Causes Control 2003, 14:907-914.
23. Guo J, Kauppinen T, Kyyronen P, Heikkila P, Lindbohm ML, Pukkala E: Risk
of esophageal, ovarian, testicular, kidney and bladder cancers and
leukemia among Finnish workers exposed to diesel or gasoline engine
exhaust. Int J Cancer 2004, 111:286-292.
24. Bosetti C, Boffetta P, La Vecchia C: Occupational exposures to polycyclic
aromatic hydrocarbons, and respiratory and urinary tract cancers: a
quantitative review to 2005. Ann Oncol 2007, 18:431-446.
25. Sjodahl K, Jansson C, Bergdahl IA, Adami J, Boffetta P, Lagergren J:
Airborne exposures and risk of gastric cancer: a prospective cohort
study. Int J Cancer 2007, 120:2013-2018.
26. Ji J, Granstrom C, Hemminki K: Occupational risk factors for kidney
cancer: a cohort study in Sweden. World J Urol 2005, 23:271-278.
27. Boeglin ML, Wessels D, Henshel D: An investigation of the relationship
between air emissions of volatile organic compounds and the incidence
of cancer in Indiana counties. Environ Res 2006, 100:242-254.
28. Crouse DL, Goldberg MS, Ross NA, Chen H, Labreche F: Postmenopausal
breast cancer is associated with exposure to traffic-related air pollution
in Montreal, Canada: A case-control study. Environ Health Perspect 2010,
118:1578-1583.
29. Barregard L, Holmberg E, Sallsten G: Leukaemia incidence in people living
close to an oil refinery. Environ Res 2009, 109:985-990.
30. Visser O, van Wijnen JH, van Leeuwen FE: Residential traffic density and
cancer incidence in Amsterdam, 1989-1997. Cancer Causes Control 2004,
15:331-339.
31. Tjonneland A, Olsen A, Boll K, Stripp C, Christensen J, Engholm G,
Overvad K: Study design, exposure variables, and socioeconomic
determinants of participation in Diet, Cancer and Health: a population-
based prospective cohort study of 57,053 men and women in Denmark.
Scand J Public Health 2007, 35:432-441.
32. Storm HH, Michelsen EV, Clemmensen IH, Pihl J: The Danish Cancer
Registry–history, content, quality and use. Dan Med Bull 1997, 44:535-539.
33. Jensen SS, Berkowicz R, Hansen SH, Hertel O: A Danish decision-support
GIS tool for management of urban air quality and human exposures.
Transport Res Part D: Transport Environ 2001, 6:229-241.
34. Raaschou-Nielsen O, Hertel O, Vignati E, Berkowicz R, Jensen SS, Larsen VB,
Lohse C, Olsen JH: An air pollution model for use in epidemiological
studies: evaluation with measured levels of nitrogen dioxide and
benzene. J Expo Anal Environ Epidemiol 2000, 10:4-14.
35. Berkowicz R, Ketzel M, Jensen SS, Hvidberg M, Raaschou-Nielsen O:
Evaluation and application of OSMP for traffic pollution assessment for
large number of street locations. Environ Model Software 2008, 23:296-303.
36. Ketzel M, Berkowicz R, Hvidberg M, Jensen SS, Raaschou-Nielsen O:
Evaluation of AIRGIS – a GIS-based air pollution and human exposure
modelling system. Int J Environ Pollut .
37. Ketzel M, Wahlin P, Berkowicz R, Palmgren F: Particle and trace gas
emission factors under urban driving conditions in Copenhagen based
on street and roof level observations. Atmos Environ 2003, 37:2735-2749.
38. Andersen ZJ, Hvidberg M, Jensen SS, Ketzel M, Loft S, Sorensen M,
Tjonneland A, Overvad K, Raaschou-Nielsen O: Chronic Obstructive
Pulmonary Disease and Long-Term Exposure to Traffic-Related Air
Pollution: A Cohort Study. Am J Respir Crit Care Med 2011, 183:455-461.
39. Dosemeci M, Wacholder S, Lubin JH: Does nondifferential misclassification
of exposure always bias a true effect toward the null value? Am J
Epidemiol 1990, 132:746-748.
40. Schiffman MH, Hildesheim A: Cervical cancer. In Cancer Epidemiology and
Prevention. Edited by: Schottenfeld D, Fraumeni JF, Jr. Oxford: Oxford
University Press; 2006:1044-1067.
41. Bondy ML, Scheurer ME, Malmer B, Barnholtz-Sloan JS, Davis FG, Il’yasova D,
Kruchko C, McCarthy BJ, Rajaraman P, Schwartzbaum JA, Sadetzki S,
Schlehofer B, Tihan T, Wiemels JL, Wrensch M, Buffler PA: Brain tumor
epidemiology: consensus from the Brain Tumor Epidemiology
Consortium. Cancer 2008, 113:1953-1968.
42. Schmidt LS, Nielsen H, Schmiedel S, Johansen C: Social inequality and
incidence of and survival from tumours of the central nervous system in
a population-based study in Denmark, 1994-2003. Eur J Cancer 2008,
44:2050-2057.
43. Calderon-Garciduenas L, Franco-Lira M, Torres-Jardon R, Henriquez-
Roldan C, Barragan-Mejia G, Valencia-Salazar G, Gonzalez-Maciel A, Reynoso-
Robles R, Villarreal-Calderon R, Reed W: Pediatric respiratory and systemic
effects of chronic air pollution exposure: nose, lung, heart, and brain
pathology. Toxicol Pathol 2007, 35:154-162.
Raaschou-Nielsen et al. Environmental Health 2011, 10:67
/>Page 10 of 11
44. Gerlofs-Nijland ME, van Berlo D, Cassee FR, Schins RP, Wang K, Campbell A:
Effect of prolonged exposure to diesel engine exhaust on
proinflammatory markers in different regions of the rat brain. Part Fibre
Toxicol 2010, 7:12.
45. Cruts B, van EL, Tornqvist H, Blomberg A, Sandstrom T, Mills NL, Borm PJ:
Exposure to diesel exhaust induces changes in EEG in human
volunteers. Part Fibre Toxicol 2008, 5:4.
46. McKean-Cowdin R, Calle EE, Peters JM, Henley J, Hannan L, Thurston GD,
Thun MJ, Preston-Martin S: Ambient air pollution and brain cancer
mortality. Cancer Causes Control 2009, 20:1645-1651.
47. Lee YC, Cohet C, Yang YC, Stayner L, Hashibe M, Straif K: Meta-analysis of
epidemiologic studies on cigarette smoking and liver cancer. Int J
Epidemiol 2009, 38:1497-1511.
48. Danielsen PH, Risom L, Wallin H, Autrup H, Vogel U, Loft S, Moller P: DNA
damage in rats after a single oral exposure to diesel exhaust particles.
Mutat Res 2008, 637:49-55.
49. Sadauskas E, Danscher G, Stoltenberg M, Vogel U, Larsen A, Wallin H:
Protracted elimination of gold nanoparticles from mouse liver.
Nanomedicine 2009, 5:162-169.
50. Lipworth L, Tarone RE, McLaughlin JK: The epidemiology of renal cell
carcinoma. J Urol 2006, 176:2353-2358.
51. Bonner MR, Han D, Nie J, Rogerson P, Vena JE, Muti P, Trevisan M, Edge SB,
Freudenheim JL: Breast cancer risk and exposure in early life to
polycyclic aromatic hydrocarbons using total suspended particulates as
a proxy measure. Cancer Epidemiol Biomarkers Prev 2005, 14:53-60.
52. Mordukhovich I, Rossner P, Terry MB, Santella R, Zhang YJ, Hibshoosh H,
Memeo L, Mansukhani M, Long CM, Garbowski G, Agrawal M, Gaudet MM,
Steck SE, Sagiv SK, Eng SM, Teitelbaum SL, Neugut AI, Conway-Dorsey K,
Gammon MD: Associations between polycyclic aromatic hydrocarbon-
related exposures and p53 mutations in breast tumors. Environ Health
Perspect 2010, 118:511-518.
53. Michelozzi P, Fusco D, Forastiere F, Ancona C, Dell’Orco V, Perucci CA:
Small area study of mortality among people living near multiple sources
of air pollution. Occup Environ Med 1998, 55:611-615.
54. Visser O, van Wijnen JH, van Leeuwen FE: Incidence of cancer in the area
around Amsterdam Airport Schiphol in 1988-2003: a population-based
ecological study. BMC Public Health 2005, 5:127.
55. Duarte-Davidson R, Courage C, Rushton L, Levy L: Benzene in the
environment: an assessment of the potential risks to the health of the
population. Occup Environ Med 2001, 58:2-13.
56. Borm PJ, Schins RP, Albrecht C: Inhaled particles and lung cancer, part B:
paradigms and risk assessment. Int J Cancer 2004, 110:3-14.
57. Moller P, Jacobsen NR, Folkmann JK, Danielsen PH, Mikkelsen L,
Hemmingsen JG, Vesterdal LK, Forchhammer L, Wallin H, Loft S: Role of
oxidative damage in toxicity of particulates. Free Radic Res
2010, 44:1-46.
doi:10.1186/1476-069X-10-67
Cite this article as: Raaschou-Nielsen et al.: Air pollution from traffic and
cancer incidence: a Danish cohort study. Environmental Health 2011
10:67.
Submit your next manuscript to BioMed Central
and take full advantage of:
• Convenient online submission
• Thorough peer review
• No space constraints or color figure charges
• Immediate publication on acceptance
• Inclusion in PubMed, CAS, Scopus and Google Scholar
• Research which is freely available for redistribution
Submit your manuscript at
www.biomedcentral.com/submit
Raaschou-Nielsen et al. Environmental Health 2011, 10:67
/>Page 11 of 11