Traffic-related air pollution associated with prevalence of asthma and COPD/chronic bronchitis. A cross-sectional study in Southern Sweden pdf
Bạn đang xem bản rút gọn của tài liệu. Xem và tải ngay bản đầy đủ của tài liệu tại đây (4.54 MB, 15 trang )
International Journal of Health
Geographics
BioMed Central
Open Access
Research
Traffic-related air pollution associated with prevalence of asthma
and COPD/chronic bronchitis. A cross-sectional study in Southern
Sweden
Anna Lindgren*1, Emilie Stroh1, Peter Montnémery2, Ulf Nihlén3,4,
Kristina Jakobsson1 and Anna Axmon1
Address: 1Department of Occupational and Environmental Medicine, Lund University, Lund, Sweden, 2Department of Community Medicine,
Lund University, Lund, Sweden, 3Astra Zeneca R&D, Lund, Sweden and 4Department of Respiratory Medicine and Allergology, Lund University,
Lund, Sweden
Email: Anna Lindgren* - ; Emilie Stroh - ; Peter Montnémery - ;
Ulf Nihlén - ; Kristina Jakobsson - ; Anna Axmon -
* Corresponding author
Published: 20 January 2009
International Journal of Health Geographics 2009, 8:2
doi:10.1186/1476-072X-8-2
Received: 2 October 2008
Accepted: 20 January 2009
This article is available from: />© 2009 Lindgren et al; licensee BioMed Central Ltd.
This is an Open Access article distributed under the terms of the Creative Commons Attribution License ( />which permits unrestricted use, distribution, and reproduction in any medium, provided the original work is properly cited.
Abstract
Background: There is growing evidence that air pollution from traffic has adverse long-term
effects on chronic respiratory disease in children, but there are few studies and more inconclusive
results in adults. We examined associations between residential traffic and asthma and COPD in
adults in southern Sweden. A postal questionnaire in 2000 (n = 9319, 18–77 years) provided disease
status, and self-reported exposure to traffic. A Geographical Information System (GIS) was used to
link geocoded residential addresses to a Swedish road database and an emission database for NOx.
Results: Living within 100 m of a road with >10 cars/minute (compared with having no heavy road
within this distance) was associated with prevalence of asthma diagnosis (OR = 1.40, 95% CI =
1.04–1.89), and COPD diagnosis (OR = 1.64, 95%CI = 1.11–2.4), as well as asthma and chronic
bronchitis symptoms. Self-reported traffic exposure was associated with asthma diagnosis and
COPD diagnosis, and with asthma symptoms. Annual average NOx was associated with COPD
diagnosis and symptoms of asthma and chronic bronchitis.
Conclusion: Living close to traffic was associated with prevalence of asthma diagnosis, COPD
diagnosis, and symptoms of asthma and bronchitis. This indicates that traffic-related air pollution
has both long-term and short-term effects on chronic respiratory disease in adults, even in a region
with overall low levels of air pollution.
Background
Traffic-related air pollution is well known to have shortterm effects on chronic respiratory disease, exacerbating
symptoms and increasing hospital admissions for respiratory causes [1]. Strong effects on symptoms have also been
observed in areas with relatively low background pollu-
tion [2]. Long-term effects have been disputed, but there
is growing evidence that traffic-related air pollution is
related, at least among children, to asthma incidence [37], decreased lung function development [8,9], and incidence of bronchitic symptoms [4,10].
Page 1 of 15
(page number not for citation purposes)
International Journal of Health Geographics 2009, 8:2
In adults, studies of long-term effects from traffic-related
air pollution have been few, and recent studies have
found both positive [11-15] and negative [16-18] associations with asthma, as well as positive [16,19,20] and negative [13,14] associations with COPD. Overall, chronic
respiratory disease in adults is heterogenous and involves
major exposures, such as personal smoking and occupational exposure, which do not directly affect children. This
larger variety of risk factors may complicate research and
contribute to inconclusive results in adults.
Self-reported living close to traffic has been associated
with prevalence of asthma, but not COPD, among adults
in southern Sweden [14]. However, self-reports could be
severely biased if people are more aware of (and hence
over-report) exposures that are known to be potentially
connected to disease, and may not be trustworthy if used
as the only exposure estimate [21].
One way of obtaining objective exposure estimates is the
use of Geographical Information Systems (GIS) to combine geocoded population data with external traffic exposure data, such as road networks and modeled or
monitored traffic pollutants. Since the concentrations of
many traffic pollutants decline to background levels
within 30–200 m of a road, the level of spatial aggregation
may be just as important as the type of proxy when estimating exposure [22,23]. Some studies have found that
adverse effects on respiratory disease are best captured
with simple variables of traffic density and proximity to
roads [24], rather than more complex models of specific
pollutants, which are difficult to model with a high resolution. However, air pollutant models do have a number
of advantages; for example, they can account for total traffic density, and can also be validated against real measurements, providing more specific estimates of the level of
pollution at which adverse effects from traffic can be seen.
In the present study, we made use of a high quality GISmodeled pollutant database for nitrogen oxides (NOx and
NO2) which has been developed and validated for southern Sweden [25]. The high spatial variability of NOx
(NO+NO2), with traffic as the dominating source, makes
it a better proxy for exposure to traffic at the local level,
compared with pollutants such as PM2.5 which have a
more geographically homogenous spread [26]. We also
used GIS-based road data and self-reported living close to
heavy traffic as proxies for exposure.
Study aim
The aim of this study was to investigate the association
between traffic-related air pollution and asthma and
COPD in adults. The outcomes investigated were prevalence of; 1) asthma diagnosis 2) COPD diagnosis 3)
/>
asthma symptoms last 12 months, and 4) chronic bronchitis symptoms, in relation to residential traffic exposure.
Methods
Study area
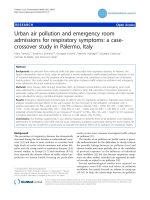
The study area was the most southwestern part of Sweden
(figure 1), the most populated part of the county of
Scania. The study area contains 840 000 of Sweden's total
population of 8.9 million, and has a population density
of 170 inhabitants per km2 (data from 2000). The majority of the population live in six of the communities, the
largest of which is Malmö, the third largest city in Sweden,
with a population of 260 000. A detailed regional description has previously been given [27]. In the geographical
stratification of the present study, "Malmö" refers strictly
to the city boundaries of Malmö, not the larger municipality.
The climate in the region is homogenous. Although pollutant levels in the region are low in an European context,
they are higher than in the remainder of Sweden [28], due
to long-range transport of pollutants from the continent
and extensive harbor and ferry traffic.
Study population & questionnaire
In 2000, a questionnaire was sent to a total of 11933 individuals aged 18–77, of whom 9319 (78%) answered. The
study population originated from two different study
populations, with 5039 (response rate: 71%) from a new
random selection, and 4280 (response rate: 87%) constituting a follow-up group from an earlier selection [29].
The questionnaire dealt with respiratory symptoms,
potential confounders such as smoking habits and occupation, and exposures such as living close to a road with
heavy traffic [29]. An external exposure assessment was
also obtained by geocoding the residential addresses (as
of 2000) of both respondents and non-respondents. This
was achieved by linking each individual's unique 10-digit
personal identity codes to a registry containing the geographical coordinates of all residential addresses.
Non-respondents had a higher mean of NOx than
respondents; 14.7 μg/m3 versus 13.5 μg/m3. To a large
extent this was due to a lower response rate in the more
polluted city of Malmö (73% vs. 80% in the remaining
region).
Outcome measures
The following outcomes were investigated, as obtained by
the postal questionnaires:
• Diagnosis of asthma. "Have you been diagnosed by a doctor as having asthma?"
Page 2 of 15
(page number not for citation purposes)
International Journal of Health Geographics 2009, 8:2
/>
Figure 1
Study area
Study area. Malmö is the largest city in the study region, which comprises the southwestern part of Sweden.
Page 3 of 15
(page number not for citation purposes)
International Journal of Health Geographics 2009, 8:2
• Diagnosis of COPD/CBE (Chronic Bronchitis Emphysema).
"Have you been diagnosed by a doctor as having chronic
bronchitis, emphysema, or COPD?"
• Asthma symptoms during the last 12 months. "Have you
had asthma symptoms during the last 12 months, i.e.
intermittent breathlessness or attacks of breathlessness?
The symptoms may exist with or without cough or wheezing."
• Chronic bronchitis symptoms. "Have you had periods of at
least three months where you brought up phlegm when
coughing on most days?", and if so, "Have you had such
periods during at least two successive years?"
The questionnaire has been published previously [29]. No
information regarding year of disease onset was available.
Exposure assessment
Exposure to traffic-related air pollution was assessed at
each participant's residential address in 2000, using three
different proxies:
1. Self-reported exposure to traffic. This was obtained
from the survey. Exposure was defined as a positive
answer to the question "Do you live close to a road with heavy
traffic?"
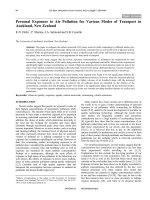
2. Traffic intensity on the heaviest road within 100 m.
GIS-based registers from The Swedish National Road Database [30] provided information about traffic intensity for
all major roads in the county (figure 2). To assess exposure to traffic, we identified the road with the heaviest traffic intensity within 100 m of the residence. Traffic
intensity was categorized as 0–1 cars/min, 2–5 cars/min,
6–10 cars/min, and >10 cars/min, based upon 24-hour
mean levels.
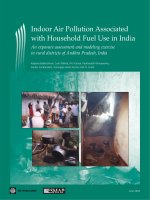
3. Modeled exposure to NOx (figure 3). Annual mean concentrations of NOx were acquired from a pollutant database, based on the year 2001 [25,31]. Emission sources
included in the model were: road traffic, shipping, aviation, railroad, industries and larger energy and heat producers, small scale heating, working machines, working
vehicles, and working tools. Meteorological data were also
included. A modified Gaussian dispersion model (AERMOD) was used for dispersion calculations; a flat twodimensional model which did not adjust for effects of
street canyons or other terrain, but which did take the
height of the emission sources into consideration. Concentrations of NOx were modeled as annual means on a
grid with a spatial resolution of 250 × 250 m. Bilinear
interpolation was used to adjust individual exposure with
weighted values of neighboring area concentrations. Concentrations modeled with this spatial resolution have
/>
been validated and found to have a high correlation with
measured values in the region [25,31].
Statistics
A categorical classification of NOx was used in order to
allow analysis of non-linear associations with outcomes.
To determine the category limits, the subjects (n = 9274)
were divided into NOx-quintiles. The five exposure groups
used were 0–8 μg/m3, 8–11 μg/m3, 11–14 μg/m3, 14–19
μg/m3, and >19 μg/m3.
For all measures of exposure, subgroup analyses were
made for Malmö and the remaining region. Relative risk
was not estimated in exposure groups with fewer than 50
individuals. As few individuals in Malmö had a low exposure to NOx, the middle exposure group was used as the
reference category for NOx, in Malmö. Because of this,
NOx was also used as a continuous variable for trend analysis using logistic regression. A p-value < 0.05 was
regarded as evidence of a trend. Stratified analyses were
performed for sex, age, smoking, geographical region
(Malmö vs. remaining region), and study population
(new random selection vs. follow-up group). Sensitivity
analyses of the associations with traffic were also performed by restricting the groups to those with asthma but
not COPD, and COPD but not asthma, to exclude confounding by comorbidity. This process was also followed
for symptoms.
Relative risk was estimated using Odds Ratios (ORs) with
95% Confidence Intervals (CI). Odds Ratios and tests of
trends were obtained by binary logistic regression, using
version 13.0 of SPSS.
Sex, age (seven categories), and smoking (smokers/exsmokers vs. non-smokers) are known risk factors for
asthma, and were therefore adjusted for in the model.
Socio-Economic Indices (SEI codes, based on occupational status [32]) and occupational exposure (ALOHA
JEM [33]) were tested as confounders, using the "changein-estimate" method [34], where a change in the OR of
10% would have motivated an inclusion in the model.
Neither occupational exposure nor Socio-Economic Indices fulfilled the predetermined confounder criteria, or had
any noticeable impact on the risk estimates, and were thus
not included in the model.
Results
A description of the study population in terms sex, age,
and smoking, along with the associations with the outcomes, is presented in table 1.
Association with self-reported living close to traffic
Asthma diagnosis and asthma symptoms in the last 12
months were associated with self-reported traffic exposure
Page 4 of 15
(page number not for citation purposes)
International Journal of Health Geographics 2009, 8:2
/>
Figure
Regional2road network
Regional road network. Data from the Swedish National Road Network. No heavy road means that no registered road was
available in the database, but local traffic could exist. The traffic intensity categories of (0–1, 2–5, 6–10, >10) cars/min corresponds to daily mean traffic counts of (0–2880, 2880–8640, 8640–14400, >14400) cars/day.
(table 2). These results were consistent in a geographical
stratification (tables 3, 4).
symptoms were not associated with self-reported traffic
exposure (tables 5, 7).
COPD diagnosis was associated with self-reported traffic
exposure, both for the whole region (table 5) and when
geographically stratified (table 6). Chronic bronchitis
Association with traffic intensity on heaviest road within
100 m
Asthma diagnosis and asthma symptoms were associated
with traffic intensity (table 2), with higher prevalence of
Page 5 of 15
(page number not for citation purposes)
International Journal of Health Geographics 2009, 8:2
/>
Figure 3levels of NOx Dispersion modeled annual average of NOx, modeled with a resolution of 250 × 250 m
Modeled
Modeled levels of NOx Dispersion modeled annual average of NOx, modeled with a resolution of 250 × 250 m.
asthma symptoms among those living next to a road with
at least 6 cars/minute, and higher prevalence of asthma
diagnosis among those exposed to at least 10 cars/minute,
compared with the group having no road within 100 m.
The effects seemed consistent, although statistically nonsignificant, across geographical region (tables 3, 4).
COPD and chronic bronchitis symptoms were associated
with traffic intensity (table 5). However, when stratified
geographically, the effect estimates indicated that chronic
bronchitis symptoms were not associated with traffic
intensity in Malmö (table 7).
Association with NOx at residential address
Asthma symptoms, but not asthma diagnosis, were associated with NOx in the trend tests (table 2). However,
effects were only seen in the highest quintile of >19 μg/
m3. A geographical stratification showed that it was only
in Malmö that high exposure was associated with asthma;
no association was found in the region outside (tables 3,
4).
COPD diagnosis and chronic bronchitis symptoms were
associated with NOx(table 5). After geographical stratification, associations were seen only in Malmö, and not in the
region outside (tables 6, 7).
Stratification by smoking, sex, age, response group, and restricted
analysis
In a stratified analysis, the effects of traffic exposure were
more pronounced for smokers than for non-smokers, for
both COPD (table 8) and bronchitis symptoms (data not
shown). A test for interaction, however, showed no significance except for the interaction between smoking and
road within 100 m for chronic bronchitis symptoms (p =
Page 6 of 15
(page number not for citation purposes)
International Journal of Health Geographics 2009, 8:2
/>
Table 1: Description of study population. Disease prevalence in relation to sex, age, and smoking.
n
Diagnosed asthma
Asthma symptoms
Diagnosed COPD
Chronic b. symptoms
Sex
Men
Women
4341
4975
258(5.9%)
428(8.6%)
429(9.9%)
686(13.8%)
172(4.0%)
243(4.9%)
308(7.1%)
327(6.6%)
Ever smoker
No
Yes
4306
5010
291(6.8%)
395(7.9%)
431(10.0%)
684(13.7%)
118(2.7%)
297(5.9%)
217(5.0%)
418(8.3%)
Age
18–19
20–29
30–39
40–49
50–59
60–69
70–77
135
1062
2045
1887
2123
1586
478
15(11.1%)
110(10.4%)
158(7.7%)
112(5.9%)
142(6.7%)
113(7.1%)
36(7.5%)
23(17%)
141(13.3%)
246(12.0%)
217(11.5%)
237(11.2%)
178(11.2%)
73(15.3%)
3(2.2%)
19(1.8%)
61(3.0%)
69(3.7%)
106(5.0%)
115(7.3%)
42(8.8%)
9(6.7%)
41(3.9%)
108(5.3%)
101(5.4%)
185(8.7%)
139(8.8%)
52(10.9%)
0.023). Asthma showed no indications of effect modification by smoking.
No effect modifications were seen when the data were
stratified by sex, age, or sample group (new participants
vs. follow-up group). Restriction of analysis to asthmatics
without COPD, and to those with COPD without asthma,
was performed for both diagnoses and symptoms. The
results showed similar effects in the restricted and nonrestricted groups. The overlaps between the different disease outcome definitions are presented in table 9.
Discussion
Overall, residential traffic was associated with a higher
prevalence of both asthma diagnosis and asthma symptoms in the last 12 months, as well as COPD diagnosis
and chronic bronchitis symptoms. Traffic intensity on the
heaviest road within 100 m showed effects at a traffic
intensity of >6 cars/min. Effects from NOx were seen in the
highest exposure quintile of >19 μg/m3, but only in
Malmö, not in the region outside.
Discussion of exposure assessment
The major strength of this study was the use of three different proxies of exposure, which may have different
intrinsic strengths and weaknesses. The strengths of the
NOx model are firstly that it reflects total traffic density in
the area, and secondly the fact that the dispersion model
has been validated, with a resolution of 250 × 250 m
showing a high correlation with measured background
concentrations [25]. Nevertheless, street-level concentrations may vary on a much smaller scale. High peak concentrations are often found in so-called "street canyons"
in urban areas, where pollutants are trapped between high
buildings [23]. Since the dispersion model did not take
account of this kind of accumulation effect, the true expo-
Table 2: Asthma diagnosis and asthma symptoms in relation to traffic.
Asthma Diagnosis
Asthma Symptoms
Heavy traffic
No
Yes
n
6041
3275
n (%)
400(6.6%)
286(8.7%)
OR a
1.00
1.28(1.09–1.50)
n
6041
3275
n (%)
668(11.1%)
447(13.6%)
OR a,
1.00
1.22(1.07–1.39)
Heaviest road within <100 m
no heavy road
<2 cars/min
2–5 cars/min
6–10 cars/min
>10 cars/min
3755
2235
1820
886
578
269(7.2%)
149(6.7%)
134(7.4%)
69(7.8%)
61(10.6%)
1.00
0.92(0.75–1.13)
1.00(0.81–1.25)
1.05(0.79–1.38)
1.40(1.04–1.89)
3755
2235
1820
886
578
419(11.2%)
263(11.8%)
216(11.9%)
126(14.2%)
85(14.7%)
1.00
1.05(0.89–1.24)
1.06(0.89–1.26)
1.25(1.01–1.55)
1.29(1.00–1.67)
NOx (μg/m3)
0–8
8–11
11–14
14–19
>19
1855
1855
1855
1858
1851
140(7.5%)
146(7.9%)
124(6.7%)
115(6.2%)
157(8.5%)
p-trend
1.00
1.04(0.82–1.32)
0.85(0.66–1.09)
0.77(0.60–1.00)
1.05(0.83–1.34)
0.84
1855
1855
1855
1858
1851
217(11.7%)
213(11.5%)
208(11.2%)
206(11.1%)
265(14.3%)
p-trend
1.00
0.97(0.80–1.19)
0.94(0.77–1.15)
0.90(0.74–1.11)
1.21(0.99–1.46)
0.026
a Adjusted
for age, sex, and smoking. [OR(95%CI)].
Page 7 of 15
(page number not for citation purposes)
International Journal of Health Geographics 2009, 8:2
/>
Table 3: Geographical stratification. Asthma diagnosis in the city of Malmö and the area outside.
Malmö
Region outside Malmö
Heavy traffic
No
Yes
n
1767
1877
Asthma diagnosis
109(6.2%)
161(8.6%)
OR a
1.00
1.35(1.05–1.75)
n
4178
1343
Asthma diagnosis
283(6.8%)
119(8.9%)
OR a
1.00
1.28(1.02–1.61)
Heaviest road within <100 m
no heavy road
<2 cars/min
2–5 cars/min
6–10 cars/min
>10 cars/min
586
1021
837
663
537
40(6.8%)
66(6.5%)
57(6.8%)
50(7.5%)
57(10.6%)
1.00
0.95(0.63–1.43)
0.99(0.65–1.51)
1.12(0.72–1.72)
1.50(0.98–2.31)
3124
1193
961
212
31
224(7.2%)
82(6.9%)
75(7.8%)
19(9.0%)
2
1.00
0.95(0.73–1.23)
1.07(0.81–1.40)
1.21(0.74–1.99)
-
NOx (μg/m3)
0–8
8–11
11–14
14–19
>19
13
46
562
1325
1698
1
5
39(6.9%)
76(5.7%)
149(8.8%)
1.00
0.79(0.53–1.18)
1.18(0.81–1.71)
1824
1792
1268
510
127
138(7.6%)
138(7.7%)
83(6.5%)
37(7.3%)
6(4.7%)
1.00
1.01(0.79–1.30)
0.81(0.61–1.08)
0.93(0.64–1.36)
0.58(0.25–1.34)
p-trend
0.044
p-trend
0.079
a Adjusted
for age, sex, and smoking. [OR(95%CI)].
sure among people living in these surroundings might
have been underestimated. This may partly explain why
effects from NOx were seen in the urban city of Malmö but
not in the surrounding area.
The proportion of NOx that originates from traffic is also
dependent on geographical area. In urban areas of southern Sweden, local traffic contributes approximately 50–
60% of total NOx, while in the countryside such traffic is
responsible for only 10–30% of total NOx (S. Gustafsson,
personal communication, 2007-10-17). This difference
was also reported by the SAPALDIA study, which found
that local traffic accounted for the majority of NOx in
urban but not rural areas [35]. This indicates that our
model of NOx is a good proxy for exposure to trafficrelated air pollution in an urban area, but may not be sensitive enough to capture individual risk in the countryside,
where traffic contributes to a lower proportion of total
concentrations.
Self-reported living close to a road with heavy traffic, and
traffic intensity on the heaviest road within 100 m, are
simple proxies; they do not reflect, for example, whether
someone lives at a junction. Still, they have the advantage
that they are less limited by aggregation in space than the
NOx model. In the present study, both of these variables
Table 4: Geographical stratification. Asthma symptoms in the city of Malmö and the region outside.
Malmö
Region outside Malmö
Heavy traffic
No
Yes
n
1767
1877
Asthma symptoms
209(11.8%)
263(14.0%)
OR a
1.00
1.17(0.96–1.43)
n
4178
1343
Asthma symptoms
449(10.7%)
178(13.3%)
OR a
1.00
1.23(1.02–1.49)
Heaviest road within <100 m
No heavy road
<2 cars/min
2–5 cars/min
6–10 cars/min
>10 cars/min
586
1021
837
663
537
74(12.6%)
119(11.7%)
101(12.1%)
97(14.6%)
81(15.1%)
1.00
0.93(0.68–1.26)
0.97(0.70–1.33)
1.17(0.85–1.63)
1.19(0.84–1.68)
3124
1193
961
212
31
342(10.9%)
142(11.9%)
112(11.7%)
29(13.7%)
2
1.00
1.09(0.88–1.34)
1.06(0.84–1.33)
1.24(0.82–1.87)
-
NOx (μg/m3)
0–8
8–11
11–14
14–19
>19
13
46
562
1325
1698
1
6
65(11.6%)
146(11.0%)
254(15.0%)
1.00
0.90(0.66–1.23)
1.28(0.95–1.72)
1824
1792
1268
510
127
215(11.8%)
205(11.4%)
142(11.2%)
57(11.2%)
8(6.3%)
1.00
0.96(0.79–1.18)
0.93(0.74–1.16)
0.95(0.69–1.29)
0.50(0.24–1.04)
p-trend
0.002
p-trend
0.344
a Adjusted
for age, sex, and smoking. [OR (95%CI)].
Page 8 of 15
(page number not for citation purposes)
International Journal of Health Geographics 2009, 8:2
/>
Table 5: COPD diagnosis and chronic bronchitis symptoms in relation to traffic.
COPD Diagnosis
n
6041
3275
Chronic bronchitis
symptoms
n, (%)
OR a
n
243(4.0%) 1.00
6041
172(5.3%) 1.36(1.10–1.67) 3275
n, (%)
OR a
401(6.6%) 1.00
234(7.1%) 1.11(0.94–1.31)
Heavy traffic
No
Yes
Heaviest road within
<100 m
no heavy road 3755
153(4.1%) 1.00
3755
222(5.9%) 1.00
<2 cars/min
2–5 cars/min
6–10 cars/min
>10 cars/min
2235
1820
886
578
95(4.3%)
71(3.9%)
60(6.8%)
34(5.9%)
1.04(0.80–1.35)
0.96(0.72–1.28)
1.57(1.15–2.14)
1.64(1.11–2.41)
2235
1820
886
578
159(7.1%)
137(7.5%)
67(7.6%)
48(8.3%)
1.21(0.98–1.50)
1.30(1.04–1.62)
1.24(0.93–1.65)
1.53(1.10–2.13)
0–8
8–11
11–14
14–19
>19
1855
1855
1855
1858
1851
74(4.0%)
68(3.7%)
87(4.7%)
83(4.5%)
101(5.5%)
1.00
0.89(0.63–1.24)
1.19(0.86–1.64)
1.03(0.74–1.42)
1.43(1.04–1.95)
1855
1855
1855
1858
1851
110(5.9%)
118(6.4%)
121(6.5%)
122(6.6%)
162(8.8%)
1.00
1.05(0.81–1.38)
1.12(0.86–1.46)
1.06(0.81–1.39)
1.55(1.21–2.00)
p-trend
0.010
p-trend
<0.0001
NOx (μg/m3)
a Adjusted
for age, sex, and smoking. [OR(95%CI)].
showed fairly consistent associations, at least with
asthma, despite large differences in the level of NOx that
they corresponded to in Malmö and the region outside
(table 10); this may indicate that adverse effects from traffic pollutants are mainly seen in close proximity to traffic.
High traffic intensity, however, may not only correlate
with high total number of vehicles, but also with a higher
proportion of heavy vehicles, an additional factor which
could affect the outcome, since diesel exhaust from heavy
vehicles might have more adverse respiratory effects [36].
It should be noted that the distribution of exposure is not
comparable between the proxies. While NOx was divided
into quintiles, with 20% in the highest exposure category,
only 6% of the population lay in the highest traffic intensity category. Thus, the different proxies are complementary rather than comparable in this study.
One limitation of all three proxies of exposure was that
traffic-related air pollution was only estimated by residential address. Lack of individual data about work address
and time spent commuting could have biased the expo-
Table 6: Geographical stratification. COPD diagnosis in Malmö and the region outside.
Malmö
Region outside Malmö
Heavy traffic
No
Yes
n
1767
1877
COPD
85(4.8%)
103(5.5%)
OR a
1.00
1.24(0.92–1.67)
n
4178
1343
COPD
152(3.6%)
69(5.1%)
OR a
1.00
1.47(1.09–1.97)
Heaviest road within <100 m
no heavy road
<2 cars/min
2–5 cars/min
6–10 cars/min
>10 cars/min
586
1021
837
663
537
28(4.8%)
44(4.3%)
35(4.2%)
50(7.5%)
31(5.8%)
1.00
0.89(0.55–146)
0.89(0.53–1.48)
1.53(0.95–2.48)
1.34(0.79–2.28)
3124
1193
961
212
31
124(4.0%)
49(4.1%)
35(3.6%)
10(4.7%)
3
1.00
1.06(0.75–1.49)
0.93(0.64–1.37)
1.20(0.62–2.35)
-
NOx (μg/m3)
0–8
8–11
11–14
14–19
>19
13
46
562
1325
1698
0
2
27(4.8%)
64(4.8%)
95(5.6%)
1.00
0.94(0.59–1.49)
1.23(0.79–1.92)
1824
1792
1268
510
127
72(3.9%)
66(3.7%)
60(4.7%)
18(3.5%)
5(3.9%)
1.00
0.90(0.64–1.27)
1.26(0.89–1.80)
0.91(0.54–1.55)
1.19(0.47–3.02)
p-trend
0.142
p-trend
0.421
a Adjusted
for age, sex, and smoking. [OR (95%CI)].
Page 9 of 15
(page number not for citation purposes)
International Journal of Health Geographics 2009, 8:2
/>
Table 7: Geographical stratification. Chronic bronchitis symptoms in the city of Malmö and the area outside.
Malmö
Region outside Malmö
Heavy traffic
No
Yes
n
1767
1877
Chronic b. symptoms
150(8.5%)
140(7.5%)
OR a
1.00
0.91(0.71–1.16)
n
4178
1343
Chronic b. symptoms
246(5.9%)
92(6.9%)
OR a
1.00
1.20(0.94–1.54)
Heaviest road within <100 m
no heavy road
<2 cars/min
2–5 cars/min
6–10 cars/min
>10 cars/min
586
1021
837
663
537
43(7.3%)
89(8.7%)
66(7.9%)
47(7.1%)
45(8.4%)
1.00
1.21(0.83–1.77)
1.10(0.73–1.64)
0.94(0.61–1.45)
1.22(0.78–1.89)
3124
1193
961
212
31
179(5.7%)
68(5.7%)
69(7.2%)
19(9.0%)
3
1.00
1.00(0.75–1.34)
1.30(0.98–1.74)
1.63(0.99–2.69)
-
NOx (μg/m3)
0–8
8–11
11–14
14–19
>19
13
46
562
1325
1698
0
4
35(6.2%)
96(7.2%)
155(9.1%)
1.00
1.13(0.76–1.70)
1.57(1.06–2.30)
1824
1792
1268
510
127
109(6.0%)
113(6.3%)
84(6.6%)
26(5.1%)
6(4.7%)
1.00
1.04(0.79–1.37)
1.17(0.87–1.57)
0.88(0.57–1.37)
0.86(0.37–2.01)
p-trend
0.017
p-trend
0.541
a Adjusted
for age, sex, and smoking. [OR(95%CI)].
sure assessments, particularly for people living in areas
with low exposure to traffic-related air pollution, where
individual differences in daily activities outside the residential area translate to a large proportion of total exposure [37]. In Los Angeles, 1 h commuting/day contributes
approximately 10–50% of people's daily exposure to
ultrafine particles from traffic [38]. While only 20% of the
working population living in Malmö commute to work
outside Malmö, the majority of the population in smaller
municipalities in the remaining region commute to work
outside their own municipality [39].
Another limitation was the cross-sectional nature of the
study; we had no information about disease onset or years
living at current address, making it hard to establish a
temporal relationship between cause and effect. However,
since asthma and COPD are known to be exacerbated by
traffic-related air pollution, subjects with disease may
have been more likely to move away from traffic, rather
than towards it, and so a migrational bias would mainly
be expected to dilute the effects.
Table 8: Stratification on smoking. COPD diagnosis in relation to traffic among smokers/ex-smokers and non-smokers.
Smokers/ex-smokers
Non-smokers
COPD D
167(5.3%)
130(7.0%)
OR a
1.00
1.43(1.13–1.82)
n
2892
1414
COPD D
76(2.6%)
42(3.0%)
OR a
1.00
1.19(0.81–1.76)
Heavy traffic
No
Yes
n
3149
1861
Heaviest road within <100 m
no heavy road
<2 cars/min
2–5 cars/min
6–10 cars/min
>10 cars/min
1951
1185
992
522
344
104(5.3%)
67(5.7%)
52(5.2%)
44(8.4%)
28(8.1%)
1.00
1.06(0.77–1.45)
0.99(0.70–1.40)
1.56(1.08–2.26)
1.84(1.18–2.86)
1804
1050
828
364
234
49(2.7%)
28(2.7%)
19(2.3%)
16(4.4%)
6(2.6%)
1.00
0.99(0.62–1.59)
0.88(0.51–1.51)
1.64(0.92–2.94)
1.15(0.48–2.75)
NOx (μg/m3)
0–8
8–11
11–14
14–19
>19
969
971
945
1037
1072
47(4.9%)
47(4.8%)
63(6.7%)
60(5.8%)
78(7.3%)
1.00
0.96(0.63–1.46)
1.35(0.92–2.00)
1.14(0.92–2.00)
1.61(1.11–2.35)
886
884
910
821
779
27(3.0%)
21(2.4%)
24(2.6%)
23(2.8%)
23(3.0%)
1.00
0.77(0.43–1.37)
0.92(0.52–1.61)
0.85(0.48–1.50)
1.12(0.63–1.98)
Test för
Interaction
Heavy traffic*eversmoker
Heaviestroad100 m*eversmoker
NOx*eversmoker
a Adjusted
p = 0.47
p = 0.89
p = 0.83
for age and sex. [OR(95%CI)].
Page 10 of 15
(page number not for citation purposes)
International Journal of Health Geographics 2009, 8:2
/>
Table 9: Description of overlap between the different reported disease outcomes. Percentage within row. The first row shows that
70% of those with asthma diagnosis had asthma symptoms, 20% of those with asthma diagnosis had COPD diagnosis, and 21% of those
with asthma diagnosis had chronic bronchitis symptoms.
Total n Asthma diagnosis n (%)
Asthma diagnosis
Asthma symptoms
COPD diagnosis
Chronic bronchitis symptoms
Asthma symptoms n (%)
COPD diagnosis n (%)
Chronic b. Symptoms (n %)
686
1115
415
635
483 (70%)
219 (53%)
277 (44%)
139 (20%)
219 (20%)
152 (24%)
145 (21%)
277 (25%)
152 (37%)
-
483 (43%)
139 (34%)
145 (23%)
Discussion of potential confounding
Areas with high levels of exposure to traffic-related air pollution were mainly located in the city of Malmö (table 4
and figure 2), while low exposure was found in more
sparsely populated areas. It is a well recognized problem
that the different exposure levels in rural and urban environments are also accompanied by large differences in
lifestyle factors, and even if confounders are controlled
for, unmeasured factors may remain. Since NOx was limited by its spatial resolution, it is also the measure that was
most susceptible to ecological bias. The lack of association
seen with NOx, in the region outside Malmö might thus
reflect that the individual risk from traffic is being overridden by some other factor correlating with low exposure
levels. The existence of independent risk factors correlating with low exposure is given some support by a Swedish
study which found a tendency to higher adult asthma incidence in rural areas, after adjustment for exposure to traffic [11].
The most important risk factors from a validity standpoint, however, are factors that could correlate with high
exposure to traffic-related air pollution, and thus cause a
false positive relationship, such as socio-economic and
occupational risk factors. However, the present study,
which used individual-level data, found no confounding
effects for either socio-economic status or occupational
exposure. A recently developed and validated JEM was
used to adjust for occupational exposure [33]. In a JEM,
people are assigned the statistically average level of exposure in their occupation; this is an aggregated form of
exposure assessment that can suffer from misclassification
bias, although non-differential to disease. Since we only
had information on the participants' current occupations,
we cannot rule out the possibility of a "healthy worker
effect". Lack of information about occupational history
may be a limitation, especially in relation to the prevalence of COPD/chronic bronchitis.
Results discussion
Although asthma and COPD have many risk factors in
common and often coexist in clinical settings, and there is
some evidence that asthma may be a risk factor for the
development of COPD [40], they are distinct conditions,
with differing clinical course and pathological features.
Thus, inconsistencies between studies in the relation
between air pollution and asthma/COPD could depend
both on the presence of different competing risk factors,
Table 10: Relation between the exposure proxies and modeled NOx (μg/m3) as a continuous variable.
Malmö NOx
Region outside Malmö NOx
n
Mean
SD
Median
n
Mean
SD
Median
Heavy traffic
No
Yes
1507
1772
18.0
19.6
3.1
3.2
17.4
19.6
4502
1495
10.2
12.1
3.5
4.5
9.6
11.4
Heaviest road within <100 m
no heavy road
<2 cars/min
2–5 cars/min
6–10 cars/min
>10 cars/min
488
855
746
627
561
17.6
18.0
18.9
18.1
21.9
3.4
2.9
3.3
2.8
2.0
17.2
17.8
19.4
17.4
22.0
3267
1380
1074
259
17
10.1
9.8
12.6
13.8
19.2
3.4
4.3
3.8
2.3
4.4
9.6
8.1
11.5
14.03
21.6
NOx (μg/m3)
0–8
8–11
11–14
14–19
>19
13
46
562
1325
1698
6.8
10.4
13.5
16.7
21.7
1.3
0.8
0.7
1.3
1.3
6.8
9.6
13.7
15.9
21.5
1824
1792
1268
510
127
6.7
9.9
12.8
15.7
21.9
1.1
0.8
1.0
1.2
3.8
6.8
10.0
12.7
15.3
21.2
Total
3644
18.4
3.6
18.5
5521
10.31
3.6
10.04
Page 11 of 15
(page number not for citation purposes)
International Journal of Health Geographics 2009, 8:2
/>
and on geographically different pollution mixtures acting
on different regions of the respiratory tract. It is therefore
important to consider local pollution characteristics as
thoroughly as possible (tables 11, 12). When using traffic
intensity or self-reported traffic exposure as a proxy, there
is a lack of knowledge of the exact pollution compounds
that this exposure represents. One known characteristic of
traffic-related pollution in the study region is a large
amount of wear particles from road-tire interaction. These
particles have been shown to be potent inducers of local
inflammation [41,42], and their levels are high in the
Scandinavian countries due to the use of traction sand and
studded tires.
very heterogenous among the Swedish centers (although
overall heterogeneity tested was non-significant). [15].
Most relevantly, a Swedish study found a non-significant
tendency to increased asthma incidence among adults living close to traffic flows, and measured NO2 levels comparable to those found in the present study [11]. Another
study of asthma symptoms in Sweden found a significant
but weak relation to NO2 [44], although a stronger relation was found with self-reported measures of traffic. The
findings in the present study, support the existence of a
relation between exposure to traffic-related air pollution
and asthma in adults at relatively low levels of trafficrelated air pollution.
Although levels of traffic pollution in Sweden are lower
than those found in most other countries, the results for
asthma are basically supported by some European studies
with higher exposure levels. An Italian study reported an
association between symptom exaggeration of adult
asthma and NO2 exposure levels [12], and the Swiss
SAPALDIA study observed an increase of asthma-related
symptoms, although not current asthma, in relation to
NO2 [43]. The European ECRHS study found a positive
association between NO2 (modeled with a resolution of 1
km) and asthma incidence, but effect estimates seemed
For COPD, a German study restricted to women found
that COPD as defined by the GOLD criteria was 1.79
times more likely (95% CI 1.06–3.02) for those living less
than 100 m from a road with 10 000 cars/day, than for
those living farther away [19]. This is in agreement with
our results, which found effects for living less than 100 m
from a road with 6 cars/min (8 640 cars/day).
The European ECRHS study found that new onset of
chronic bronchitis, as defined by chronic phlegm, was
related among females to both self-reported traffic inten-
Table 11: Urban background. Descriptive data of regional air pollution at a monitoring station in Malmö. Annual mean concentrations
of traffic-related pollutants measured at Rådhuset Malmö 1980–2006. Data source: IVL Swedish Environmental Research Institute Ltd.
/>
Year
SO2 (μg/m3)
NO2 (μg/m3)
O3 (μg/m3)
PM10 (μg/m3)
PM2.5 (μg/m3)
1980*
1981
1982
1983
1984
1985
1986
1987
1988
1989
1990
1991
1992
1993
1994
1995
1996
1997
1998
1999
2000
2001
2002
2003
2004
2005
2006
49
50
43
33,1
22,9
20,3
16,7
20,3
13
12
9
8
7
8
6
6
8
5
4
4
2
2
2
3
3
4
3
42
39
31
32
30.5
26.9
21.3
19.6
22.4
25.6
21.4
22
24.6
26.2
21.8
23.5
22.9
21.1
20.3
20.8
19.5
20.6
19.3
46
39
41
43
40
43
50
50
48
47
50
49
46
52
49
54
49
52
17.4
17.6
15.2
15.8
16.5
18.7
18.1
21.6
15.9
17.5
18.2
12.6
13.5
12
11.5
13.7
10
11.1
12.3
Page 12 of 15
(page number not for citation purposes)
International Journal of Health Geographics 2009, 8:2
/>
Table 12: Rural background. Descriptive data of regional air pollution at a monitoring station in a rural area. Annual mean
concentrations of traffic-related pollutants measured at Vavihill 1985–2006. Data source: IVL Swedish Environmental Research
Institute Ltd. />
Year
SO2 (μg/m3)
NO2 (μg/m3)
O3' (μg/m3)
PM10 (μg/m3)
1985
1986
1987
1988
1989
1990
1991
1992
1993
1994
1995
1996
1997
1998
1999
2000
2001
2002
2003
2004
2005
2006
5.14
2.36
2.27
2.11
1.84
2.66
2.36
2.08
1.72
1.98
1.78
1.92
1.77
2.05
1.87
1.66
1.70
1.37
1.39
1.54
1.48
1.47
1.59
60.2
59.9
55.1
57.7
56.5
55.0
51.3
56.0
57.4
58.6
59.3
63.0
58.8
54.6
59.1
57.6
60.2
66.6
62.9
58.5
61.0
64.3
16.0
15.4
16.3
18.6
13.8
15.2
17.3
5.47
3.90
3.93
2.98
2.64
2.06
1.70
1.17
1.35
1.31
0.67
0.74
0.55
0.45
0.42
0.37
0.52
0.37
0.49
0.50
sity (constant traffic vs. none, OR = 1.86; 95% CI 1.24 to
2.77) and home outdoor NO2 (OR = 50 μg/m3 vs. 20 μg/
m3 = 2.71; 95% CI 1.03 to 7.16) [20]. The higher levels of
NO2 seen in the ECRHS study may partly stem from truly
higher concentrations, but may also have been affected by
the use of home outdoor measurements, which are better
than our models at capturing locally high peak exposures.
Other studies have suggested an effect modification for
sex, with women being at higher risk, but this was not
observed in our study. Our results did indicate effect modification by smoking, but tests for interaction were mainly
non-significant. No interaction with smoking was found
in any of the abovementioned studies of the effects of air
pollution on prevalence/incidence of COPD in adults.
PM2.5 (μg/m3)
Competing interests
The authors declare that they have no competing interests.
Authors' contributions
AL: Conducted the statistical analyses and wrote the main
part of the manuscript. ES: Performed GIS analyses and
wrote part of the manuscript. PM: Designed and conducted the survey and made revisions on drafts. UN:
Designed and conducted the survey and made revisions
on drafts. KJ: Designed the study and made revisions on
drafts. AA: Wrote part of the manuscript and made major
revisions of drafts. All authors read and approved the final
manuscript.
Acknowledgements
Overall, our results show that traffic-related air pollution
is associated with the prevalence of COPD/chronic bronchitis in adults, but there is still a need for further investigation of the reasons behind the inconsistencies seen
when the data were stratified by region.
Conclusion
Residential traffic is associated with both current symptoms and prevalence of diagnosis of asthma and COPD/
chronic bronchitis, among adults in southern Sweden.
This may indicate that traffic has not only short-term but
also long-term effects on adult chronic respiratory disease,
even in a region with low overall levels of traffic pollution.
The authors would like to acknowledge Susanna Gustafsson and Håkan Tinnerberg, for providing valuable comments. Hans Kromhout provided the
ALOHA job-exposure matrix. The study was supported by grants from the
Swedish Environmental Protection Agency, the Swedish Emission Research
Program, and the Faculty of Medicine at Lund University.
References
1.
2.
3.
Halonen JI, Lanki T, Yli-Tuomi T, Kulmala M, Tiittanen P, Pekkanen J:
Urban Air Pollution And Asthma And Copd Hospital Emergency Room Visits. Thorax 2008, 63(7):635-41.
Kim JJ, Huen K, Adams S, Smorodinsky S, Hoats A, Malig B, Lipsett M,
Ostro B: Residential traffic and children's respiratory health.
Environ Health Perspect 2008, 116(9):1274-9.
Brauer M, Hoek G, Van Vliet P, Meliefste K, Fischer PH, Wijga A,
Koopman LP, Neijens HJ, Gerritsen J, Kerkhof M, Heinrich J, Bellander T, Brunekreef B: Air pollution from traffic and the development of respiratory infections and asthmatic and allergic
Page 13 of 15
(page number not for citation purposes)
International Journal of Health Geographics 2009, 8:2
4.
5.
6.
7.
8.
9.
10.
11.
12.
13.
14.
15.
16.
17.
18.
19.
20.
symptoms in children. Am J Respir Crit Care Med 2002,
166(8):1092-8.
Morgenstern V, Zutavern A, Cyrys J, Brockow I, Gehring U, Koletzko
S, Bauer CP, Reinhardt D, Wichmann HE, Heinrich J: Respiratory
health and individual estimated exposure to traffic-related
air pollutants in a cohort of young children. Occup Environ Med
2007, 64(1):8-16.
Brauer M, Hoek G, Smit HA, de Jongste JC, Gerritsen J, Postma DS,
Kerkhof M, Brunekreef B: Air pollution and development of
asthma, allergy and infections in a birth cohort. Eur Respir J
2007, 29(5):879-88.
Morgenstern V, Zutavern A, Cyrys J, Brockow I, Koletzko S, Krämer
U, Behrendt H, Herbarth O, von Berg A, Bauer CP, Wichmann HE,
Heinrich J, GINI Study Group; LISA Study Group: Am J Respir Crit Care
Med 2008, 177(12):1331-7.
Jerrett M, Shankardass K, Berhane K, Gauderman WJ, Künzli N, Avol
E, Gilliland F, Lurmann F, Molitor JN, Molitor JT, Thomas DC, Peters
J, McConnell R: Traffic-related air pollution and asthma onset
in children: a prospective cohort study with individual exposure measurement. Environ Health Perspect 2008, 116(10):1433-8.
Gauderman WJ, Vora H, McConnell R, Berhane K, Gilliland F, Thomas D, Lurmann F, Avol E, Kunzli N, Jerrett M, Peters J: Effect of
exposure to traffic on lung development from 10 to 18 years
of age: a cohort study. Lancet 2007, 369(9561):571-7.
Oftedal B, Brunekreef B, Nystad W, Madsen C, Walker SE, Nafstad
P: Residential outdoor air pollution and lung function in
schoolchildren. Epidemiology 2008, 19(1):129-37.
Viegi G, Maio S, Pistelli F, Baldacci S, Carrozzi L: Epidemiology of
chronic obstructive pulmonary disease: health effects of air
pollution. Respirology 2006, 11(5):523-32.
Modig L, Järvholm B, Rönnmark E, Nyström L, Lundbäck B, Andersson C, Forsberg B: Vehicle exhaust exposure in an incident
case-control study of adult asthma. Eur Respir J 2006,
28(1):75-81.
de Marco R, Poli A, Ferrari M, Accordini S, Giammanco G, Bugiani M,
Villani S, Ponzio M, Bono R, Carrozzi L, Cavallini R, Cazzoletti L, Dallari R, Ginesu F, Lauriola P, Mandrioli P, Perfetti L, Pignato S, Pirina P,
Struzzo P, ISAYA study group: Italian Study on Asthma in Young
Adults, The impact of climate and traffic-related NO2 on the
prevalence of asthma and allergic rhinitis in Italy. Clin Exp
Allergy 2002, 32(10):1405-12.
Cesaroni G, Badaloni C, Porta D, Forastiere F, Perucci CA: Comparison between several indices of exposure to traffic-related
air pollution and their respiratory health impact in adults.
Occup Environ Med 2008.
Montnémery P, Bengtsson P, Elliot A, Lindholm LH, Nyberg P, Löfdahl
CG: Prevalence of obstructive lung diseases and respiratory
symptoms in relation to living environment and socio-economic group. Respir Med 2001, 95(9):744-52.
Jacquemin B, Sunyer J, Forsberg B, Aguilera I, Briggs D, García-Esteban
R, Gưtschi T, Heinrich J, Järvholm B, Jarvis D, Vienneau D, Künzli N:
Home Outdoor NO2 and New Onset of Self-Reported
Asthma in Adults. Epidemiology 2008 in press.
Heinrich J, Topp R, Gehring U, Thefeld W: Traffic at residential
address, respiratory health, and atopy in adults: the National
German Health Survey 1998. Environ Res 2005, 98(2):240-9.
Wyler C, Braun-Fahrländer C, Künzli N, Schindler C, Ackermann-Liebrich U, Perruchoud AP, Leuenberger P, Wüthrich B: Exposure to
motor vehicle traffic and allergic sensitization. The Swiss
Study on Air Pollution and Lung Diseases in Adults (SAPALDIA) Team. Epidemiology 2000, 11(4):450-6.
Zemp E, Elsasser S, Schindler C, Künzli N, Perruchoud AP,
Domenighetti G, Medici T, Ackermann-Liebrich U, Leuenberger P,
Monn C, Bolognini G, Bongard JP, Brändli O, Karrer W, Keller R,
Schöni MH, Tschopp JM, Villiger B, Zellweger JP: Long-term ambient air pollution and respiratory symptoms in adults (SAPALDIA study). The SAPALDIA Team. Am J Respir Crit Care Med
1999, 159(4 Pt 1):1257-66.
Schikowski T, Sugiri D, Ranft U, Gehring U, Heinrich J, Wichmann HE,
Krämer U: Long-term air pollution exposure and living close
to busy roads are associated with COPD in women. Respir Res
2005, 6:152.
Sunyer J, Jarvis D, Gotschi T, Garcia-Esteban R, Jacquemin B, Aguilera
I, Ackerman U, de Marco R, Forsberg B, Gislason T, Heinrich J, Norbäck D, Villani S, Künzli N: Chronic bronchitis and urban air pol-
/>
21.
22.
23.
24.
25.
26.
27.
28.
29.
30.
31.
32.
33.
34.
35.
36.
37.
38.
39.
40.
41.
lution in an international study. Occup Environ Med 2006,
63(12):836-43.
Forastiere F, Galassi C: Self report and GIS based modelling as
indicators of air pollution exposure: is there a gold standard?
Occup Environ Med 2005, 62(8):508-9.
Zhou Y, Levy JI: Factors influencing the spatial extent of
mobile source air pollution impacts: a meta-analysis. BMC
Public Health 2007, 7:89.
Kirby C, Greig A, Drye T: Temporal and Spatial Variations in
Nitrogen Dioxide Concentrations Across an Urban Landscape: Cambridge, UK. Environmental Monitoring and Assessment
1998, 52:65-82.
Salam MT, Islam T, Gilliland FD: Recent evidence for adverse
effects of residential proximity to traffic sources on asthma.
Curr Opin Pulm Med 2008, 14(1):3-8.
Gustafsson S: Uppbyggnad och validering av emissionsdatabas
avseende luftföroreningar för Skåne med basår 2001 [A geographical and temporal high resolution emission database
for dispersion modelling of environmental NOX in Southern
Sweden.]. The Department of Physical Geography and Ecosystem Analysis. In Swedish, english summary 2007 [ />download/27330/192790/file/Susanna_Gustafsson_lic.pdf]. Lund University: Lund
Kunzli N, Tager IB: Long-term health effects of particulate and
other ambient air pollution: research can progress faster if
we want it to. Environ Health Perspect 2000, 108(10):915-8.
Stroh E, Oudin A, Gustafsson S, Pilesjö P, Harrie L, Strömberg U,
Jakobsson K: Are associations between socio-economic characteristics and exposure to air pollution a question of study
area size? An example from Scania, Sweden. Int J Health Geogr
2005, 4:30.
Sjöberg, Luftkvalitet i tätorter 2005. IVL [Swedish Environmental Research
Institute]: Stockholm 2006.
Nihlén U, Montnémery P, Andersson M, Persson CG, Nyberg P, Löfdahl CG, Greiff L: Specific nasal symptoms and symptom-provoking factors may predict increased risk of developing
COPD. Clin Physiol Funct Imaging 2008, 28(4):240-50.
Vägverket, NVDB Nationell vägdatabas [The Swedish
national road database] 2007 [ />Stroh E: The use of GIS in Exposure-Response Studies, in The
Department of Physical Geography and Ecosystem Analysis.
2006 [ />Emilie_Stroh_lic.pdf]. Lund University: Lund
Statistics-Sweden, The Socio-economic Classification of
Occupation. Stockholm. 1982.
Matheson MC, Benke G, Raven J, Sim MR, Kromhout H, Vermeulen
R, Johns DP, Walters EH, Abramson MJ: Biological dust exposure
in the workplace is a risk factor for chronic obstructive pulmonary disease. Thorax 2005, 60(8):645-51.
Greenland : Modeling and variable selection in epidemiologic
analysis. American Journal of Public Health 1989, 79(3):340-349.
Liu SL-JC, Keidel D, Heldstab J, Kûnzli N, Bayer-Oglesby L, Ackermann-Liebrich U, Schindler C, the SAPALDIA team: Characterization of Source-Specific Air Pollution Exposure for a Large
Population-Based Swiss Cohort (SAPALDIA). Environmental
Health Perspectives 2007.
Brunekreef B, Janssen NA, de Hartog J, Harssema H, Knape M, van
Vliet P: Air pollution from truck traffic and lung function in
children living near motorways.
Epidemiology 1997,
8(3):298-303.
Berhane KGW, Stram OD, Duncan TC: Statistical Issues in
Strudies of the Long-Term Effects of Air Pollution: The
Southern California Children's Health Study. Statistical Science
2004, 19(3):414-449.
Zhu Y, Eiguren-Fernandez A, Hinds WC, Miguel AH: In-cabin commuter exposure to ultrafine particles on Los Angeles freeways. Environ Sci Technol 2007, 41(7):2138-45.
Statistics-Sweden
[ />TableAndChart____23020.aspx]
Mannino DM, Buist AS: Global burden of COPD: risk factors,
prevalence, and future trends. Lancet 2007, 370(9589):765-73.
Lindbom J, Gustafsson M, Blomqvist G, Dahl A, Gudmundsson A, Swietlicki E, Ljungman AG: Wear particles generated from studded
tires and pavement induces inflammatory reactions in
mouse macrophage cells. Chem Res Toxicol 2007, 20(6):937-46.
Page 14 of 15
(page number not for citation purposes)
International Journal of Health Geographics 2009, 8:2
42.
43.
44.
/>
Gustafsson M, Blomqvist G, Gudmundsson A, Dahl A, Swietlicki E,
Bohgard M, Lindbom J, Ljungman A: Properties and toxicological
effects of particles from the interaction between tyres, road
pavement and winter traction material. Sci Total Environ 2008,
393(2–3):226-40.
Bayer-Oglesby L, Schindler C, Hazenkamp-von Arx ME, Braun-Fahrländer C, Keidel D, Rapp R, Künzli N, Braendli O, Burdet L, Sally Liu
LJ, Leuenberger P, Ackermann-Liebrich U, SAPALDIA Team: Living
near main streets and respiratory symptoms in adults: the
Swiss Cohort Study on Air Pollution and Lung Diseases in
Adults. Am J Epidemiol 2006, 164(12):1190-8.
Modig L, Forsberg B: Perceived annoyance and asthmatic
symptoms in relation to vehicle exhaust levels outside home:
a cross-sectional study. Environ Health 2007, 6(1):29.
Publish with Bio Med Central and every
scientist can read your work free of charge
"BioMed Central will be the most significant development for
disseminating the results of biomedical researc h in our lifetime."
Sir Paul Nurse, Cancer Research UK
Your research papers will be:
available free of charge to the entire biomedical community
peer reviewed and published immediately upon acceptance
cited in PubMed and archived on PubMed Central
yours — you keep the copyright
BioMedcentral
Submit your manuscript here:
/>
Page 15 of 15
(page number not for citation purposes)