Long-term Exposure to Traffic-related Air Pollution and Type 2 Diabetes Prevalence in a Cross-sectional Screening-study in the Netherlands pdf
Bạn đang xem bản rút gọn của tài liệu. Xem và tải ngay bản đầy đủ của tài liệu tại đây (985.25 KB, 9 trang )
RESEARCH Open Access
Long-term Exposure to Traffic-related Air
Pollution and Type 2 Diabetes Prevalence in a
Cross-sectional Screening-study in the
Netherlands
Marieke BA Dijkema
1,2*†
, Sanne F Mallant
1,3†
, Ulrike Gehring
2
, Katja van den Hurk
3
, Marjan Alssema
3
,
Rob T van Strien
1
, Paul H Fischer
4
, Giel Nijpels
3
, Coen DA Stehouwer
5
, Gerard Hoek
2
, Jacqueline M Dekker
3,6
and
Bert Brunekreef
2,7
Abstract
Background: Air pollution may promote type 2 diabetes by increasing adipose inflammation and insulin
resistance. This study examined the relation between long-term exposure to traffic-related air pollution and type 2
diabetes prevalence among 50- to 75-year-old subjects living in Westfriesland, the Netherlands.
Methods: Participants were recruited in a cross-sectional diabetes screening-study conducted between 1998 and
2000. Exposure to traffic-re lated air pollution was characterized at the participants’ home-address. Indicators of
exposure were land use regression modeled nitrogen dioxide (NO
2
) concentration, distance to the nearest main
road, traffic flow at the nearest main road and traffic in a 250 m circular buffer. Crude and age-, gender- and
neighborhood income adjusted associations were examined by logistic regression.
Results: 8,018 participants were included, of whom 619 (8%) subjects had type 2 diabetes. Smoothed plots of
exposure versus type 2 diabetes supported some association with traffic in a 250 m buffer (the highest three
quartiles compared to the lowest also showed increased prevalence, though non-significant and not increasing
with increasing quartile), but not with the other exposure metrics. Modeled NO
2
-concentration, distance to the
nearest main road and traffic flow at the nearest main road were not associated with diabetes. Exposure-response
relations seemed somewhat more pronounced for women than for men (non-significant).
Conclusions: We did not find consistent associations between type 2 diabetes prevalence and exposure to traffic-
related air pollution, though there were some indications for a relation with traffic in a 250 m buffer.
Keywords: 50-75 yrs, general population, long term, the Netherlands, traffic related air pollution, type 2 diabetes
Background
Many different factors are involved in the development
of type 2 diabetes. Genetic predisposition, excess caloric
intake and reduced physical activity are established and
well-known determinants [1]. It has recently been
hypothesized that long-term exposure t o traffic-related
air pollution might be an environmental risk factor for
type 2 diabetes [2-5].
Epidemiological studies havedemonstratedthatlong-
term exposure to traffic-related air pollution is asso-
ciated with an increased risk for cardiopulmonary mor-
bidity and mortality [6,7]. An hypothesis for the
biological mechanism underlying these associations is
that traffic-related air pollution triggers systemic oxida-
tive stress and inflammation in for instance endothelial
cells and macrophages [7,8]. These biological mechan-
isms are known to be involved in the d evelopment of
insulin resistance seen in type 2 diabetes [9,10].
* Correspondence:
† Contributed equally
1
Department of Environmental Health, Public Health Service Amsterdam,
Amsterdam, the Netherlands
Full list of author information is available at the end of the article
Dijkema et al. Environmental Health 2011, 10:76
/>© 2011 Dijkema et al; licensee BioMed Central Ltd. This is an Open Access article distributed under the terms of the Creative Commons
Attribution License (http://creati vecommons.org/licenses/by/2.0), which permits unrestricted use , distribution, and reproduction in
any medium, provid ed the original wor k is properly cited.
Consequently, it seems plausible that exposure to traffic-
related air pollution could also be a risk factor for type 2
diabetes, like environmental tobacco smoke is [11]. At
present, there is little data supporting this hypoth esis.
Recently, Sun et al. [4] demonstrated increased adiposity
inflammation and whole-body insulin resistance in mice
exposed to particulate matter air pollution. A study by
Kramer et al. [3] further supported the plausibility of
oxidative stress and inflammation as a biological
mechanism for the relation between air pollution and
type 2 diabetes, by showing that women with high C3c
blood levels (a marker for subclinical inflammation)
were more susceptible for particulate matter related
excess risk of diabetes than were women with low C3c
levels. That prospective study furthermore found a rela-
tion between traffic-related particulate matter and inci-
dent type 2 diabetes among elderly women in Germany
[3]. Another epidemiological study, by Brook et al. [2],
found an association between modeled NO
2
exposure
and type 2 diabetes prevale nce among female patients,
but not among male patients, of two respiratory health
clinics in Canada. In addition, a recent American study
found an association with distance to road among
women, while no strong evidence of an associ ation with
particulate matter exposure was observed [5].
The objective of th e present study was to examine the
relation between long-term exposure to traffic-related
air pollution at the home-address and type 2 diabetes
prevalence among subjects aged 50 to 75 years, living in
a semi-rural region of the Netherlands.
Methods
Study area and study population
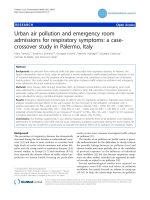
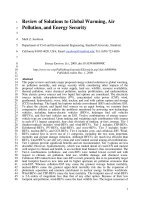
The s tudy was performed among residents of the semi-
rural area of Westfriesland in the North-West of t he
Netherlands (Figure 1). The study area comprised three
municipalities, consisting of seven towns and villages
(Enkhuizen, Bovenkarspel, Grootebroek, Lutjebroek,
Hoogkarspel, Westwoud and Oosterblokker). A large
proportion of the estimated surface of 56 km
2
is used
for agricultural activities, typically horticulture of tulips
and cauliflower. Residents often commute to work in
the area of Amsterdam, around 60 km away. No free-
ways are present in the study area. Two highways,
known as p rovincial roads in the Netherlands, with a
traffic flow of approximately 15,000 to 25,000 vehicles/
24 hrs, outline the North and South borders of the
study area and are connected with the nearest freeway,
located approximately 4 k m to the west of the study
area.
The study population has been described in more
detail elsewhere [12]. In brief, between 1998 and 2000,
all 50- to 75-year-old residents of the study area were
invited to participate in the Hoorn Screening Study for
type 2 diabe tes. A total of 11,679 inhabitants received
an invitation letter and the Symptom Risk Question-
nair e, a screening instrument for undetected type 2 dia-
betes, which contained nine questions about age,
gender, body length, body weight, family history of dia-
betes and health related problems like pain when walk-
ing or frequent thirstiness [13]. BMI was derived of data
on body length and -weight.
Of all r esponding participants (N = 8,153), 417 (5%)
reported previously doctor diagnosed diabetes. Partici-
pants with previously diagnosed diabetes were not
required to com plete the S ymp tom Risk Questionnaire
and were not screened further. For the remaining
7,736 participants, risk-sc ores were calculated from the
questionnaire. Pa rticipants with scores indicating a
high risk profile for undetected type 2 diabetes (n =
Figure 1 Study area and overview of specific location in the Netherlands. The study area consisted of three municipalities. Shown are the
seven towns or villages within these municipalities, the highways (provincial roads) adjacent to the area and the nearest freeway, which is
located to the west of the study area. The circle within the map of the Netherlands indicates were the study area is situated, the area marked in
black is the area the NO
2
-model was developed for.
Dijkema et al. Environmental Health 2011, 10:76
/>Page 2 of 9
3,301) were asked to engage in further testing based on
the 1999 World Health Organization guidelines for
diagnosis of type 2 diabetes [14]. Further testing com-
prised fasting capillary glucose measurements. Depend-
ing on t he outcomes of these capillary measurements,
a venous fasting plasma glucose sample was taken, fol-
lowed by either an oral glucose tolerance test or a sec-
ond fasting plasma glucose measurement. The
screening resulted in the diagnosis of 217 new cases of
type 2 diabetes. Consequently, the Hoorn Screening
Study population included 634 (8%) part icipants with
type 2 diabetes.
The Dutch Central Bureau for Statistics provided
additional population data on average monthly income
of all residents in 2004 at a six-position postcode area
level, which typically comprises about 20 dwellings.
Exposure
Exposure to traffic-related air pollution was character-
ized at each participant’s residential address at time of
recruitment. All addresses were geocoded by means of
the national GIS (Geographical Information System)
database ACN [15], which contains coordinates for all
home addresses in the Netherlands. Exposure to tr affic-
related air pollution was defined by four different vari-
ables that have been demo nstrated to be valid indicators
of exposure [16-19]: modeled NO
2
-concentration, dis-
tance to the nearest main road, traffic flow at the near-
est main road and traffic within a 250 m circular buffer.
NO
2
is considered an indicator of the complex mix of
various gaseous and particulate components originating
from both traffic combustion and wear of road and
vehicles.
NO
2
-concentrations at the home address were esti-
mated by means of a land use regression model for the
West of the Netherlands (Figure 1) that has been
described elsewhere [20]. In brief, during one week in
all four seasons of 2007, NO
2
-measurements were per-
formed using passive samplers at a total of 60 urban
traffic d ominated-, urban background- and rural back-
ground sites distributed over a large area (6,000 km
2
)in
the West of the Netherlands, of which the current study
area is part of. Traffic flow data were provided by all
national, provincial and municipal authorities in the
study area and were linked to a digital map of all road s
in the Netherlands (NWB), using GIS. Other land use
data were obtained fro m a European land use database
(CORINE). Supervised forward selection was used to
construct the land use regression model. The predictors
in the final model were: background NO
2
-concentration,
traffic volume at the nearest road, distance to the near-
est main road and residential land use in a 5 km circular
buffer. The cross-validation, adjusted, model R
2
was 82%
[20].
Furthermore, for each participants’ residential address,
other exposure indicators were derived from the traffic
data described above using GIS: distance to the nearest
main road (defined as a road with at least 5,000 vehi-
cles/24 hrs), traffic flow at the nearest main road (num-
ber of vehicles/24 hrs), and total traffic per 24 hours on
all roads within a 250 m circular buffer around the
address. All GIS calculations were conducted using
ArcInfo (ESRI, Redlands, CA).
Statistical analyses
Participants with missing values on exposure variables
and the covariates age, gender and income were
excluded from all analyses. We used penalized regres-
sion splines as implemented by Wood [21] in R ( GAM
procedure, mgcv-package of R version 2.8.0, R founda-
tion for Statistical Computing, Vienna, Austria) to
explore the functional relation between type 2 diabetes
prevalence and the exposure variables. Since associations
with type 2 diabetes seemed to be nonlinear, all expo-
sure variables were analyzed in quartiles. As this
approach may have resulted in ar bitrary intervals, which
were sometimes quite narrow, smooth plots of the asso-
ciation between exposure and type 2 diabetes resulting
from the GAM procedure were also presented for
reference.
Logistic regression analysis was used to exam ine asso-
ciations between type 2 diabetes prevalence and the dif-
ferent exposure variables. For each exposure variable,
thequartilewiththelowestlevelofexposurewascho-
sen as the reference category. Analyses were performed
with and without adjusting for a priori selected covari-
ates age (continuous), gender, and average monthly
income (continuous) as an indicator of neighborhood
socio-economic status. Individually available covariates
(gender, age and BMI) were also tested for effect modifi-
cation. Stratified analyses were done by gender. Nation-
ality was not adjusted for, as 99% of the population was
Dutch. Since participants who reported previously diag-
nosed diabetes (n = 417) we re not require d to complete
the Symptom Risk Questionnaire, data on BMI was
missing for 98 of these respondents. To be able to
include all patients in the main analyses, we decided not
to adjust for BMI in the main analyses, but to perform a
sensitivity analysis to explore the potential confounding
effect of BMI. In the sensitivity analysis we compared
the results of covariate-adjusted (all previously men-
tioned covariates with and without additional adjust-
ment for BMI) logistic regression analyses for the
subgroup of participants with non-missing information
on BMI. Additional sensitivity analysis was performed
for type of diagnosis (self-reported previously doctor
diagnosed and screening diagnosed), excluding partici-
pants with type 2 diabetes from the other diagnosis
Dijkema et al. Environmental Health 2011, 10:76
/>Page 3 of 9
group. For all exposure variables, odds ratios (OR) and
95% confidence intervals (95%-CI) are presented. All
analyses (besides the GAM analyses) were done with
SAS 9.2 (SAS Institute Inc., Cary, NC, USA).
Results
Participants living outside the study area (n = 2), partici-
pants for whom geocoding of the home-address was not
possible (due to a PO Box, boat or mail address, n = 11)
and participants with missing data on the covariates gen-
der, age and income (average monthly income, n = 118)
were excluded from the study. This resulted in a study
population of 8,018 participants, including 619 (8%) par-
ticipants with type 2 diabetes, 406 previously diagnosed
and 213 diag nosed in the Hoorn Screening Study. Forty-
nine percent o f the total population was male (Table 1)
and median age of the total population was 58 years. The
Box plots of the distribution of the exposure variables are
presented in Figure 2. More detailed information about
the distribution of the exposure variables and distribu-
tions for the participants with and without type 2 dia-
betes separately are presented in Additional File 1 Table
s1. Additional File 1 Table s1 also shows the distribut ion
of the predictors of the NO
2
model. For one address the
distance to the nearest busy road was outside the range
of the distances for the monitoring sites based on which
the model was developed (further away); all other predic-
tors were within range of the original database [20]. Cor-
relation between modeled NO
2
-concentration and
distance to the nearest main road was high (Spearman’s
r: -0.88). Distance to the nearest main road and traffic in
a 250 m buffer were also c orrelated (0.63), as were mod-
eled NO
2
-concentration and traffic in a 250 m buffer
(0.51). Traffic at the nearest main road was not correlated
to the other exposure variables (r<0.2).
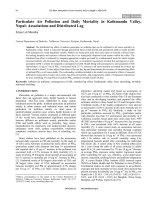
Crude and adjusted associations between type 2 dia-
betes prevalence and the four indicators of exposure are
shown in Additional File 1 Figure s1 (crude smooth
plots), Figure 2 (gender, age and neighborhood income
adjusted smooth plots) and Table 2 (exposure quartiles,
crude and adjusted). Both smoothing splines and ana-
lyses by exposure quartiles first show a slight increase in
prevalence of diabetes with increasing modeled NO
2
-
concentration; then, when roughly modeled NO
2
-con-
centrations exceeded the 75-percentile, the prevalence
decreased and fell below the prevalence at the lowest
modeled NO
2
-concentrations. Overall, association
between diabetes and modeled NO
2
-concentrations
seems to be absent and is even slightly suggestive of an
association counter to what was hypothesized.
The plots for distance to the nearest main road should
be looked at reversely (highest d istance means lowest
exposure). To give a more true representation of the
dispersion of air pollution from a road, the x-axis in the
plots (distance) furthermore have a log scale. The plots,
as well as the analyses per quartile, show an increasing
prevalence with decreasing distance up until approxi-
mately the median. From there on, prevalence of dia-
betes drops and roughly at the 75-percentile, was below
theprevalenceatthelargestdistance(Table2andFig-
ure 2). In some studies, distance to the nearest major
roadwasdichotomizedatcut-offsof100mor250m.
Table 1 Characteristics of the total population and of participants with and without type 2 diabetes.
Characteristic Total population Type 2 Diabetes
(Total)
Screening diagnosed Type 2 Diabetes No Type 2 Diabetes
(N = 8018) (N = 619) (n = 213) (N = 7399)
Gender (male) 3,949 (49%) 330 (53%) 111 (52%) 3,619 (49%)
Age (years)
50-55 2,753 (34%) 96 (16%) 28 (13%) 2,657 (36%)
55-60 1,795 (22%) 110 (18%) 38 (18%) 1,685 (23%)
60-65 1,446 (18%) 122 (20%) 45 (21%) 1,324 (18%)
≥ 65 2,024 (25%) 291 (47%) 102 (48%) 1,733 (24%)
BMI (kg·m
-2
)
< 18.5 51 (1%) 3 (1%) 1 (1%) 48 (1%)
18.5-25.0 3,632 (45%) 130 (21%) 34 (16%) 3502 (47%)
25.0-30.0 3,344 (42%) 243 (39%) 108 (51%) 3101 (42%)
≥ 30.0 893 (11%) 145 (23%) 70 (33%) 748 (10%)
missing 98 (1%) 98 (16%) - -
Average monthly income (€) 1,903 (417) 1,804 (407) 1,831 (464) 1,912 (417)
Total subjects with diabetes 619 (8%) 619 (100%) 213 (100%) -
Subjects with pre-diagnosed diabetes 406 (5%) 406 (66%) - -
Data are number (%) or mean (sd).
Dijkema et al. Environmental Health 2011, 10:76
/>Page 4 of 9
In the present study, the age, gender and income
adjusted OR for diabetes when living within 250 m of a
main road was 1.09 (95%CI: 0.87-1.36) relative to those
living further away. For living within 100 m this was
0.88 (0.74-1.05).
For traffic flow at the nearest main r oad, no associa-
tion was seen with diabetes prevalence. Traffic in a 250
m buffer, however, suggested some (statistically non-sig-
nificant) increased diabetes prevalence for the higher
exposures (roughly the upper three quartiles) although
again prevalence decreases among the highest exposed.
Comparison of crude and adjusted models (Table 2
also Figure 2 vs. Additional File 1 Figure s1) demon-
strates that inclusion of covariates in the adjusted models
had little influence on the ORs and 95%-CIs. Additional
adjustment for community did not change the results
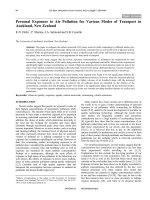
either (data not shown). Previous studies [2,3,5] suggest
that gender could be an effect modifier, therefore ana-
lyses were stratified by gender (Figure 3). Pat terns
observed in the total population and described above
seemed more pronounced among women than among
men (also see Additional File 1 Figure s2). Statistically
significantly increased odds were observed for modeled
NO
2
and traffic in a 250 m buffer (third quartile; 1.48
(1.07-2.04) and 1.4 4 (1.01-2.05), respectively). In regres-
sion analysis with exposure-gender interaction terms,
however, the interaction was not statistically significant.
Sensitivity analyses were done to examine the poten-
tial confounding effect of BMI (Additional File 1 Table
s2). In these analyses all participants with missing data
Figure 2 Smooth adjusted associations (OR and 95%-CI) between exposure variables and type 2 diabetes prevalence. Box plots on the
x-axis present distribution of exposure variables.
Table 2 Association between exposure variables and type
2 diabetes prevalence: Odds Ratios with 95%-CI
Exposure Metric (Q:quartile) Crude
a
Adjusted
b
NO2-concentration (µg·m
-3
)
Q1: 8.8-14.2 reference Reference
Q2: 14.2-15.2 0.98 (0.78-1.23) 1.03 (0.82-1.31)
Q3: 15.2-16.5 1.17 (0.94-1.45) 1.25 (0.99-1.56)
Q4: 16.5-36.0 0.80 (0.63-1.01) 0.80 (0.63-1.02)
Distance to nearest main road (m)
Q1: 220-1610 reference reference
Q2: 140-220 1.10 (0.87-1.39) 1.12 (0.88-1.42)
Q3: 74-140 1.22 (0.97-1.53) 1.17 (0.93-1.48)
Q4: 2-74 0.94 (0.74-1.19) 0.88 (0.70-1.13)
Traffic flow at nearest main road (veh·24 hrs
-1
)
Q1: 5001-5871 reference reference
Q2: 5871-7306 1.09 (0.87-1.39) 1.02 (0.81-1.29)
Q3: 7306-9670 0.98 (0.78-1.23) 1.03 (0.81-1.30)
Q4: 9670-35567 0.91 (0.72-1.16) 0.96 (0.75-1.22)
Traffic in 250 m buffer (10
3
veh·24 hrs
-1
)
Q1: 63-516 reference reference
Q2: 516-680 1.28 (1.01-1.61) 1.25 (0.99-1.59)
Q3: 680-882 1.15 (0.91-1.46) 1.13 (0.89-1.44)
Q4: 882-2007 1.13 (0.89-1.44) 1.09 (0.85-1.38)
a
Crude model: not adjusted for any of the selected covariates.
b
Adjusted model: adjusted for average monthly income, age (continuous) and
gender.
Dijkema et al. Environmental Health 2011, 10:76
/>Page 5 of 9
on BMI (n = 98), all of which had pre viously dia gnosed
diabetes, were e xcluded. Crude and adjusted analyses
showed slightly higher ORs and wider 95%-CIs than in
the total population (Table 2). Additional adjustment for
BMI did not affect exposure-response patterns to a great
extent. We therefore co ncluded that BMI was not an
important confounder for the association betwee n traffic
related air pollution and diabetes prevalence in this
population. We furthermore tested for effect m odifica-
tion, regression analysis with exposure-BMI interaction
terms, did not show statistically significant interaction.
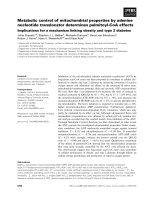
We also performed sensitivity analyses for the differ-
ent types of diagnosis (self-reported previously doctor
diagnosed vs. diagnosed by the extensive screening in
this study, Figure 4), showing that the participants with
screening diagnosed diabetes contribut e importantly to
the findings of this study.
Discussion
In this study, smooth plots of exposure versus type 2 dia-
betes risk supported some association with traffic in a
250 m buffer. The prevalence of diabetes was (non-signif-
icantly) increased in the highest three quartiles compared
to the lowest quartile, but did not increase with increas-
ing quartile. Modeled NO
2
-concentration, distance to the
nearest main road and traffic flow at the nearest main
road were not associated with diabetes. Associations
seemed to be stronger for women compared to men.
Exposure in the study area
TheareainwhichtheHoornScreeningStudywascon-
ducted has a relatively low level of air pollution, as
documented with low NO
2
-concentrations, and small
exposure contrasts. Doing studies in areas with low expo-
sures and small contrasts has advantages and disadvan-
tages. One important aspect of such studies is that
knowledge of possible health effects of air pollution at con-
centrations below current standards could be gained. A
disadvantage is the potentially low study power. The latter
may have limited our ability to detect a consistent associa-
tion with traffic-related air pollution. Sin ce other studies [e.
g.[22]]observedeffectsinareaswithlowexposureand
limited contrast, an d several studies h av e shown largely l in-
ear associations between air pollution and i.e. c ardi opul-
monary mortali ty [e.g. [23]], we considered explora tion of a
possible association in this s tudy area to be worthwhile.
The limited ranges of exposure to traffic flow at the
nearest main road and NO
2
-concentration could have
contributed to inconsistent findings. For instance, the
interquartile range for NO
2
-exposure in this study was
only 2.3 μg/m
3
, while in previous studies on air pollu-
tion and type 2 diabetes [2,3] this ranged from 5.8 to
15.0 μg/m
3
. The relatively long tails at both ends of the
exposure range, may furthermore have contributed to
the absence of an exposure-response relation in this
study: the range of exposure within the highest exposed
quartile for NO
2
(16.5-36.0 μg/m
3
) was much larger
than the interquartile range. As shown in Figure 2, how-
ever, analysis exploiting the full contr ast shows no
increased odds with increased NO
2
-concentration either.
Exposure-effect relation
In the present study, associations for different indicators
of air pollution did not show consistent results. Whereas
Figure 3 Analyses stratified by gender. Shown are ORs and 95%-CIs following from analyses adjusted for age and income.
Dijkema et al. Environmental Health 2011, 10:76
/>Page 6 of 9
increased exposure as measured by traffic in a 250 m
circular buffer was associ ated with slightly increased
odds for type 2 diabetes, this pattern was less clear for
distance to the nearest main road and modeled NO
2
-
concentration and absent for traffic flow at the nearest
main road. However, different associations for different
exposure metrics were als o observed in a cohort study
on cardiovascular mortality in the Netherlands [17]. The
exposure-response pattern for NO
2
-concentration and
distance to the nearest main road in this study was simi-
lar, most likely due to the high correlation between the
two variables. Distance to the nearest main road is a
metric being increasingly used in policy pra ctice, mod-
eled NO
2
-concentration, however, is probably a more
precise metric of exposure to traffic related air pollution.
Potential misclassification of exposure
Exposure was characterized at the home-address.
Despite high correlation between outdoor exposure at
the home-address and overall exposure to traffic-related
air pollution [19], personal differences in exposure,
caused by, for instance, occupa tional or commuting
exposure could have resulte d in exposure misclassifica-
tion. In addition, it is unknown for what time period
participants had resided in the study area at th e time of
enrollment. Residential mobility among elderly persons
in the Netherlands, however, tends to be low [24,25]
and therefore we believe that estimated exposures in the
present study represent long-term exposures of the
study p articipants. Exposure and participant data were
furthermore obtained at different moments in time. As
the study area is a stable environment where no major
modifications in housing or the road network have
occurred in the past twenty years, we do not think that
spatial variation of exposure has changed much over
time. Recent studies showed reasonable long-term valid-
ity of land use regression models [26,27]. Indicators
such as distance to the nearest main road may be e ven
more stable over time than air pollution concentrations.
As exposure was characterized at the geocoded home-
address, spatial error in the database that was used for
geocoding may have contributed to exposure misclassifi-
cation. Geocoding was done with ACN, of which the
accuracy is high (93.5% located at centroid of the cor-
rect building, 6.0% at the centroid of the correct parcel
[28]). We therefore believe that misclassification of
exposure due to spatial error in the geo coded home-
address, if any, is small.
Study design
Ideally, epidemiological studies on the health effect of
environmental exposures such as air pollution are con-
ducted in a prospective cohort design. In order to stud y
conditions such as type 2 diabetes in a cohort with suffi-
cient power, a long follow-up time is needed and the
size of the cohort has to be substantial. Since this is
very time-consuming and costly, cross-se ctional studies,
such as the Hoorn Screening Study, can contribute to
the understanding of such associations considerably in
absence of cohort studies.
The Hoorn Screening Study is a cross-sectional study
among a representative study population and the preva-
lenceofdiabetesiswell-described. In questionnaire
based studies, selection bias may be of importance. In
the Hoorn Screening Study, selection bias was mini-
mized by inviting all 50- to 75-year-old inhabitants of
the study area to participate and non-response was low
(20%) [12]. In general, type 2 diabetes remains
Figure 4 Analyses stratified by type of diagnosis. Shown are ORs and 95%-CIs following from analyses adjusted for age, gender and income.
Dots are representing the ORs for self-reported previously doctor diagnosed diabetes (N = 7,805), triangles represent screening diagnosed
diabetes (N = 7,612).
Dijkema et al. Environmental Health 2011, 10:76
/>Page 7 of 9
undiagnosed in up to 30-55% of the cases. A strength of
the present study is that many of these undiagnosed
patients were detected [12]. About one third of the
patients with type 2 diabetes in this study were diag-
nosed by the extensive screening procedure. Sensitivity
analyses for type of diagnosis (self-reported vs. screen-
detected, Figure 4) shows that the screening detected
patients with type 2 diabetes contributed importantly to
the findings of this study, a finding which may be of
importance for setting up future studies. As subjects
diagnosed in the screening were un aware of their dis-
ease, bias in especially this group seems unlikely.
Although some misclassification might have occurred in
the group of self-reported patients with type 2 diabetes,
it is unlikely t hat this is related to exposure. This mis-
classification would therefore probably result in less pro-
nounced effects, if any.
Confounding and effect modification
Comparison of crude and adjusted models indicated lit-
tle confounding of the relation b etween type 2 diabetes
and exposure variables. We cannot rule out residual
confounding by other unmeasured factors such as life-
style, personal socio-economic status, etc. For example,
no data were availa ble on smoking status or prior cardi-
ovascular disease, which are important risk factors for
type 2 diabetes. In the three published epidemiological
studies exploring the relation between traffi c-related air
pollution and diabetes, Brook et al. [2] adjusted for the
samefactorsasinourstudy,whereasKrämeretal.[3]
and Puett et al. [5] had more detailed individual infor-
mation available. Neither of these studies however indi-
cated those characteristics to be important confounder s
in the ass ociation between diabetes and air pollution. In
several studies on cardiopulmonar y health [ 29-31], it
also seemed that adjustment for important risk factors
such as smoking, had little influence on the relation
between cardiopulmonary health and traffic-related air
pollution. Thi s is consistent with our findings, in which
adjustment for gender, age and an indicator of socio-
economic status (neighborhood average inc ome) indi-
catedthatthesewerenotconfounders for the relation
with traffic-related air pollution. Sensitivity analyses on
the potential confounding effect of BMI showed further-
more no indication of confounding by BMI in this
population (Additional File 1 Table s2, Model III vs.
Model II) although residual confounding cannot com-
pletely be ruled out.
Krämer et al. [3] showed associations between traffic-
related air pollution and i ncident type 2 diabetes among
elderly women in a prospective study. For NO
2
,the
adjusted relative risk (RR) was 1.42 (95%-CI: 1.16-1.73)
per 19 μg/m
3
. Brook et al. [2] demonstrated a relation
between modeled NO
2
-concentration and t ype 2
diabetes prevalence among women (OR 1.04 (1.00-1.08)
per ppb), but not among men. Puett et al. [5] observed
an increased hazard ratio of 1.14 (1.03-1.27) for living
less than 50 m versus ≥200 m from a roadway among
women. In our study, patterns observed in the full
population seemed to be more pronounced among
women, which is consistent with the studies by Brook,
Puett and Krämer. In regression analysis, however, no
statistically significant interaction by gender was shown.
Among the potential explanations for a possible differ-
ence between men and women i s accuracy of exposure
estimation, which may be more accurat e in women than
in men. The women in this population are of a genera-
tion in which working outside of the home was rare. At
the time of screening, women in this study therefore
were more likely to have spent more time at home than
men. Furthermore, susceptibility may differ between
women and men.
Conclusion
This stu dy did not find consistent associations between
type 2 diabetes prevalence and exposure to traffic
related air pollution, though there were some indications
for a relation with traffic in a 250 m buffer. Our study
adds to the limited number of studies on air pollution
as a risk factor for type 2 diabetes [2-5]. In contrast
with previous epidemiological studies [2,3,5] we did not
find consistent associations, though despite the limit ed
level of exposure in the population studied, some indica-
tions for a relation were observed.
Additional material
Additional file 1 Table s1: Supplemental Material dijkema diabetes.
List of abbreviations
95%-CI: 95% confidence interval; BMI: body mass index; GIS: geographical
information system; NO
2
: nitrogen dioxide; OR: odds ratio; RR: relative risk.
Acknowledgements
Financial support for this study was granted by the Netherlands
Organization for Health Research and Development (ZonMW). Ulrike Gehring
was supported by a research fellowship of the Netherlands Organisation for
Scientific Research (NWO). We thank Annemieke Spijkerman of the Center
for Prevention and Health Services Research, National Institute for Public
Health and the Environment, Bilthoven, the Netherlands, and Marcel
Adriaanse of the Department of Health Sciences and EMGO Institute for
Health and Care Research, VU University Amsterdam, the Netherlands, for
their work on the Hoorn Screening Study.
Author details
1
Department of Environmental Health, Public Health Service Amsterdam,
Amsterdam, the Netherlands.
2
Institute for Risk Assessment Sciences, Utrecht
University, Utrecht, the Netherlands.
3
EMGO Institute for Health and Care
Research, VU University Medical Center, Amsterdam, the Netherlands.
4
Centre for Environmental Health Research, National Institute for Public
Health and the Environment (RIVM), Bilthoven, the Netherlands.
5
Department
of Internal Medicine and Cardiovascular Research Institute Maastricht,
Dijkema et al. Environmental Health 2011, 10:76
/>Page 8 of 9
Maastricht University Medical Centre, Maastricht, the Netherlands.
6
Department of Epidemiology and Biostatistics, VU University Medical Center,
Amsterdam, the Netherlands.
7
Julius Center for Health Sciences and Primary
Care, University Medical Center Utrecht, Utrecht, the Netherlands.
Authors’ contributions
MD, SM, UG, JD and BB substantially contributed to conception and design
of the study, acquisition, analysis and interpretation of data; drafted and
revised the article and approved the final version. KvdH, MA, RvS, GH
substantially contributed to design and interpretation of data, revised the
article critically and approved the final version. PF, GN, CS substantially
contributed to acquisition of data, revised the article and approved of the
final version.
Competing interests
The authors declare that they have no competing interests.
Received: 10 June 2011 Accepted: 5 September 2011
Published: 5 September 2011
References
1. Orozco LJ, Buchleitner AM, Gimenez-Perez G, Roque IF, Richter B,
Mauricio D: Exercise or exercise and diet for preventing type 2 diabetes
mellitus. Cochrane Database Syst Rev 2008, CD003054.
2. Brook RD, Jerrett M, Brook JR, Bard RL, Finkelstein MM: The relationship
between diabetes mellitus and traffic-related air pollution. J Occup
Environ Med 2008, 50:32-38.
3. Krämer U, Herder C, Sugiri D, Strassburger K, Schikowski T, Ranft U,
Rathmann W: Traffic-related air pollution and incident type 2 diabetes:
results from the SALIA cohort study. Environ Health Perspect 2010.
4. Sun Q, Yue P, Deiuliis JA, Lumeng CN, Kampfrath T, Mikolaj MB, Cai Y,
Ostrowski MC, Lu B, Parthasarathy S, Brook RD, Moffatt-Bruce SD, Chen LC,
Rajagopalan S: Ambient air pollution exaggerates adipose inflammation
and insulin resistance in a mouse model of diet-induced obesity.
Circulation 2009, 119:538-546.
5. Puett RC, Hart JE, Schwartz J, Hu FB, Liese AD, Laden F: Are Particulate
Matter Exposures Associated with Risk of Type 2 Diabetes? Environ
Health Perspect 2010.
6. Brunekreef B, Holgate ST: Air pollution and health. Lancet 2002,
360:1233-1242.
7. Pope CA, Dockery DW: Health effects of fine particulate air pollution:
lines that connect. J Air Waste Manag Assoc 2006, 56:709-742.
8. Mills NL, Donaldson K, Hadoke PW, Boon NA, MacNee W, Cassee FR,
Sandstrom T, Blomberg A, Newby DE: Adverse cardiovascular effects of air
pollution. Nat Clin Pract Cardiovasc Med 2009, 6:36-44.
9. Evans JL, Goldfine ID, Maddux BA, Grodsky GM: Oxidative stress and
stress-activated signaling pathways: a unifying hypothesis of type 2
diabetes. Endocr Rev 2002, 23:599-622.
10. Pradhan AD, Manson JE, Rifai N, Buring JE, Ridker PM: C-reactive protein,
interleukin 6, and risk of developing type 2 diabetes mellitus. JAMA
2001, 286:327-334.
11. Ko K-P, Min H, Ahn Y, Park S-J, Kim C-S, Park JK, Kim SS: A Prospective
Study Investigating the Association Between Environmental Tobacco
Smoke Exposure and the Incidence of Type 2 Diabetes in Never
Smokers. Ann Epidemiol 2011, 42-47.
12. Spijkerman AM, Adriaanse MC, Dekker JM, Nijpels G, Stehouwer CD,
Bouter LM, Heine RJ: Diabetic patients detected by population-based
stepwise screening already have a diabetic cardiovascular risk profile.
Diabetes Care 2002, 25:1784-1789.
13. Ruige JB, de Neeling JN, Kostense PJ, Bouter LM, Heine RJ: Performance of
an NIDDM screening questionnaire based on symptoms and risk factors.
Diabetes Care 1997, 20:491-496.
14. World Health Organisation: Definition and diagnosis of diabetes mellitus
and intermediate hyperglycemia: report of a WHO/IDF consultation.
Geneva, World Health Organisation; 2006.
15. Kadaster: Adres Coordinaten Nederland (ACN) 2005. Apeldoorn, the
Netherlands, Kadaster; 2005.
16. Beckerman B, Jerrett M, Brook JR, Verma DK, Arain MA, Finkelstein MM:
Correlation of nitrogen dioxide with other traffic pollutants near a major
expressway. Atmos Environ 2008,
42:275-290.
17. Beelen R, Hoek G, van den Brandt PA, Goldbohm RA, Fischer P,
Schouten LJ, Jerrett M, Hughes E, Armstrong B, Brunekreef B: Long-term
effects of traffic-related air pollution on mortality in a Dutch cohort
(NLCS-AIR study). Environ Health Perspect 2008, 116:196-202.
18. Gilbert NL, Woodhouse S, Stieb DM, Brook JR: Ambient nitrogen dioxide
and distance from a major highway. Sci Total Environ 2003, 312:43-46.
19. Janssen NA, Van Vliet P, Aarts F, Harssema H, Brunekreef B: Assessment of
exposure to traffic related air pollution of children attending schools
near motorways. Atmospheric Environment 2001, 35:3875-3884.
20. Dijkema MBA, Gehring U, van Strien RT, van der Zee SC, Fischer P, Hoek G,
Brunekreef B: A Comparison of Different Approaches to Estimate Small
Scale Spatial Variation in Outdoor NO2 Concentrations. Environ Health
Perspect 2011.
21. Wood SN, Augustin NH: GAMs with integrated model selection using
penalized regression splines and applications to environmental
modelling. Ecological Modelling 2002, 157:157-177.
22. Gan WQ, Koehoorn M, Davies HW, Demers PA, Tamburic L, Brauer M: Long-
Term Exposure to Traffic-Related Air Pollution and the Risk of Coronary
Heart Disease Hospitalization and Mortality. Environ Health Perspect 2010.
23. Pope CA, Burnett RT, Thun MJ, Calle EE, Krewski D, Ito K, Thurston GD: Lung
cancer, cardiopulmonary mortality, and long-term exposure to fine
particulate air pollution. JAMA 2002, 287:1132-1141.
24. Beelen R, Hoek G, van den Brandt PA, Goldbohm RA, Fischer P,
Schouten LJ, Armstrong B, Brunekreef B: Long-term exposure to traffic-
related air pollution and lung cancer risk. Epidemiology 2008, 19:702-710.
25. Hoek G, Brunekreef B, Goldbohm S, Fischer P, van den Brandt PA:
Association between mortality and indicators of traffic-related air
pollution in the Netherlands: a cohort study. Lancet 2002, 360:1203-1209.
26. Madsen C, Gehring U, Haberg SE, Nafstad P, Meliefste K, Nystad W, Lodrup
Carlsen KC, Brunekreef B: Comparison of land-use regression models for
predicting spatial NOx contrasts over a three year period in Oslo,
Norway. Atmospheric Environment 2011, 45:3576-3583.
27. Eeftens M, Beelen R, Fischer P, Brunekreef B, Meliefste K, Hoek G: Stability
of measured and modelled spatial contrasts in NO2 over time. Occup
Environ Med 2011.
28. Kadata: Address Coordinates Netherlands (ACN) - Quality survey 2000
[Adres Coordinaten Nederland (ACN) - Kwaliteitsonderzoek 2000].
Apeldoorn, the Netherlands 2001.
29. Peters A, Pope CA III: Cardiopulmonary mortality and air pollution. Lancet
2002, 360:1184-1185.
30. Hoffmann B, Moebus S, Mohlenkamp S, Stang A, Lehmann N, Dragano N,
Schmermund A, Memmesheimer M, Mann K, Erbel R, Jockel KH: Residential
Exposure to Traffic Is Associated With Coronary Atherosclerosis.
Circulation 2007, 116:489-496.
31. Kan H, Heiss G, Rose KM, Whitsel EA, Lurmann F, London SJ: Prospective
analysis of traffic exposure as a risk factor for incident coronary heart
disease: the Atherosclerosis Risk in Communities (ARIC) study. Environ
Health Perspect 2008, 116:1463-1468.
doi:10.1186/1476-069X-10-76
Cite this article as: Dijkema et al.: Long-term Exposur e to Traffic-related
Air Pollution and Type 2 Diabetes Prevalence in a Cross-sectional
Screening-study in the Netherlands. Environmental Health 2011 10:76.
Submit your next manuscript to BioMed Central
and take full advantage of:
• Convenient online submission
• Thorough peer review
• No space constraints or color figure charges
• Immediate publication on acceptance
• Inclusion in PubMed, CAS, Scopus and Google Scholar
• Research which is freely available for redistribution
Submit your manuscript at
www.biomedcentral.com/submit
Dijkema et al. Environmental Health 2011, 10:76
/>Page 9 of 9