Ambient particulate air pollution induces oxidative stress and alterations of mitochondria and gene expression in brown and white adipose tissues ppt
Bạn đang xem bản rút gọn của tài liệu. Xem và tải ngay bản đầy đủ của tài liệu tại đây (2.46 MB, 14 trang )
Xu et al. Particle and Fibre Toxicology 2011, 8:20
/>
RESEARCH
Open Access
Ambient particulate air pollution induces
oxidative stress and alterations of mitochondria
and gene expression in brown and white adipose
tissues
Zhaobin Xu1,2, Xiaohua Xu2, Mianhua Zhong3, Ian P Hotchkiss4, Ryan P Lewandowski4, James G Wagner4,
Lori A Bramble4, Yifeng Yang1, Aixia Wang5, Jack R Harkema4, Morton Lippmann3, Sanjay Rajagopalan5,6,
Lung-Chi Chen3* and Qinghua Sun2,5,6*
Abstract
Background: Prior studies have demonstrated a link between air pollution and metabolic diseases such as type II
diabetes. Changes in adipose tissue and its mitochondrial content/function are closely associated with the
development of insulin resistance and attendant metabolic complications. We investigated changes in adipose
tissue structure and function in brown and white adipose depots in response to chronic ambient air pollutant
exposure in a rodent model.
Methods: Male ApoE knockout (ApoE-/-) mice inhaled concentrated fine ambient PM (PM < 2.5 μm in
aerodynamic diameter; PM2.5) or filtered air (FA) for 6 hours/day, 5 days/week, for 2 months. We examined
superoxide production by dihydroethidium staining; inflammatory responses by immunohistochemistry; and
changes in white and brown adipocyte-specific gene profiles by real-time PCR and mitochondria by transmission
electron microscopy in response to PM2.5 exposure in different adipose depots of ApoE-/- mice to understand
responses to chronic inhalational stimuli.
Results: Exposure to PM2.5 induced an increase in the production of reactive oxygen species (ROS) in brown
adipose depots. Additionally, exposure to PM2.5 decreased expression of uncoupling protein 1 in brown adipose
tissue as measured by immunohistochemistry and Western blot. Mitochondrial number was significantly reduced in
white (WAT) and brown adipose tissues (BAT), while mitochondrial size was also reduced in BAT. In BAT, PM2.5
exposure down-regulated brown adipocyte-specific genes, while white adipocyte-specific genes were differentially
up-regulated.
Conclusions: PM2.5 exposure triggers oxidative stress in BAT, and results in key alterations in mitochondrial gene
expression and mitochondrial alterations that are pronounced in BAT. We postulate that exposure to PM2.5 may
induce imbalance between white and brown adipose tissue functionality and thereby predispose to metabolic
dysfunction.
Keywords: air pollution, mitochondria, adipose, oxidative stress, inflammation
* Correspondence: ;
2
Division of Environmental Health Sciences, College of Public Health, The
Ohio State University, Columbus, Ohio, USA
3
The Department of Environmental Medicine, New York University School of
Medicine, Tuxedo, New York, USA
Full list of author information is available at the end of the article
© 2011 Xu et al; licensee BioMed Central Ltd. This is an Open Access article distributed under the terms of the Creative Commons
Attribution License ( which permits unrestricted use, distribution, and reproduction in
any medium, provided the original work is properly cited.
Xu et al. Particle and Fibre Toxicology 2011, 8:20
/>
Background
Since air pollution has a major impact on public health for
the general population, its health effects have been intensively investigated in recent years. Airborne particulate
matter (PM) is a complex mixture of chemical and/or biological elements, composed of solid and liquid components that originate from vehicle exhaust, road dust,
power plant stacks, forest fires, windblown soil, etc. In particular, airborne fine particulate matter (PM < 2.5 μm in
aerodynamic diameter, PM 2.5), i.e., PM in the fine and
ultrafine ranges, has been implicated in the pathogenesis
of cardiovascular disease and lung cancer [1-3].
Adipose tissue is now recognized as not only an
energy reservoir for lipid storage, but also an active
endocrine organ and an important regulator in glucose
homeostasis. Adipose tissues are major actors in both
obesity and the emergence of a cluster of associated diseases such as insulin resistance, type 2 diabetes mellitus
(T2DM), cardiovascular diseases, and hypertension.
There are at least two distinct types of adipose cells,
white and brown adipocytes, with opposing effects on
energy balance and body weight regulation. White adipose tissue (WAT) is highly adapted to store any excess
energy as triglycerides, while brown adipose tissue
(BAT), on the other hand, functions to dissipate chemical energy in the form of heat. Recently, A series of
investigations have demonstrated that brown and white
adipocytes are not sister cells, but rather that brown adipocytes are closely related to myocytes, and both originate from a common “adipomyocyte” precursor [4,5].
Among classical white adipocytes, two types may exist:
the “genuine” white adipocytes, and “brite” (brown-inwhite) adipocytes. Although “brite” cells do not possess
the molecular characteristics of brown adipocytes, they
possess the ability to express the uncoupling protein 1
(UCP1), which could mediate heat generation in brown
fat uncoupling the respiratory chain and allow for fast
substrate oxidation with a low rate of ATP production
[6]. Moreover, brown adipose gene expression could be
stimulated when mice are maintained at thermoneutrality and under conditions of cold acclimation [7,8].
Mitochondria play a key role in physiological process
and are involved in the pathology of many diseases. Little is known about the physiological relevance of mitochondria in adipose tissue. It has been reported by
Choo et al [9] that mitochondrial content and function
in adipose tissue were reduced in the epididymal fat of
type 2 diabetic mice, indicating a potential role for the
disruption of adipose tissue mitochondrial content and
function in T2DM. Previous studies have shown that
fine particulate air pollution inhalation leads to insulin
resistance, oxidative stress, alteration of vasomotor tone,
vascular and visceral inflammation, adiposity, and
Page 2 of 14
atherosclerosis in apolipoprotein E knockout (ApoE-/-)
mice and other several mouse models [10-14]. The
ApoE -/- mouse is particularly popular in research
because of its propensity to spontaneously develop
atherosclerotic lesions on a standard chow diet. It is
used for studies of hyperlipidemia and atherosclerosis,
and has been used extensively in understanding the
mechanisms of lipoprotein metabolism and atherosclerosis. The ApoE-/- mice are generated on a C57BL/6
background, and this model is highly susceptible to cardiovascular disease, overweight, insulin resistance, and
the development of metabolic syndrome [10,13,15].
Although reports show that the function and expression
of different adipose genes in white and brown adipose
tissues [16,17], to our knowledge no study has investigated the impact of ambient air pollutants simultaneously in various of adipose depots. Therefore, the
purpose of this study was to examine changes in white
and/or brown adipose tissues in response to PM 2.5
exposure in ApoE -/- mice. We evaluated the role of
PM 2.5 exposure in inflammatory response, superoxide
production, and alterations of mitochondria. Due to the
functional differences in WAT and BAT including their
vascularity, we hypothesized that PM2.5 exposure may
have differential effects on these adipose depots. Thus,
we systematically investigated the gene expression patterns in five different defined adipose depots: interscapular BAT (iBAT), mediastinic BAT (mBAT), inguinal
WAT (iWAT), retro-peritoneal WAT (rWAT), and epididymal WAT (eWAT) [18,19] in response to PM 2.5
exposure.
Methods
Animals
Four-week-old male ApoE-/- mice from Jackson Laboratory (Bar Harbor, ME) were housed at constant temperature (22 ± 2°C) on a 12-h light/dark cycle. They
were fed ad libitum on standard laboratory mouse chow
and had free access to water. The investigation conforms to the Guide for the Care and Use of Laboratory
Animals published by the US National Institutes of
Health (NIH Publication No. 85-23, revised 1996), and
the study protocols were approved by the Institutional
Animal Care and Use Committee of Michigan State
University and The Ohio State University under protocol #2008A006-R1.
Exposure to ambient PM2.5
Animals were exposed to concentrated ambient PM2.5 or
filtered air (FA) for 6 hours/day, 5 days/week for a total
duration of 2 months in East Lansing, MI from June 7,
2010 to August 6, 2010. The concentrated PM2.5 in the
exposure chamber was generated using a versatile aerosol
Xu et al. Particle and Fibre Toxicology 2011, 8:20
/>
concentration enrichment system (VACES) [10]. Inhalation exposures were conducted in one of Michigan State
University’s mobile air research laboratories (AirCARE 1)
[20]. This laboratory is a 53-ft long, 36,000 pound semitrailer with approximately 450 ft2 of interior laboratory
floor space. Workspace within AirCARE 1 is divided into
three work areas for: (1) atmospheric monitoring; (2)
inhalation exposure systems for laboratory animals (rats
or mice); and (3) biomedical laboratory for laboratory
rodent anesthesia, surgery and necropsy, and sample storage. AirCARE 1 is certified by the Association for
Assessment and Accreditation of Laboratory Animal
Care (AAALAC). For the present study, AirCARE 1 was
located on a Michigan State University research farm
approximately 1 mile south of the main campus. The site
is located over 1000 ft from a medium traffic roadway
and 1,500 ft south of a lightly trafficked CSX railway.
One interstate highway is located 2 miles south (I-96)
and another 2 miles west (I-496) of the site, both of
which carry over 25,000 vehicles daily. Michigan State
University is located in East Lansing, MI (pop 46,420) in
northern Ingham County, and is part of the Lansing
Metropolitan Area (pop 453,603). Major emissions
sources that could impact the exposure site are the T.B.
Simon Power Plant, a 61 megawatt (MW) coal-burning
facility located 1.2 miles northwest of the site. The Simon
plant emits over 3,000 tons of SO 2 and 1,300 tons of
NOx annually. In downtown Lansing, approximately 4.5
miles west of the site is a 351MW coal burning power
plant (Otto Eckert Station). The Lansing area also has a
number of medium to light industries including automotive assembly plants (General Motors), steel (welding and
fabricating) and metal processing facilities. Located in
mid-Michigan, the site is also affected by regional emission sources in the Midwest, notably from the metropolitan Chicago area, industrial activities along Lake
Michigan (e.g., Gary, IN), and coal burning power plants
in the Ohio River Valley.
Energy-Dispersive X-Ray Fluorescence (ED-XRF)
All PM samples for gravimetric and elemental analyses
were collected on filters. Filter masses were measured
on a microbalance (model MT5, Mettler-Toledo Inc.,
Highstown, NJ). Chemical composition was analyzed as
described elsewhere [12,21].
Dihydroethidium (DHE) staining
DHE (Invitrogen, Carlsbad, CA), an oxidative fluorescent
dye, was used to detect superoxide (O2-), which binds to
DNA in the nucleus and fluoresces red [22]. Briefly, fresh
segments of the brown fat depots were frozen embedded
in optimal cutting temperature (OCT) compound, and
transverse sections (10 μm) were generated with a
Page 3 of 14
cryostat and placed on glass slides. Sections were then
incubated in chamber with 10 μM DHE for 30 minutes
at room temperature in a humidified chamber protected
from light. Images were obtained with a fluorescent
microscope. The excitation wavelength was 488 nm, and
emission fluorescence was detected with the use of a 585
nm filter. Quantification of fluorescence intensity was
determined by counting the number of positive stained
nuclei in 10 random fields.
Quantitative real-time PCR
Total RNA was isolated using TRIzol reagent as instructed
by the manufacturer (Invitrogen, Carlsbad, CA), and
reverse-transcribed to cDNA using the High Capacity
cDNA Reverse Transcription Kit (Applied Biosystems,
Foster City, CA). The quantitative real-time PCR analysis
was performed with a light480 real-time PCR System
(Roche Applied Science) following the standard procedure.
Real-time PCR primer sequences including uncoupling
protein 1 (Ucp1), peroxisome proliferator-activated receptor-g coactivator 1-a (Pgc-1a), elongation of very long
chain fatty acids 3 (Elovl3), type 2 iodothyronine deiondinase (Dio2), homeobox C9 (Hoxc9), insulin-like growth
factor binding protein 3 (Igfbp3), dermatopontin (Dpt),
and b-actin are showed in Table 1. Fold changes of
mRNA levels were determined after normalization to
internal control b-actin RNA levels.
Transmission electron microscopy (TEM)
Fat tissues were excised into small pieces (< 1 mm3) and
fixed with 2.5% glutaraldehyde (0.1 M phosphate buffer,
pH 7.4) for 3 hours. Each specimen was post-fixed in 1%
osmium tetroxide for 1 hour and dehydrated through a
graded series of ethanol concentrations before being
embedded in Eponate 12 resin, sectioned at a thickness of
80 nm and stained by 2% aqueous uranyl acetate followed
by lead citrate. The grids were then observed in a Technai
G2 Spirit TEM (FEI Company, Hillsboro, OR). Quantitative analyses were carried out at a magnification of
×18500. An average of six to seven visual fields was evaluated for mitochondria analysis. The size of mitochondria
was analyzed from randomly delineated in five to eight
micrographs per group by NIH ImageJ software.
Immunohistochemistry
Tissues were fixed overnight at room temperature in 4%
formaldehyde, dehydrated in graded ethanol, followed
by permeation in xylene and paraffin embedding. Fivemicrometer-thick sections were deparaffinized and subjected to heat-induced antigen retrieval by incubation in
Retrieve-all-1 unmasking solution (Signet Labs, Dedham,
MA) for 15 minutes at 95°C. The slides were dipped in
0.3% H 2 O 2 for 10 min to quench the endogenous
Xu et al. Particle and Fibre Toxicology 2011, 8:20
/>
Page 4 of 14
Table 1 Primers used for real-time PCR
Gene
Forward primer (5’ - 3’)
Reverse primer (5’ - 3’)
Hoxc9
GCAGCAAGCACAAAGAGGAGAAG
GCGTCTGGTACTTGGTGTAGGG
Igfbp3
GCAGCCTAAGCACCTACCTC
TCCTCCTCGGACTCACTGAT
Dpt
CTGCCGCTATAGCAAGAGGT
TGGCTTGGGTACTCTGTTGTC
Ucp1
GGCCTCTACGACTCAGTCCA
TAAGCCGGCTGAGATCTTGT
Pgc-1a
GAAAGGGCCAAACAGAGAGA
GTAAATCACACGGCGCTCTT
Dio2
AAGGCTGCCGAATGTCAACGAATG
TGCTGGTTCAGACTCACCTTGGAA
Elovl3
GCCTCTCATCCTCTGGTCCT
TGCCATAAACTTCCACATCCT
b-actin
TGTGATGGTGGGAATGGGTCAGAA
TGTGGTGCCAGATCTTCTCCATGT
peroxidase. After rinsing in phosphate buffered saline
(PBS), the sections were incubated in 1% BSA/PBS for
10 minutes, followed by overnight incubation with rat
anti-mouse F4/80 (AbD Serotec, Raleigh, NC) and rabbit
anti-UCP1 (Abcam Cambridge, MA) at 4°C. Then the
slides were rinsed and incubated at room temperature
for 2 hours with appropriate horseradish peroxidase
(HRP)-conjugated secondary antibodies. After the PBS
rinsing, the stain was developed using Fast 3, 3’-diaminobenzidine tablet sets (D4293; Sigma, St. Louis, MO).
The sections were then counterstained with hematoxylin
and analyzed by a research microscope (Zeiss 510
META, Jena, Germany) with Metamorph V.7.1.2 software (Universal Imaging, West Chester, PA).
Western blotting
Adipose tissues were homogenized in M-PER mammalian
protein extraction reagent (Thermo Fisher Scientific),
incubated on ice for 30 min, followed by centrifugation at
12000 g for 10 minutes at 4°C. The supernatant was collected and subjected to Western blot analysis. Protein concentrations were determined by BCA assay (Bio-Rad,
Hercules, CA). Twenty microgram of protein was separated by SDS-polyacrylamide gel electrophoresis and subsequently transferred to PVDF membrane. After blotting
in 5% non-fat dry milk in PBS-Tween 20 (PBS-T), the
membranes were incubated with primary antibodies
against b-actin (Sigma) or UCP1 (Abcam) overnight at
4°C, and then incubated with the appropriate horseradish
peroxidase-linked secondary antibodies for 2 hours at
room temperature. Finally, the membranes were visualized
with an enhanced chemiluminescence kit (Pierce Biotechnology, Rockford, IL). Band density was quantified by densitometric analysis using NIH ImageJ software.
Statistical analysis
Data are expressed as mean ± SEM unless otherwise
indicated. The results of experiments were analyzed by
unpaired t test using Graphpad Prism v4.0 (GraphPad
Software, San Diego, CA). In all cases, P value of < 0.05
was considered as statistically significant.
Results
Exposure characterization
The mean (SD) daily PM 2.5 concentration at the study
site was 11.82 (6.71) μg/m3, while the mean concentration of PM2.5 in the exposure chamber was 96.89 μg/m3
(approximately 8-fold concentration from ambient level).
Because the mice were exposed for 6 hours/day, 5 days/
week, the equivalent PM2.5 concentration to which the
mice were exposed to in the chamber normalized over
the 2-month period was 17.30 μg/m3. The mean elemental composition, as measured by energy-dispersive X-ray
fluorescence (ED-XRF) analysis, is presented in Table 2.
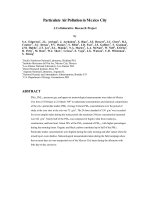
Superoxide (O2-) generation
In order to test whether exposure to PM2.5 results in
superoxide production in BAT, we performed dihydroethidium (DHE) staining on iBAT depots. As shown
in Figures 1A-1C, O 2 - production in the iBAT was
markedly enhanced in the PM2.5 group compared with
the FA group. O2- that was accumulated in the iBAT of
the mice exposed to PM 2.5 was approximately 80%
increase from FA-exposed controls.
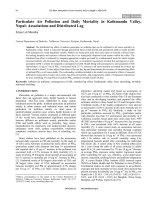
TEM analysis of in situ mitochondria
To determine whether PM2.5 exposure affects mitochondria in WAT and BAT, transmission electron microscopy (TEM) was used in this study. Figure 2 shows
representative TEM images of mitochondria in eWAT
(Figures 2A and 2B) and iBAT (Figures 2C and 2D),
respectively, and the analyses of mitochondria number
(Figure 2E) and area (Figure 2F). In the PM2.5-exposed
group, the mitochondrial number and area were significantly decreased in the iBAT when compared with the
FA group. In addition, the mitochondrial number was
also reduced in the eWAT in response to PM2.5 exposure, although we did not find significant differences in
the mitochondrial area in these adipose depots.
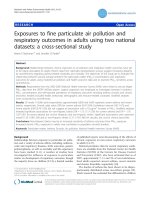
F4/80 and UCP1 expression
Adipose tissue macrophages (ATM), which are thought
to represent key cellular mediators of adipose tissue
Xu et al. Particle and Fibre Toxicology 2011, 8:20
/>
Page 5 of 14
Table 2 Elemental concentrations of PM2.5 particle during
the exposure
Ambient air
Exposure to PM2.5
Mean
s.d.
Mean
s.d.
S
1142.2
1045.7
10167.9
8038.0
Al
Si
244.9
70.0
145.2
60.1
1297.9
1166.9
571.0
918.7
Ca
37.9
37.8
631.7
519.5
Fe
27.5
20.5
403.5
211.6
Mg
64.6
73.3
365.0
281.7
K
49.3
24.0
358.4
216.1
Na
17.6
38.4
262.8
332.1
P
21.5
40.6
250.6
260.9
Cl
In
6.2
6.8
12.2
11.2
155.8
147.5
161.0
166.8
Sb
19.4
15.1
141.7
127.4
Ba
34.1
29.9
126.7
76.9
Zn
5.7
4.6
55.6
40.2
Cs
17.4
18.9
54.5
49.0
Cd
7.7
31.1
44.5
185.6
Sc
10.8
7.8
39.5
23.1
Co
Br
10.0
6.5
7.3
3.3
35.2
33.9
21.9
12.7
Se
8.1
5.6
28.2
15.0
I
5.7
15.7
28.2
55.6
V
8.5
5.0
27.2
12.9
Mn
4.1
6.0
24.9
18.8
Ti
1.8
2.4
22.2
20.0
Pb
4.4
6.4
21.5
21.8
As
Rb
4.3
4.5
5.2
2.7
18.2
13.7
14.9
7.2
Ge
3.5
4.7
11.9
11.7
Cr
1.4
2.2
11.5
24.7
Sr
2.4
2.0
11.3
2.0
3.7
11.1
10.7
Te
2.8
7.5
10.3
36.6
We next determined gene expression in different adipose depots in response to PM2.5 exposure, in terms of
the expression of BAT-specific and WAT-specific gene
profiles by real-time PCR analysis. UCP1 uncouples substrate oxidation and electron transport through the
respiratory chain from ATP production. This is caused
by an increased proton leakage over the inner mitochondrial membrane which dissipates the proton motive
force as heat instead of ATP synthesis [23,24]. As
shown in Figure 6, consistent with the fact that PGC-1a
induces mitochondrial biogenesis and thermogenesis
[25], its gene expression was marked in BAT compared
with WAT (> 30-fold increased), while the level of
Ucp1, which is almost classically associated with BAT
function, was enriched more than 600-fold in BAT
compared with WAT. The mRNA levels of the BATspecific genes Ucp1 and Pgc-1a were however decreased
in all defined adipose depots in response to PM2.5 exposure. The levels of down-regulation of both these genes
were pronounced in iBAT and mBAT in comparison
with the WAT depots. The gene expression of Elovl3,
which is majorly expressed in BAT [26], was significantly decreased in mBAT by PM2.5 exposure. In addition, Dio2 may catalyze the conversion of T4 (thyroxin)
into the active substance T3 (3, 3’, 5-triiodothyronine),
a process that occurs in all thyroid sensitive tissue but
is particularly pronounced in BAT [27]. The mRNA
levels of Dio2 were significantly reduced in both iBAT
and mBAT in response to PM 2.5 exposure. In this
study, we did not find significant differences on BATspecific gene expressions in the eWAT, rWAT and
iWAT depots.
6.2
Ga
BAT-specific gene expression
Ni
3.0
2.5
9.8
6.9
Sn
Cu
10.5
1.6
3.0
1.3
5.6
3.8
17.4
8.5
Note: unit, ng/m3. s.d., standard deviation.
inflammatory response and IR development, were examined in mice. As shown in Figure 3, PM 2.5 exposure
induced a marked increase in macrophage (F4/80+ cells)
infiltration in eWAT. Next, we analyzed the changes in
uncoupling protein 1 (UCP1) in response to PM 2.5
exposure. As shown in Figure 4, the data by immunohistochemical staining for UCP1 on the sections of iBAT
(Figure 4) demonstrated that UCP1 expression was significantly decreased in the PM2.5 group. Western blotting data further confirmed down-regulation of UCP1
protein in the iBAT after PM2.5 exposure (Figure 5).
WAT-specific gene expression
We also sought to determine if PM2.5 changed WATspecific gene profiles in different depots. Igfbp3 is a
family of six members important for insulin growth factor 1 (Igf-1) transport and storage in close proximity to
the Igf-1 receptor (Igf1r), thereby facilitating Igf-1mediated actions [28]. Hoxc9 belongs to the homeobox
family of genes, and it is recognized as WAT-specific
marker in primary adipocyte cultures [29]. DPT serves
as a good gene marker for white adipogenesis and can
be seen as a reference gene for the whitening phenomenon. As shown in Figure 7, the mRNA level of Hoxc9
was significantly higher in the iBAT and mBAT depots
from PM2.5-exposed group than FA-exposed group. The
mRNA level for Igfbp3 was also increased in mBAT in
response to PM2.5 exposure. We did not observe significant differences in the gene expressions of Hoxc9 or
Igfbp3 in the WAT, neither was the gene expression of
Dpt in BAT or WAT.
Xu et al. Particle and Fibre Toxicology 2011, 8:20
/>
Page 6 of 14
A
B
FA
C
PM2.5
% DHE positive area
40
*
30
20
10
0
FA
PM2.5
iBAT
Figure 1 Exposure to PM2.5 resulted in increased superoxide production in iBAT. A. DHE staining of adipose tissue sections from the mice
exposed to PM2.5 or FA for 2 months. Frozen iBAT sections were stained with DHE (10 μmol/L). The oxidative red fluorescence was analyzed by
fluorescent microscope. B. DHE signals were quantified by the percentage of DHE-positive areas in 5 random fields. n = 8. *P < 0.05 vs. FA.
Discussion
In this study, we investigated the effects of inhalation
exposure to PM 2.5 on oxidative stress, inflammatory
response, mitochondria and adipocyte-specific gene
expression in adipose tissue depots. To our knowledge,
this is the first study to systematically evaluate the effect
of ambient PM2.5 on WAT and BAT specific genes in
different adipose depots. There are several major findings in this study. First, exposure to PM2.5 resulted in
oxidative stress in BAT. Second, exposure to PM 2.5
induced changes consistent with reduced BAT functionality and a regression to a WAT phenotype [decrease in
BAT specific genes (Pgc-1a, Dio2, Ucp1) and increase in
WAT-specific genes (Hoxc9 and Igfbp3)]. This shift was
not seen in WAT, when the same genes were analyzed.
Finally, mitochondrial number was reduced in both
eWAT and iBAT in response to PM2.5 exposure.
Recent studies have implicated PM2.5 in increased adipose inflammation and insulin resistance [11,12], and
epidemiological studies indicate that obesity is
Xu et al. Particle and Fibre Toxicology 2011, 8:20
/>
Page 7 of 14
A
B
FA
PM2.5
C
D
E
PM2.5
F
Mitochondrial number
20
*
15
10
5
0
*
FA PM2.5 FA PM 2.5
WAT
BAT
Mitochondrial area (μm 2)
FA
20
FA
PM2.5
15
*
10
5
0
FA PM2.5 FA PM2.5
WAT
BAT
Figure 2 The number and area of mitochondria in the eWAT and iBAT. A-B. Representative TEM images of eWAT. C-D. Representative TEM
images of iBAT (Arrows point to mitochondria). E: The analysis of mitochondrial number per field in the eWAT and iBAT. F: The analysis of
mitochondrial area per field in the eWAT and iBAT. n = 4. *P < 0.05 vs. FA. Scale bars represent 500 nm in panels A, B, C and D.
Xu et al. Particle and Fibre Toxicology 2011, 8:20
/>
Page 8 of 14
A
B
F4/80 expression in eWAT
(Relative to FA)
FA
PM2.5
250
**
200
150
100
50
0
FA
PM2.5
Figure 3 PM2.5 exposure increases macrophage infiltration in the eWAT. A. Immunochemistry for macrophage-specific marker F4/80 in
sections of eWAT from FA- and PM2.5-exposed mice. B. Quantification of adipose tissue macrophages in eWAT. n = 4. **P < 0.001 vs. FA. Arrow
shows F4/80+ macrophages.
associated with adverse health risks, such as hypertension and atherosclerosis [30]. PM2.5 has been shown to
stimulate generation of reactive oxygen species (ROS) in
cells due to its small diameters and large surface area
[31]. To test if PM2.5 exposure could trigger ROS production in vivo, we examined the redox states in BAT.
O 2 - production was significantly increased in BAT in
PM2.5-exposed mice compared with FA-exposed mice.
PM exposure has been demonstrated to cause mitochondrial damage in the pulmonary and cardiovascular
systems [32,33], but little is known about the effects of
PM2.5 on mitochondria in adipose tissues. In our study,
Xu et al. Particle and Fibre Toxicology 2011, 8:20
/>
Page 9 of 14
A
PM2.5
B
UCP1 expression in iBAT
(Relative to FA)
FA
100
*
75
50
25
0
FA
PM2.5
Figure 4 Immunohistochemical examination of uncoupling protein 1 (UCP1) in the iBAT. A. iBAT was stained by antibody against UCP1 and
counterstained with hematoxylin. B. Quantification of UCP1 in iBAT. n = 8 *P < 0.05 vs. FA. Arrows show UCP1-positive brown adipocyte staining.
we showed, by TEM measurement, that mitochondrial
number was significantly decreased in response to PM2.5
exposure in both eWAT and iBAT, while the mitochondrial area was reduced in the eWAT depots as well. The
possible mechanisms may include increased adipocyte
membrane permeability or induced apoptosis caused by
ROS [34].
BAT functional alterations in response to various stimuli have been investigated for many years but adaptation in BAT as a pathophysiological entity has only been
Xu et al. Particle and Fibre Toxicology 2011, 8:20
/>
Page 10 of 14
A
B
FA
PM2.5
UCP1
UCP1/ -actin
2.0
β-actin
*
1.5
1.0
0.5
0.0
FA
PM2.5
Figure 5 PM2.5 exposure decreases UCP1 protein in the iBAT evaluated by Western blot. A. Representative bands of FA and PM2.5 on
UCP1 protein level in iBAT by Western blotting. B. Quantitative results of Western blotting of UCP1. n = 8. *P <0.05 vs. FA.
recently investigated. Alterations in BAT function may
influence propensity to obesity [35]. Indeed, prior studies suggest alteration of brown adipose gene expression
in response to obesity and diabetes [36,37]. In addition
to modulation of BAT functionality, there has been considerable interest in “brown-like adipose cells” in WAT.
These so called “brite” cells are present in WAT as evidenced by the presence of UCP1 expressing cells in
WAT. Studies in cell culture indicate that brown adipocytes and muscle cells share a common origin, which is
distinct from white adipocytes [38]. A series of experiments has demonstrated that the UCP1 expressing cells
constitute a subset of adipocytes (“brite” adipocytes)
with a developmental origin and molecular characteristics [39]. The functional significance of these cells is not
known, however; the presence of such cells in WAT
raises important questions regarding potential regulatory
pathways that may enhance or decrease “brown-fat” like
functionality to WAT. In conditions of chronic cold
exposure white-to-brown conversion meets the need of
thermogenesis, while an obesogenic diet induces brownto-white conversion, to meet the need of storing excess
energy [40].
In this study, we found evidence of important changes
in BAT in response to PM 2.5 exposure. BAT expends
energy through sympathetic nervous system-mediated
non-shivering thermogenesis, where UCP1 is the key
player [41,42]. UCP1 was significantly decreased in the
iBAT. In addition, morphometric evaluation of TEM
images indicated that mitochondrial number and size in
BAT and the number (but not size) in WAT were
reduced in response to PM2.5 exposure. Taken together,
these data suggest that PM2.5 exposure may compromise
the functionality of iBAT.
We found that PM2.5 exposure induces down-regulation
of Ucp1, Pgc-1a, Dio2 and Elovl3 genes (change in Elovl3
seen only in mBAT) in classic BAT depots. On the other
hand, WAT-specific genes Hoxc9 and Igfbp3 were upregulated in brown adipose tissue, indicating brown adipocytes may potentially transform to a white adipose phenotype when stimulated by PM2.5 exposure. Interestingly, a
similar shift was not seen in WAT suggesting that this
phenotype is relatively specific for BAT.
Why these changes occur in BAT are beyond the scope
of this paper, primarily due to limitations of sample size
and tissue availability in each group. However, it is interesting to postulate that the increased vascularity of BAT
may potentially relate to its vulnerability to air-pollution
mediated effects. Future studies would need to be designed
to provide significant insights into the roles and mechanisms of PM2.5-associated physiology and pathology.
In summary, our data demonstrate the important
effects of PM2.5 exposure on oxidative stress and mitochondrial alterations in adipose tissues. These findings
may have a significant impact on our understanding of
the adverse effects of particulate air pollution on cardiometabolic diseases, especially in the context of obesity
and insulin resistance.
Xu et al. Particle and Fibre Toxicology 2011, 8:20
/>
0.06
0.04
0.02
0.00
eWAT
rWAT
*
15
10
5
0
iWAT
FA
PM2.5
20
*
iBAT
mBAT
Pgc-1
0.006
Pgc-1
FA
PM2.5
0.005
0.004
0.003
0.002
0.001
0.000
Relative mRNA levels
FA
PM2.5
0.08
25
eWAT
rWAT
0.15
Relative mRNA levels
Relative mRNA levels
Ucp1
Ucp1
0.10
Relative mRNA levels
Page 11 of 14
FA
PM2.5
0.10
*
*
0.05
0.00
iWAT
iBAT
mBAT
Elovl3
FA
PM2.5
0.006
0.005
0.004
0.003
0.002
0.001
0.000
eWAT
rWAT
Elovl3
0.6
Relative mRNA levels
Relative mRNA levels
0.007
0.4
*
0.2
0.0
iWAT
FA
PM2.5
iBAT
mBAT
Dio2
FA
PM2.5
0.004
0.003
0.002
0.001
0.000
eWAT
rWAT
iWAT
Dio2
0.10
Relative mRNA levels
Relative mRNA levels
0.005
FA
PM2.5
0.08
0.06
*
0.04
*
0.02
0.00
iBAT
mBAT
Figure 6 Effect of PM2.5 exposure on brown adipocyte-specific gene (Ucp1, Pgc-1a, Elovl3, Dio2) mRNA levels in white adipose (eWAT,
rWAT, and iWAT, left), and brown adipose depots (iBAT, and mBAT, right) by real-time PCR. n = 8. *P < 0.05 vs. FA.
Xu et al. Particle and Fibre Toxicology 2011, 8:20
/>
Page 12 of 14
Hoxc9
0.0010
0.0005
eWAT
0
0.005
0.6
0.4
0.2
eWAT
rWAT
Igfbp3
FA
PM2.5
0.010
*
0.005
iBAT
iWAT
mBAT
Dpt
0.06
FA
PM2.5
mBAT
0.015
0.000
iWAT
Dpt
0.8
Relative mRNA levels
rWAT
Relative mRNA levels
FA
PM2.5
eWAT
iBAT
0.020
0.010
0.0
1e-005
iWAT
0.015
0.000
*
2e-005
Igfbp3
0.020
Relative mRNA levels
rWAT
Relative mRNA levels
0.0015
FA
PM2.5
**
3e-005
Relative mRNA levels
Relative mRNA levels
FA
PM2.5
0.0020
0.0000
Hoxc9
4e-005
0.0025
FA
PM2.5
0.05
0.04
0.03
0.02
0.01
0.00
iBAT
mBAT
Figure 7 Effect of PM2.5 exposure on white adipocyte-specific gene (Hoxc9, Igfbp3, Dpt) mRNA levels in white (eWAT, rWAT, iWAT,
left), and brown adipose depots (iBAT and mBAT, right) by real-time PCR. n = 8. *P < 0.05, **P < 0.001 vs. FA.
Acknowledgements
The authors would like to thank the support from Campus Microscopy and
Imaging Facility at The Ohio State University for the TEM experiment. This
work was supported by National Institute of Health grants ES016588,
ES017412, and ES018900 to Dr. Sun, ES015146 and ES017290, and EPA grant
R834797-01 to Dr. Rajagopalan, an NPACT Initiative grant from the Health
Effects Institute to Drs. Lippmann and Chen, and laboratory facilities
supported by NIEHS Center Grant (ES 00260) to New York University School
of Medicine.
Author details
1
The Second Xiangya Hospital, Central South University, Changsha, Hunan,
China. 2Division of Environmental Health Sciences, College of Public Health,
The Ohio State University, Columbus, Ohio, USA. 3The Department of
Environmental Medicine, New York University School of Medicine, Tuxedo,
New York, USA. 4Center for Integrative Toxicology and Department of
Pathobiology and Diagnostic Investigation, Michigan State University, East
Lansing, Michigan, USA. 5Davis Heart and Lung Research Institute, The Ohio
State University, Columbus, Ohio, USA. 6Division of Cardiology, College of
Medicine, The Ohio State University, Columbus, Ohio, USA.
Authors’ contributions
ZX, XX, MZ, and AW performed the experiments and contributed to
acquisition of data. ZX, XX, MZ, IPH, RPL, JGW, LAB, and YY analyzed the
data and interpreted the results. MZ, IPH, IPH, RPL, JGW, and LAB
contributed to PM2.5 exposure of the animals. The manuscript was written
by ZX and XX and revised critically by YY, QS, ML, and SR. All authors read,
corrected and approved the manuscript.
Competing interests
The authors declare that they have no competing interests.
Received: 6 April 2011 Accepted: 11 July 2011 Published: 11 July 2011
References
1. Schulz H, Harder V, Ibald-Mulli A, Khandoga A, Koenig W, Krombach F,
Radykewicz R, Stampfl A, Thorand B, Peters A: Cardiovascular effects of
fine and ultrafine particles. J Aerosol Med 2005, 18:1-22.
2. Halonen JI, Lanki T, Yli-Tuomi T, Tiittanen P, Kulmala M, Pekkanen J:
Particulate air pollution and acute cardiorespiratory hospital admissions
and mortality among the elderly. Epidemiology 2009, 20:143-153.
Xu et al. Particle and Fibre Toxicology 2011, 8:20
/>
3.
4.
5.
6.
7.
8.
9.
10.
11.
12.
13.
14.
15.
16.
17.
18.
19.
20.
Pearson JF, Bachireddy C, Shyamprasad S, Goldfine AB, Brownstein JS:
Association between fine particulate matter and diabetes prevalence in
the U.S. Diabetes Care 2010, 33:2196-2201.
Walden TB, Petrovic N, Nedergaard J: PPARalpha does not suppress
muscle-associated gene expression in brown adipocytes but does
influence expression of factors that fingerprint the brown adipocyte.
Biochem Biophys Res Commun 2010, 397:146-151.
Tran TT, Kahn CR: Transplantation of adipose tissue and stem cells: role
in metabolism and disease. Nat Rev Endocrinol 6:195-213.
Petrovic N, Walden TB, Shabalina IG, Timmons JA, Cannon B, Nedergaard J:
Chronic peroxisome proliferator-activated receptor gamma
(PPARgamma) activation of epididymally derived white adipocyte
cultures reveals a population of thermogenically competent, UCP1containing adipocytes molecularly distinct from classic brown
adipocytes. J Biol Chem 2010, 285:7153-7164.
Teulier L, Rouanet JL, Letexier D, Romestaing C, Belouze M, Rey B,
Duchamp C, Roussel D: Cold-acclimation-induced non-shivering
thermogenesis in birds is associated with upregulation of avian UCP but
not with innate uncoupling or altered ATP efficiency. J Exp Biol 2010,
213:2476-2482.
Madsen L, Pedersen LM, Lillefosse HH, Fjaere E, Bronstad I, Hao Q,
Petersen RK, Hallenborg P, Ma T, De Matteis R, Araujo P, Mercader J,
Bonet ML, Hansen JB, Cannon B, Nedergaard J, Wang J, Cinti S, Voshol P,
Doskeland SO, Kristiansen K: UCP1 induction during recruitment of brown
adipocytes in white adipose tissue is dependent on cyclooxygenase
activity. PLoS One 2010, 5:e11391.
Choo HJ, Kim JH, Kwon OB, Lee CS, Mun JY, Han SS, Yoon YS, Yoon G,
Choi KM, Ko YG: Mitochondria are impaired in the adipocytes of type 2
diabetic mice. Diabetologia 2006, 49:784-791.
Sun Q, Wang A, Jin X, Natanzon A, Duquaine D, Brook RD, Aguinaldo JG,
Fayad ZA, Fuster V, Lippmann M, Chen LC, Rajagopalan S: Long-term air
pollution exposure and acceleration of atherosclerosis and vascular
inflammation in an animal model. Jama 2005, 294:3003-3010.
Sun Q, Yue P, Deiuliis JA, Lumeng CN, Kampfrath T, Mikolaj MB, Cai Y,
Ostrowski MC, Lu B, Parthasarathy S, Brook RD, Moffatt-Bruce SD, Chen LC,
Rajagopalan S: Ambient air pollution exaggerates adipose inflammation
and insulin resistance in a mouse model of diet-induced obesity.
Circulation 2009, 119:538-546.
Xu X, Yavar Z, Verdin M, Ying Z, Mihai G, Kampfrath T, Wang A, Zhong M,
Lippmann M, Chen LC, Rajagopalan S, Sun Q: Effect of early particulate air
pollution exposure on obesity in mice: role of p47phox. Arterioscler
Thromb Vasc Biol 2010, 30:2518-2527.
Araujo JA, Barajas B, Kleinman M, Wang X, Bennett BJ, Gong KW, Navab M,
Harkema J, Sioutas C, Lusis AJ, Nel AE: Ambient particulate pollutants in
the ultrafine range promote early atherosclerosis and systemic oxidative
stress. Circ Res 2008, 102:589-596.
Riva DR, Magalhaes CB, Lopes AA, Lancas T, Mauad T, Malm O, Valenca SS,
Saldiva PH, Faffe DS, Zin WA: Low dose of fine particulate matter (PM2.5)
can induce acute oxidative stress, inflammation and pulmonary
impairment in healthy mice. Inhal Toxicol 2011, 23:257-267.
Kang GS, Gillespie PA, Gunnison A, Moreira AL, Tchou-Wong KM, Chen LC:
Long-term inhalation exposure to nickel nanoparticles exacerbated
atherosclerosis in a susceptible mouse model. Environ Health Perspect
2011, 119:176-181.
Svensson PA, Jernas M, Sjoholm K, Hoffmann JM, Nilsson BE, Hansson M,
Carlsson LM: Gene expression in human brown adipose tissue. Int J Mol
Med 2010.
Dahlman I, Arner P: Genetics of adipose tissue biology. Prog Mol Biol
Transl Sci 2010, 94:39-74.
Cavallini I, Marino MA, Tonello C, Marzola P, Nicolato E, Fabene PF,
Calderan L, Bernardi P, Asperio RM, Nisoli E, Sbarbati A: The hydrolipidic
ratio in age-related maturation of adipose tissues. Biomed Pharmacother
2006, 60:139-143.
Oliver P, Pico C, Palou A: Ontogenesis of leptin expression in different
adipose tissue depots in the rat. Pflugers Arch 2001, 442:383-390.
Sirivelu MP, MohanKumar SM, Wagner JG, Harkema JR, MohanKumar PS:
Activation of the stress axis and neurochemical alterations in specific
brain areas by concentrated ambient particle exposure with
concomitant allergic airway disease. Environ Health Perspect 2006,
114:870-874.
Page 13 of 14
21. Maciejczyk P, Chen LC: Effects of subchronic exposures to concentrated
ambient particles (CAPs) in mice. VIII. Source-related daily variations in
in vitro responses to CAPs. Inhal Toxicol 2005, 17:243-253.
22. Sun Q, Yue P, Ying Z, Cardounel AJ, Brook RD, Devlin R, Hwang JS,
Zweier JL, Chen LC, Rajagopalan S: Air pollution exposure potentiates
hypertension through reactive oxygen species-mediated activation of
Rho/ROCK. Arterioscler Thromb Vasc Biol 2008, 28:1760-1766.
23. Klingenberg M, Echtay KS, Bienengraeber M, Winkler E, Huang SG:
Structure-function relationship in UCP1. Int J Obes Relat Metab Disord
1999, 23(Suppl 6):S24-29.
24. Klingenberg M, Huang SG: Structure and function of the uncoupling
protein from brown adipose tissue. Biochim Biophys Acta 1999,
1415:271-296.
25. Farmer SR: Molecular determinants of brown adipocyte formation and
function. Genes Dev 2008, 22:1269-1275.
26. Jorgensen JA, Zadravec D, Jacobsson A: Norepinephrine and rosiglitazone
synergistically induce Elovl3 expression in brown adipocytes. Am J
Physiol Endocrinol Metab 2007, 293:E1159-1168.
27. Christoffolete MA, Linardi CC, de Jesus L, Ebina KN, Carvalho SD,
Ribeiro MO, Rabelo R, Curcio C, Martins L, Kimura ET, Bianco AC: Mice with
targeted disruption of the Dio2 gene have cold-induced overexpression
of the uncoupling protein 1 gene but fail to increase brown adipose
tissue lipogenesis and adaptive thermogenesis. Diabetes 2004, 53:577-584.
28. Boney CM, Moats-Staats BM, Stiles AD, D’Ercole AJ: Expression of insulinlike growth factor-I (IGF-I) and IGF-binding proteins during adipogenesis.
Endocrinology 1994, 135:1863-1868.
29. Gesta S, Bluher M, Yamamoto Y, Norris AW, Berndt J, Kralisch S, Boucher J,
Lewis C, Kahn CR: Evidence for a role of developmental genes in the
origin of obesity and body fat distribution. Proc Natl Acad Sci USA 2006,
103:6676-6681.
30. Kopelman PG: Obesity as a medical problem. Nature 2000, 404:635-643.
31. Akhtar US, McWhinney RD, Rastogi N, Abbatt JP, Evans GJ, Scott JA:
Cytotoxic and proinflammatory effects of ambient and source-related
particulate matter (PM) in relation to the production of reactive oxygen
species (ROS) and cytokine adsorption by particles. Inhal Toxicol 22:37-47.
32. Xia T, Kovochich M, Nel AE: Impairment of mitochondrial function by
particulate matter (PM) and their toxic components: implications for PMinduced cardiovascular and lung disease. Front Biosci 2007, 12:1238-1246.
33. Wallenborn JG, Schladweiler MJ, Richards JH, Kodavanti UP: Differential
pulmonary and cardiac effects of pulmonary exposure to a panel of
particulate matter-associated metals. Toxicol Appl Pharmacol 2009,
241:71-80.
34. Soberanes S, Urich D, Baker CM, Burgess Z, Chiarella SE, Bell EL, Ghio AJ, De
Vizcaya-Ruiz A, Liu J, Ridge KM, Kamp DW, Chandel NS, Schumacker PT,
Mutlu GM, Budinger GR: Mitochondrial complex III-generated oxidants
activate ASK1 and JNK to induce alveolar epithelial cell death following
exposure to particulate matter air pollution. J Biol Chem 2009,
284:2176-2186.
35. Marcelin G, Chua S Jr: Contributions of adipocyte lipid metabolism to
body fat content and implications for the treatment of obesity. Curr Opin
Pharmacol 10:588-593.
36. Ruschke K, Fishbein L, Dietrich A, Kloting N, Tonjes A, Oberbach A,
Fasshauer M, Jenkner J, Schon MR, Stumvoll M, Bluher M, Mantzoros CS:
Gene expression of PPARgamma and PGC-1alpha in human omental
and subcutaneous adipose tissues is related to insulin resistance
markers and mediates beneficial effects of physical training. Eur J
Endocrinol 162:515-523.
37. Keller MP, Attie AD: Physiological insights gained from gene expression
analysis in obesity and diabetes. Annu Rev Nutr 30:341-364.
38. Timmons JA, Wennmalm K, Larsson O, Walden TB, Lassmann T, Petrovic N,
Hamilton DL, Gimeno RE, Wahlestedt C, Baar K, Nedergaard J, Cannon B:
Myogenic gene expression signature establishes that brown and white
adipocytes originate from distinct cell lineages. Proc Natl Acad Sci USA
2007, 104:4401-4406.
39. Petrovic N, Walden TB, Shabalina IG, Timmons JA, Cannon B, Nedergaard J:
Chronic peroxisome proliferator-activated receptor gamma
(PPARgamma) activation of epididymally derived white adipocyte
cultures reveals a population of thermogenically competent, UCP1containing adipocytes molecularly distinct from classic brown
adipocytes. J Biol Chem 285:7153-7164.
Xu et al. Particle and Fibre Toxicology 2011, 8:20
/>
Page 14 of 14
40. Cinti S: Between brown and white: novel aspects of adipocyte
differentiation. Ann Med 2011, 43:104-115.
41. Fromme T, Klingenspor M: Uncoupling protein 1 expression and high fat
diets. Am J Physiol Regul Integr Comp Physiol 300(1):R1-8.
42. Kozak LP, Koza RA, Anunciado-Koza R: Brown fat thermogenesis and body
weight regulation in mice: relevance to humans. Int J Obes (Lond)
34(Suppl 1):S23-27.
doi:10.1186/1743-8977-8-20
Cite this article as: Xu et al.: Ambient particulate air pollution induces
oxidative stress and alterations of mitochondria and gene expression in
brown and white adipose tissues. Particle and Fibre Toxicology 2011 8:20.
Submit your next manuscript to BioMed Central
and take full advantage of:
• Convenient online submission
• Thorough peer review
• No space constraints or color figure charges
• Immediate publication on acceptance
• Inclusion in PubMed, CAS, Scopus and Google Scholar
• Research which is freely available for redistribution
Submit your manuscript at
www.biomedcentral.com/submit