Tài liệu Air pollution exposure during pregnancy and reduced birth size: a prospective birth cohort study in Valencia, Spain docx
Bạn đang xem bản rút gọn của tài liệu. Xem và tải ngay bản đầy đủ của tài liệu tại đây (1.74 MB, 11 trang )
RESEARC H Open Access
Air pollution exposure during pregnancy and
reduced birth size: a prospective birth cohort
study in Valencia, Spain
Ferran Ballester
1,2,3*
, Marisa Estarlich
2,1
, Carmen Iñiguez
1,2
, Sabrina Llop
2,1
, Rosa Ramón
2,4
, Ana Esplugues
1,2
,
Marina Lacasaña
5,2
, Marisa Rebagliato
6,2
Abstract
Background: Maternal exposure to air pollution has been related to fetal growth in a number of recent scientific
studies. The objective of this study was to assess the association between exposure to air pollution during
pregnancy and anthropometric measures at birth in a cohort in Valencia, Spain.
Methods: Seven hundred and eighty-five pregnant women and their singleton newborns participated in the study.
Exposure to ambient nitrogen dioxide (NO
2
) was estimated by means of land use regression. NO
2
spatial
estimations were adjusted to correspond to relevant pregnancy periods (whole pregnancy and trimesters) for each
woman. Outcome variables were birth weight, length, and head circumference (HC), along with being small for
gestational age (SGA). The association between exposure to residential outdoor NO
2
and outcom es was assessed
controlling for potential confounders and examining the shape of the relationship using generalized additive
models (GAM).
Results: For continuous anthropometric measures, GAM indicated a change in slope at NO
2
concentrations of
around 40 μg/m
3
.NO
2
exposure >40 μg/m
3
during the first trimester was associated with a change in birth length
of -0.27 cm (95% CI: -0.51 to -0.03) and with a change in birth weight of -40.3 grams (-96.3 to 15.6); the same
exposure throughout the whole pregnancy was associated with a change in birth HC of -0.17 cm (-0.34 to -0.003).
The shape of the relation was seen to be roughly linear for the risk of being SGA. A 10 μg/m
3
increase in NO
2
during the second trimester was associated with being SGA-weight, odds ratio (OR): 1.37 (1.01-1.85). For SGA-
length the estimate for the same comparison was OR: 1.42 (0.89-2.25).
Conclusions: Prenatal exposure to traffic-related air pollution may reduce fetal growth. Findings from this study
provide further evidence of the need for developing strategies to reduce air pollution in ord er to prevent risks to
fetal health and development.
Background
In recent years a growing body of epidemiological
research has focused on the potential impact of prenatal
exposure to air pollution on birth outcomes. Several
outcomes have been related to exposu re to air pollution
during pregnancy, including low birth weight, reduced
birth size, and intrauterine growth retardation [1-4].
Moreover, reduction in fetal growth has been associated
with poor neurological development as well as with an
increased risk for chronic diseases later in life [5,6].
A cohort s tudy is the design of choice for evaluating
the impact of air pollution on fetal growth as pregnancy
is a process in which the relationship between a given
type of exposure and an associated effect may be
observed in a limited period of time [7]. Some of the
studies carried out on this topic have included large
populations usin g birth data from health care registries
[8-10] whereas other cohort studies had smaller sam-
ples, but more detailed, primary data [11-13]. Authors
of recent methodological reviews [7,14-16] agree that
* Correspondence:
1
Center for Public Health Research (CSISP), Conselleria de Sanitat, Avda
Catalunya 21, 46020, Valencia, Spain
Ballester et al. Environmental Health 2010, 9:6
/>© 2010 Ballester et a l; licensee BioMe d Central Ltd. This is an Open Access article distribute d under the terms of the Creative Commons
Attribution License ( which permits unrestricted use, distribution, and reproductio n in
any medium, provided the origina l work is prop erly cited.
new prospective studies should allow for adequate
assessment of air pollution exposure, consider different
time windows of exposure, and collect sufficient infor-
mation on confounding variables.
Nitrogen dioxide (NO
2
) is the air pollutant most fre-
quently used as a surrogate for traffic-related pollution
in prospective studies, both in adults and in children
[17,18]. T his is due to the fa ct that outdoor NO
2
levels
correlate well with pollutants generated by traffic, they
can be easily measured using passive samplers, and they
are routinely measured by air quality networks, which
allows for correction for seasonality.
The INMA study (Spanish Children’ sHealthand
Environment) is a prospective multi-centre pregnancy
and birth cohort study that seeks to evaluate the role of
the environment on fetal development and children’s
health in the general population in Spain [19]. The
objective of this report is t o assess the association
between residential exposure to outdoor NO
2
during
pregnancy and anthropometric measures at birth.
Methods
Study design and population
The present study was based on data from the INMA
cohort in Valencia. Between November 2003 and June
2005, 855 pregnant women attending the prenatal popu-
lation-based screening program at the reference hospital
were included in the study. Thirty-five of these women
had a spontaneous abortion or fetal death, 33 withdrew
from the study or were lost to follow up, and 787 deliv-
ered a live, singleton infant. Exposure to outdoor NO
2
was assessed for 785 of the 787 mother-child pairs in
the study, thus making up the final study p opulation.
Deliveries took place between May 2004 and February
2006.Thestudyareacoveredthehomeaddressesofall
participants. Approximately 10% lived in a ty pically
urban zone (city of Valencia), 50% lived in the metropo-
litan zone, 35% in a semi-urban zone, and the rest in a
typically rural zone. The study area covers 1372 km
2
including 34 municipalities a nd has a reference popula-
tion of almost 300,000 inhabitants with a broad socio-
demographic and environmental heterogeneity. The
study protocol was approved by the Ethics Committee
of the reference hospital and informed consent was
obtained from every participating woman. The mothers’
recruitment and follow up procedures have been pre-
viously reported [19].
Birth outcome assessment
Outcome variables were birth weight (in grams), b irth
lengthandheadcircumference (in centimetres). Birth
weight was measured by the midwife that attended the
birth, whereas birth length and head circumference were
measured by a nurse when the newborn arrived in the
hospital ward within the first twelve hours of life. The
three measures were standardized for gestational age and
sex using the residuals method [20]. An early ultrasound
of the crown-rump length was also available and used for
gestational dating when the difference with the last men-
strual period was equal to or greater than 7 days. This
happened in 11.9% of the cases. We defined small for
gestational age (SGA) as a birth weight or length below
the 10
th
percentile according to standard percentile
charts for sex and gestational age in the Spanish popula-
tion [21]. We did not classify SGA in terms of head cir-
cumference because our measurement procedure was
different from that used in the published charts. Of all
the births, 6.4% were classified as preterm births (i.e.
gestational age < 37 weeks) in the studied cohort.
Assessment of air pollution exposure
A procedure was designed to assess indi vidual exposure
to NO
2
as a marker of outdoor air pollution considering
both spatial and temporal variations on exposure. Ambi-
ent NO
2
concentrations for 93 sampling points covering
the study area were obtained using radial symmetry pas-
sive samplers (Radiello®, Fondazione Salvatore Maugeri,
Padua/Italy) which remained exposed for four sampling
periods of 7 days each. The campaigns took place in
April, June, and November 2004 and February 2005.
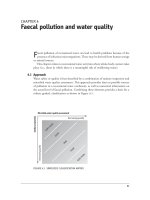
The passive samplers were distributed over the area
according to geometrical criteria, taking into account
the expected pollution gradients and the expected num-
ber of births ( Figure 1). For obtaining estimates of the
NO
2
spatial distribution in the study area, a two step
approach was used. First, universal kriging was used to
predict NO
2
levels at unmonitored sites, i.e. the
women’s residences. Then, geographical information sys-
tem (GIS) data (traffic, i.e. vehicle density and distance
to a main road, land use, and altitude) were used to
improve predictions with the aid of land use regression
(LUR).
In addition, in order to take into account temporal
variations in exposure, we used daily information from
seven stations of the monitoring network within 5 km
or less of the study area to adjust NO
2
spatial estima-
tions to correspond with the pregnancy period for each
woman. Thus, the NO
2
spatial estimation for each
woman’s residence was multiplied by the ratio between
the NO
2
monitoring network average during the preg-
nancy period of tha t particular woman di vided by the
NO
2
monitoring network average for the entire study
period. In order to explore critical exposure windows,
an air pollution exposur e indicator for each trimester of
pregnancy was constru cted using the same pro cedure as
that utilized for the entire pregnancy. Address changes
were take n into consideration when they accounted for
a relevant fraction of each exposure window (>2/9). The
Ballester et al. Environmental Health 2010, 9:6
/>Page 2 of 11
methodology and results for assignment of personal air
pollution exposure have been described elsewhere [22].
Covariates and potential confounders
The mothers completed a detailed questionnaire about
socio-demographic characteristics, environ mental expo-
sures, and life style variables twice during their pregnancy
(weeks 10-13 and 28-32). The questionnaires were admi-
nistered during personal interviews by previously trained
interviewers. Potential confounders included maternal
variables (see Addit ional file 1), infant’ s sex, paternal
height, and season of delivery. Body mass index (BMI)
and gestational weight gain were further classified follow-
ing the Institute of Medicine guidelines [23]. Socio-eco-
nomic status (SES) was classified using an adaptation of
the British SES classification. Environmental tobacco
smoke exposure was assessed as both passive exposure at
home and global exposure.
Statistical Methods
We first performed bivariate analysis to determine paren-
tal and pregnancy characteristics associated with birth
outcomes. We also examined individual NO
2
levels and
maternal and pregnancy charac teristics. Association
between exposure to residential outdoor NO
2
and
anthropometric measures was assessed by means of lin-
ear regression for continuous var iables and logistic
regression for SGA. In order to avoid excessive influence
of extreme values, robust methods were applied. For con-
tinuous variables, we checked for the shape of the rela-
tion using graphical smoothing techniques. The height of
both parents showed a linear relation and was therefore
included as a continuous variable in the models. The rest
of the continuous variables were categorized to account
for non-linear associations. Covariates were retained in
the final model if they were related to the outcome based
on likelihood ratio (LR) tests with a p value of < 0.10 or if
they changed effect estimates for the exposure of interest
by > = 10% when excluded from the model. The mother’s
age was included in all models in spite of its statistical
significance. Zone of residence was not included in the
multivariate analyses because it was highly correlated
with NO
2
levels.Toassesstheshapeoftherelationship
between measures at birth and NO
2
levels, we used
adjusted GAM models to evaluate the linearity of the
relation between NO
2
levels and the reproductive
Figure 1 Spatial distribution of the NO
2
levels in the study area and addresses of the women in the cohort.
Ballester et al. Environmental Health 2010, 9:6
/>Page 3 of 11
outcomes, comparing models with NO
2
levels in a linear
and non-linear manner (a cubic smoothing spline with 2,
3, and 4 degrees of freedom) by means of graphical
examination and an LR test (p < 0.05).
Results
Characteristics of the newborns, the mothers and their
pregnancy, and the fathers’ height in relation to size
measures and SGA are described in Additiona l file 1. In
brief, older mothers, mother s who had higher pre-preg-
nancy weight and/or BMI, who were taller, of higher
social class, non-smokers, and of Latin American origin
had infants with a higher birth weight and a lower pro-
portion of SGA (in weight) babies. Primiparous mothers,
those with low weight gain, those with only primary
school education, and those who still smoked at week
12 had infants with a lower birth weight and a higher
proportion of SGA (in weight) babies. Boys weighed
more than girls. Similar patterns were found for birth
length and head circumference adjusted for gestational
age,andforSGA(inlength)exceptthattherewereno
differencesbycountryoforigin,andinthecaseof
length, no differences by either social class or education
were observed. Finally, taller fathers had bigger babies
and a lower proportion of SGA babies.
The spatial distribution of NO
2
levels throughout the
study area showed a gradient from the urban zone to
the rural one with the two m otorways cro ssing the area
playing an im portant role (Figure 1). The mean residen-
tial outdoor NO
2
level corresponding to the 785 preg-
nancy periods wa s 36.9 μg/m
3
(Table 1). For 43.2% of
the women, the outdoor N O
2
levels at their r esidences
during the pregnancy period were above 40 μg/m3, the
World Health Organization guideline for annual NO
2
concentration [24]. Individual NO
2
levels for each trime-
ster correlated well with NO
2
levels for the whole preg-
nancy, and moderately between themselves (Table 1).
Air pollution exposure and anthropometric measures
Unadjusted analysis considering the variables in their
continuous form showed a negative relationship between
individual exposures to ambient NO
2
and
anthropometric measures at birth (Table 2). This rela-
tion was statistically significant for first trimester expo-
sure a nd for both birth length and head circumference,
as well as for second trimester exposure and head cir-
cumference. After adjustment for covariates and poten-
tial confounders, the same temporal pattern persisted
(Table 2). Although 95% confidence intervals yielded
results that do not reject the null hypothesis, birth head
circumference and NO
2
exposure in the first trimester
were marginally associated. Specifically, an increase i n
10 μg/m
3
in NO
2
levels during the first trimester of
pregnancy was associated with a de crease in h ead cir-
cumference by -0.07 cm (95% CI: -0.14 to 0.005).
When the shape of the re lation between NO
2
expo-
sure and anthropometric measures was assessed, a non-
linear relationship was observed. In most cases i n the
multivariate analysis, the best fit was obtained when
NO
2
was introduced as a cubic smoothing spline with 3
or 4 degrees of freedom (Table 2). Graphic examinatio n
of the relation between NO
2
exposure during t he first
trimester and birth weight and length, and between
NO
2
exposure during the second trimester and head cir-
cumference suggested a change in slope around 40 μg/
m
3
(Figure 2). For this reason, the association between
NO
2
exposure and weight, length, and head circumfer-
ence at birth was also analyzed considering NO
2
as a
categorical variable, i.e. >40 μg/m
3
versus ≤40 μg/m
3
(Table 3). Results of the multivariate analysis indicated
that NO
2
exposure above 40 μg/m
3
during the first tri-
mester was associated with a reduction in birth length
of -0.27 cm (95 %CI -0.51 to -0.03). Birth weight was
just marginally associated with NO
2
exposure;i.e.a
reduction of -40.3 grams in birth weight (95%CI: -96.3
to15.6)forthesamecomparison.Alsoasignificant
reduction in head circumference was found for expo-
sures above 40 μg/m
3
throughout the entire pregnancy.
Analysis of the relationship with small for gestational age
(SGA)
In the bivariate analysis, although all the odds ratios
(OR) were higher than 1, no significant association was
found for either of the two measures of SGA and
Table 1 Descriptive statistics of the estimates of individual exposure to ambient NO
2
during the different pregnancy
periods.
Pregnancy period Mean (μg/m
3
) Percentiles (μg/m
3
) Pearson’s correlation (r) between periods
25 50 75 First trimester Second trimester Third trimester
First trimester 37.9 28.2 38.1 48.5
Second trimester 35.9 26.5 35.2 44.2 0.69*
Third trimester 37.0 27.3 37.0 46.1 0.34* 0.65*
Whole pregnancy 36.9 29.4 37.9 45.6 0.80* 0.92* 0.83*
*p < 0.001
INMA-Valencia cohort, 2003-2006
Ballester et al. Environmental Health 2010, 9:6
/>Page 4 of 11
Table 2 Association between individual exposure to ambient NO
2
in different time periods during pregnancy and
anthropometric measures at birth.*
Birth weight (in g)
a
(n:785)
Birth length (in cm)
a
(n:784)
Birth head circumference (in cm)
a
(n:782)
NO
2
exposure period b (95% CI) Linearity (df)
b
b (95% CI) Linearity (df)
b
b (95% CI) Linearity (df)
b
Unadjusted
First trimester -3.564 (-23.698;16.570) L -0.092 (-0.177;-0.008) NL (4) -0.069 (-0.133;-0.004) L
Second trimester -4.464 (-25.175;16.248) NL (3) -0.050 (-0.137;0.037) NL (2) -0.071 (-0.137;-0.004) L
Third trimester -5.740 (-26.553;15.072) L -0.010 (-0.096;0.077) NL (4) -0.017 (-0.084;0.049) L
Whole pregnancy -5.792 (-30.065;18.481) NL (3) -0.063 (-0.165;0.038) L -0.074 (-0.152;0.003) L
Adjusted
c
First trimester -12.782 (-34.537;8.972) NL (3) -0.066 (-0.149;0.017) NL (4) -0.066 (-0.137;0.005) L
Second trimester -9.961 (-32.594;12.671) NL (4) -0.040 (-0.125;0.044) NL (3) -0.060 (-0.133;0.014) NL (3)
Third trimester -4.294 (-25.923;17.335) L -0.005 (-0.089;0.079) NL (2) -0.028 (-0.099;0.042) L
Whole pregnancy -9.729 (-33.218;13.760) L -0.047 (-0.146;0.052) NL(2) -0.058 (-0.134;0.018) NL (3)
* Estimates are expressed as the change in birth anthropometric measures for a 10 μ g/m
3
increase in the mean NO
2
levels at each woman’s residence during the
corresponding period. Unadjusted and adjusted models.
a
Standardized for gestational age.
b
Shape of the relationship after contrast between model with NO
2
in non-linear vs. linear form; L: linear; NL: non-linear (and degrees of freedom of the selected
model).
c
Adjusted for:
-Birth weight = mate rnal age, maternal pre-pregnancy weight, maternal height, paternal height, gestational weight gain, parity, maternal education, smoking
during pregnancy, country of origin, sex of the infant, and season of last menstrual period.
-Birth length = maternal age, maternal height, gestational weight gain, parity, maternal education, smoking during pregnancy, working status in the first
trimester, country of origin, and sex of the infant.
-Birth head circumference: maternal age, maternal pre-pregnancy weight, maternal height, gestational weight gain, parity, maternal education, smoking during
pregnancy, country of origin, sex of the infant, and season of last menstrual period.
Table 3 Association between individual exposure to ambient NO
2
>40 μg/m
3
in different time periods during
pregnancy and anthropometric measures at birth.*
Birth weight (in g)
a
(n:785)
Birth length (in cm)
a
(n:784)
Birth head circumference (in cm)
a
(n:782)
NO
2
exposure period b (95% CI) b (95% CI) b (95% CI)
Unadjusted
First trimester -24.309 (-78.256; 29.638) -0.300 (-0.526; -0.075) -0.104 (-0.276; 0.069)
Second trimester -9.648 (-65.156; 45.860) -0.100 (-0.333; 0.133) -0.173 (-0.352; 0.005)
Third trimester 28.325 (-26.475; 83.126) 0.150 (-0.079; 0.379) 0.051 (-0.123; 0.226)
Whole pregnancy -16.912 (-71.233; 37.410) -0.170 (-0.398; 0.058) -0.152 (-0.326; 0.022)
Adjusted
b
First trimester -40.349 (-96.267; 15.568) -0.271 (-0.514; -0.028) -0.074 (-0.257; 0.108)
Second trimester -37.546 (-96.231; 21.140) -0.190 (-0.447; 0.066) -0.177 (-0.368; 0.014)
Third trimester 26.656 (-28.239; 81.551) 0.077 (-0.161; 0.315) 0.011 (-0.167; 0.190)
Whole pregnancy -33.292 (-84.874; 18.290) -0.199 (-0.424; 0.027) -0.171 (-0.339; -0.003)
*Estimates are expressed as the change in birth anthro pometric measures comparing NO
2
exposure levels >40 μg/m
3
vs. exposure levels ≤40 μg/m
3
at each
woman residence during the corresponding period. Unadjusted and adjusted models.
a
Standardized for gestational age.
b
Adjusted for:
-Birth weight: maternal age, maternal pre-pregnancy weight, maternal height, paternal height, gestational weight gain, parity, maternal education, smoking
during pregnancy, country of origin, sex of the infant, and season of last menstrual period.
-Birth length: maternal age, maternal height, gestational weight gain, parity, maternal working status in the first trimester, smoking during pregnancy, country of
origin, sex of the infant, and season of last menstrual period.
-Birth head circumference: maternal age, maternal pre-pregnancy weight, maternal height, gestational weight gain, parity, maternal education, smoking during
pregnancy, working status in the third trimester, sex of the infant, and season of last menstrual period.
Ballester et al. Environmental Health 2010, 9:6
/>Page 5 of 11
Figure 2 Relationship between individual NO
2
exposure during the first trimester and a nthropometric measures at birth.Graphical
estimation of the association and 95% confidence intervals for the non-linear model with lower AIC (degrees of freedom: df). (A). Birth weight
(gr) and NO
2
exposure (3 df) B). Birth length (cm) and NO
2
exposure (4 df). (C). Birth head circumference (cm) and NO
2
exposure (4 df). Footnote
for Figure 2(C): For birth head circumference the model with the best adjustment was the linear model.
Ballester et al. Environmental Health 2010, 9:6
/>Page 6 of 11
exposure to NO
2
during pregnancy (Table 4). After
adjustment for potential confounders, a clearer associa-
tion e merged with the second trimester being the most
relevant window of exposure. A 10 μg/m
3
increase in
NO
2
during the second trimester was thus as sociated
with the risk of SGA-weight, OR: 1.37 (95%CI: 1.01-
1.85). For SGA-length the association es timate for the
same comparison was OR: 1.42 (95%CI: 0.89-2.25). No
significant improvement in the model was obtained with
non-linear models for SGA (Figure 3); therefore, we
have only included the results for the relationship with
NO
2
exposure as a continuous variable (Table 4).
Discussion
Results from this mother and child cohort living in a
large, heterogeneous area in Valencia, Spain, suggest an
association between maternal exposure to outdoor air
pollution and birth outcomes. The odds of being SGA-
weight increased by 37% when ambient NO
2
levels
increased 10 μg/m
3
during the second trimester of preg-
nancy. For anthropometric measures in continuous
form, an association with air pollution appeared for
women living i n zones wi th ambient N O
2
levels above
40 μg/m
3
. The first and second trimesters seem to be
the relevant window of exposure.
Results for the different air pollutants varied in the
different studies. Besides particulate matter (PM) [either
of diameter <10 μm-PM
10
-or<2.5μm-PM
2.5
-] and
carbon monoxide (CO), NO
2
appears as one of the pol-
lutants more frequently associated w ith birth outcomes.
In a previous review [2] we identified six articles
reporting associations between NO
x
or NO
2
with either
birth weight, low birth weight (LBW, measured a s birth
weight <2500 g), or SGA. The three articles that
included nitrogen oxides (NO
x
) were ecological in
design and used data from central monitors. None of
them found an association between NO
x
and birth
weight. For NO
2
, results from the literature r eviewed
suggested some association with birth weight, but were
still not conc lusive [8,25,26]. In r ecent years a consider-
able number of articles have been published in this field.
We have identified 12 articles studying the association
of NO
2
exposure with birth weight that were published
after our previous review (Additional file 2)
[10,12,27-36]. Of the four studies analyzing birth weight,
an association was found in three of them: Bell et al. in
Massachusetts and Connecticut (USA) [10], Mannes et
al. in Sydney (Australia) [32], and Gouveia and cols in
Brazil [29], but no relati onship was observed in the
Children’s Health Study [31]. Interestingly, all but one
of the articles [36] studying SGA found an asso ciation
with NO
2
; in the study in question, however, NO
2
was
the only pollutant studied to be associated with head
circumference. As an example, in their study in Vancou-
ver, Brauer et al. [35] estimated residential exposures to
air pollution and the risk of SGA. Of the seven air pol-
lutants s tudied, the association with NO
2
was t he most
robust. On the other hand, only three studies found an
association between LBW and NO
2
[10,28,35] . This dis-
crepancy may be due to the fact that the number of
cases of SGA is greater than that of LBW term babies,
which gives the study more statistical power. Moreover,
Table 4 Association between individual exposure to ambient NO
2
in different time periods during pregnancy and
Small for Gestational Age (SGA).*
SGA - weight
(n: 785)
SGA - length
(n:784)
NO
2
exposure period OR (95% CI) Linearity (df)
a
OR (95% CI) Linearity (df)
a
Unadjusted
First trimester 1.013 (0.992; 1.035) L 1.001 (0.968; 1.035) L
Second trimester 1.013 (0.992; 1.034) L 1.006 (0.972; 1.041) L
Third trimester 1.004 (0.983; 1.026) L 1.013 (0.979; 1.049) L
Whole pregnancy 1.014 (0.988; 1.040) L 1.010 (0.970; 1.052) L
Adjusted
b
First trimester 1.182 (0.894; 1.563) L 1.137 (0.741; 1.744) L
Second trimester 1.369 (1.013; 1.849) L 1.416 (0.890; 2.254) L
Third trimester 1.186 (0.906; 1.552) L 1.103 (0.750; 1.623) L
Whole pregnancy 1.281 (0.942; 1.743) L 1.230 (0.778; 1.945) L
*Estimates are expressed as the change in odds for SGA (birth weight) and SGA (birth length) for a 10 μg/m
3
increase in the mean NO
2
levels at each woman ’s
residence during the corresponding period. Unadjusted and adjusted models.
a
Shape of the relationship after contrast between model with NO
2
in non-linear vs. linear form; L: linear; NL: non-linear (and degrees of freedom of the selected
model).
b
Adjusted for:
-SGA in weight: maternal age, maternal pre-pregnancy weight, paternal height, gestational weight gain, parity, maternal education, country of origin, smoking
during pregnancy, and season of last menstrual period.
-SGA in length: maternal age, maternal pre-pregnancy weight, maternal education, parity, smoking during pregnancy, gestational weight gain, country of origin,
alcohol consumption during pregnancy, and season of last menstrual period.
Ballester et al. Environmental Health 2010, 9:6
/>Page 7 of 11
Figure 3 Relationship between individual NO
2
exposure during the second trimester and small for gestational age, in birth weight
and in birth length in a multivariate analysis. Graphical estimation of the association and 95% confidence intervals for the non-linear model
with lower AIC (degrees of freedom: df). A). Logit of small for gestational age in birth weight and NO
2
exposure (2 df). Footnote for Figure 3(A):
For SGA (in birth weight) the model with the best adjustment was the linear model. (B). Logit of small for gestational age in birth length and
NO
2
exposure (2 df). Footnote for Figure 3(B): For SGA (in birth length) the model with the best adjustment was the linear model.
Ballester et al. Environmental Health 2010, 9:6
/>Page 8 of 11
the use of SGA, calculated for each week of gestation,
enables the effect of gestational length to be more effec-
tively controlled than LBW, which is estimated simply
by selecting births that take place after a certain period
of gestation (i.e. between weeks 37- 44).
Few studies have examined the relation between air
pollution exposure during pregnancy and other anthro-
pometric indicators such as birth length or head circum-
ference (HC). Studies of two cohorts of pregnant women
in Poland and in New York described a relationship
between prenatal exposure to airborne polycyclic aro-
matic hydrocarbons (PAH) and fetal growth [37]. Regard-
ing prenatal NO
2
exposure and birth length or HC, a
birth register-based study assessed birth length and HC
among 26,617 term births in Brisbane, Australia [36]. An
IQR range increase in NO
2
(11.1 μg/m
3
), but not in other
pollutants, during the third trimester was associated with
a reduction in crown-heel length: -0.15 cm (95%CI: -0.25
to -0.05). Moreover, in the French Eden cohort [38] a
reduction of -0.31 cm in HC at birth was found when
comparing NO
2
exposure in the highest tertile (>31.4 μg/
m
3
) to that in the lowest tertile. Our results are consis-
tent with the findings of these two studies.
Up to now a clear window of susceptibility for growth
retardation has not been identified. In our study we
found that exposure during the first trimester is most
closely related to a d ecrease in birth weight and length.
In the case of SGA (both, in weight and in length) how-
ever, the strongest relationship was found with exposure
in the second trimester. Regarding reduced HC, when
exposure was evaluated above vs. below 40 μg/m
3
, expo-
sure throughout the pregnancy was the most clearly
related. This may indicate that exposure during the
entire pregnancy plays the most important role for
reduction in the growth of the infant head.
Very few studies have completely assessed the shape of
the relationship between air pollution exposure and repro-
ductive outcomes. Instead, most have analyzed the relation
using air pollution variables in the continuous form or
comparing only two levels. Some have attempted to exam-
ine the shape using tertiles or quartiles and observed an
increased risk of LBW at h igher quartiles [12,28]. R egarding
NO
2
exposure and birth weight, only Ha et al. [25] exam-
ined this relationship using GAM models, as did we in the
present study. In the former study, although the authors
considered the relationship to be relatively linear, a change
in the slope may be observed in the figures, with a higher
negative gradi ent aft er NO
2
values of around 32 ppb (60
μg/m
3
). In our study, w e found some indication of a r educ-
tion in birth l ength starting a t a threshold of approximately
40 μg/m
3
. For HC and the risk of SGA we found a mono-
tonic relationship with air pollution exposure.
The biological mechanisms by which air pollutants
may affect fetal growth are still unclear. There is some
evidence that NO
2
alters fetal growth and thus may play
a causal role. NO
2
is a potent oxidant and increased
lipid peroxidation in the maternal and/or fetal compart-
ment has been found in preterm births [39]. Tabacova
et al. investigated the relationship between exposure to
nitrogen-oxidizi ng species and pregnancy complications
in an area in Bulgaria highly polluted by oxidized nitro-
gen compounds [40]. Methemoglobin, a biomarker of
individual exposure, was determined, an d glutathione
balance and lipid peroxide levels were used as measures
of oxidant/antioxidant status. A high percentage of
women suffered from p regnancy complications, the
most common being anaemia (67%), threatened abor-
tion/premature labour (33%), and signs of preeclampsia
(23%). Methemoglobin was significantly elevated in all
three conditions, in comparison with normal pregnan-
cies. Reduced:tot al glutathione, an indicator of maternal
antioxidant reserves, decreased, whereas cell-damaging
lipid peroxide levels increased. More recently, Mohoro-
viz found similar results for methemoglobin in a pol-
luted area of Croatia [41]. These results suggest that
maternal exposure to environmental oxidants can
increase the risk of pregnancy complications through
stimulation of methemoglobin formation, which may
lead to hypoxia and hypoxemia in pregnant women and
has an important influence on maternal health as well
as on placental and fetal development.
Our study has several limitations. The number of
women participating in the study is small compared with
that in other studies. Subsequently, the power of the
study is fairly low and the estimates have wide confidence
intervals. In addition, we had no information available on
other important pollutants such as PM
10
,PM
2.5
,sulphur
dioxide (SO
2
), and CO, for which some associations with
fetal growth have been described in other studies. Conse-
quently, we cannot affirm that NO
2
is the air pollutant
definitively associated with birth measurements. Due to
the colinearity between pollutants, NO
2
may simply be a
proxy for other toxins. Still, NO
2
has been shown to be a
marker of air pollution from road traffic [42] and could
be a reasonable marker of ultrafine particulates or PAH
from this source. Unfortunately, we did not have infor-
mation on indoor levels of air pollutants. However we
did have information on environmental tobacco smoke
exposure, an important source of indoor air pollution,
and we controlled for this.
Notwithstanding the aforementioned weaknesses, our
study has several important strengths. In this prospec-
tive study we followed a pregnant cohort from early
pregnancy and assessed exposure, health outcom es, and
covariates in great detail. In addition, the statistical
approach using GAM models allows us to examine the
shape of the relationship while the use of robust meth-
ods permits the minimization of the influence of
Ballester et al. Environmental Health 2010, 9:6
/>Page 9 of 11
extreme values. Moreover, we developed a protocol
combining measurements from NO
2
passive samplers,
kriging, and LUR in order to obtain estimates of indivi-
dual exposure to ambient NO
2
for each woman. We
also performed four different campaigns to assess the
stability over time of the spatial NO
2
distribution in the
study area, as recommended by Ritz and Wilhelm [15].
Our method allowed us to address local heterogeneity
in order to assign an individual estimate of the expo-
sure, a problem that h as been reported to affect other
studies [15,30]. L astly, our study had access to detailed
information a bout each woman’ s residence throughout
pregnancy, including changes of location and address.
Conclusions
Findings from this mother and birth cohort study in
Valencia, Spain, suggest that prenatal exposure to out-
door air polluti on, measured as NO
2
, affects the anthro-
pometric development of the fetus, reducing its length
and he ad circumference and increasing the risk of hav-
ing a small for gestational age (in weight) baby.
We found an association between exposure to levels of
NO
2
above 40 μg/m
3
during the first trimester of preg-
nancy a nd a reduction in birth weight. This association
was only marginal for birth length.
For head circumference (HC) reduction and the risk
of SGA, a monotonic relationship with air pollution
exposure was observed. The relevant period of exposure
for the risk of SGA was the second trimester. Exposure
throughout the pregnancy played the most important
role in decreased HC.
Compared with other recent studies, NO
2
levels in the
study area occupy an intermediate position; therefore,
the results are not due to e xtreme exposure conditions.
Taking into account the relationship between fetal
growth reduction and child development a nd health,
strategies should be developed to reduce air pollution in
order to prevent these risks.
Additional file 1: Characteristics of pregnant women and their
association with birth outcomes in the INMA-Valencia cohort, 2003-
2006. Table with the distribution of the outcome variables among the
categories of the covariates at study.
Click here for file
[ />S1.DOC ]
Additional file 2: Results from studies assessing NO
2
effect on birth
weight published between 2003-2008. Table summarizing the design
and main results of studies published between 2003-2008 on air
pollution exposure during pregnancy that included NO2 as air pollution
indicator and birth weight.
Click here for file
[ />S2.DOC ]
Abbreviations
BMI: Body mass index; BSP: Black smoke particles; CI: confidence interval; CO:
carbon monoxide; GAM: generalized additive models; GIS: geographical
information system; HC: head circumference; INMA: Spanish Children’s
Health and Environment study; IQR: Interquartile range; LBW: low birth
weight (measured as birth weight <2500 g); LR: likelihood ratio; LUR: land
use regression; NO
2
: nitrogen dioxide; NO
x
: nitrogen oxides; OR: odds ratio;
PAH: polycyclic aromatic hydrocarbons; PM: particulate matter; PM
10
:
particulate matter of diameter <10 μm; PM
2.5
: particulate matter of diameter
<2.5 μm; ppb: parts per billion; PR: prevalence ratio; SES: socio-economic
status; SGA: small for gestational age; SO
2
: sulphur dioxide.
Acknowledgements
The authors give special thanks to the families in the study as well as to the
professionals that gave their support to this study.
Funding: Instituto de Salud Carlos III (G03/176), FIS-FEDER 03/1615, 04/1509,
04/1112 and 06/1213, and the Conselleria de Sanitat Generalitat Valenciana;
all in Spain.
Author details
1
Center for Public Health Research (CSISP), Conselleria de Sanitat, Avda
Catalunya 21, 46020, Valencia, Spain.
2
Spanish Consortium for Research on
Epidemiology and Public Health (CIBERESP), Doctor Aiguader 88, 08003,
Barcelona, Spain.
3
School of Nursing, Universitat de València, C Jaume Roig
s/n 46010, Valencia, Spain.
4
General Directorate of Public Health. Conselleria
de Sanitat, Avda Catalunya 21, 46020, Valencia, Spain.
5
Andalusian School of
Public Health (EASP), Campus de la Cartuja s/n, Granada, Spain.
6
Department
of Public Health, Rey Juan Carlos University, 28922, Alcorcón, Madrid, Spain.
Authors’ contributions
Authors contributed to the article as follows: FB conceived the study,
supervised the data collection and data analysis, and prepared the
manuscript. ME contributed to data collection, conducted the data analysis
of the association of interest, and helped with manuscript preparation. CI
prepared the outcome variables, developed the land use regression analysis,
assisted with data analysis, and helped with data interpretation and
manuscript preparation. SL, AE, RR, ML, and MR contributed to data
collection, provided critical revision of the manuscript, and helped with data
interpretation and manuscript preparation. All authors have read and given
final approval of the version to be published.
Competing interests
The authors declare that they have no competing interests.
Received: 23 October 2009
Accepted: 29 January 2010 Published: 29 January 2010
References
1. Sram RJ, Binkova B, Dejmek , Bobak M: Ambient air pollution and
pregnancy outcomes: a review of the literature. Environ Health Perspect
2005, 113:375-382.
2. Lacasana M, Esplugues A, Ballester F: Exposure to ambient air pollution
and prenatal and early childhood health effects. Eur J Epidemiol 2005,
20:183-199.
3. Maisonet M, Correa A, Misra D, Jaakkola JJ: A review of the literature on
the effects of ambient air pollution on fetal growth. Environ Res 2004,
95:106-115.
4. Glinianaia SV, Rankin J, Bell R, Pless-Mulloli T, Howel D: Particulate air
pollution and fetal health: a systematic review of the epidemiologic
evidence. Epidemiology 2004, 15:36-45.
5. Richards M, Hardy R, Kuh D, Wadsworth ME: Birth weight, postnatal
growth and cognitive function in a national UK birth cohort. Int J
Epidemiol 2002, 31:342-348.
6. Barker DJ: The origins of the developmental origins theory. J Intern Med
2007, 261:412-417.
7. Woodruff TJ, Parker JD, Darrow LA, Slama R, Bell ML, Choi H, Glinianaia S,
Hoggatt KJ, Karr CJ, Lobdell DT, Wilhelm M: Methodological issues in
Ballester et al. Environmental Health 2010, 9:6
/>Page 10 of 11
studies of air pollution and reproductive health. Environ Res 2009,
109:311-320.
8. Wilhelm M, Ritz B: Residential proximity to traffic and adverse birth
outcomes in Los Angeles County, California, 1994-1996. Environ Health
Perspect 2003, 111:207-216.
9. Parker JD, Woodruff TJ, Basu R, Schoendorf KC: Air pollution and birth
weight among term infants in California. Pediatrics 2005, 115:121-128.
10. Bell ML, Ebisu K, Belanger K: Ambient air pollution and low birth weight
in Connecticut and Massachusetts. Environ Health Perspect 2007,
115:1118-1124.
11. Perera FP, Rauh V, Tsai WY, Kinney P, Camann D, Barr D, Bernert T,
Garfinkel R, Tu YH, Diaz D, Dietrich J, Whyatt RM: Effects of transplacental
exposure to environmental pollutants on birth outcomes in a
multiethnic population. Environ Health Perspect 2003, 111:201-206.
12. Slama R, Morgenstern V, Cyrys J, Zutavern A, Herbarth O, Wichmann HE,
Heinrich J: Traffic-related atmospheric pollutants levels during pregnancy
and offspring’s term birth weight: a study relying on a land-use
regression exposure model. Environ Health Perspect 2007, 115:1283-1292.
13. Choi H, Rauh V, Garfinkel R, Perera FP: Prenatal exposure to airborne
polycyclic aromatic hydrocarbons and risk of intrauterine growth
restriction. Environ Health Perspect 2008, 116:658-665.
14. Basu R, Woodruff TJ, Parker JD, Saulnier L, Schoendorf KC: Comparing
exposure metrics in the relationship between PM
2.5
and birth weight in
California. J Expo Anal Environ Epidemiol 2004, 14:391-396.
15. Ritz B, Wilhelm M: Ambient air pollution and adverse birth outcomes:
methodologic issues in an emerging field. Basic Clin Pharmacol Toxicol
2008, 102:182-190.
16. Slama R, Darrow L, Parker J, Woodruff TJ, Strickland M, Nieuwenhuijsen M,
Glinianaia S, Hoggatt KJ, Kannan S, Hurley F, Kalinka J, Srám R, Brauer M,
Wilhelm M, Heinrich J, Ritz B: Meeting report: atmospheric pollution and
human reproduction. Environ Health Perspect 2008, 116:791-798.
17. Jerrett M, Shankardass K, Berhane K, Gauderman WJ, Kunzli N, Avol E,
Gilliland F, Lurmann F, Molitor JN, Molitor JT, Thomas DC, Peters J,
McConnell R: Traffic-related air pollution and asthma onset in children: a
prospective cohort study with individual exposure measurement. Environ
Health Perspect 2008, 116:1433-1438.
18. Brunekreef B: Health effects of air pollution observed in cohort studies in
Europe. J Expo Sci Environ Epidemiol 2007, 17(Suppl 2):S61-S65.
19. Ribas-Fito N, Ramon R, Ballester F, Grimalt J, Marco A, Olea N, Posada M,
Rebagliato M, Tardon A, Torrent M, Sunyer J: Child health and the
environment: the INMA Spanish Study. Paediatr Perinat Epidemiol 2006,
20:403-410.
20. Lindsay RS, Hanson RL, Bennett PH, Knowler WC: Secular trends in birth
weight, BMI, and diabetes in the offspring of diabetic mothers. Diabetes
Care 2000, 23:1249-1254.
21. Carrascosa A, Yeste D, Copil A, Almar J, Salcedo S, Gussinye M:
[Anthropometric growth patterns of preterm and full-term newborns
(24-42 weeks’ gestational age) at the Hospital Materno-Infantil Vall
d’Hebron (Barcelona)(1997-2002]. An Pediatr (Barc) 2004, 60:406-416.
22. Iñiguez C, Ballester F, Estarlich M, Fernandez-Patier R, Aguirre-Alfaro A,
Esplugues A, INMA Study group Valencia: Estimation of personal NO
2
exposure in a cohort of pregnant women. Sci Total Environ 2009,
15:6093-6099.
23. Abrams B, Altman SL, Pickett KE: Pregnancy weight gain: still
controversial. Am J Clin Nutr 2000, 71(Suppl 5):S1233-S1241.
24. World Health Organization: . WHO air quality guidelines for particulate
matter, ozone, nitrogen dioxide and sulfur dioxide. Global update 2005
Geneva, Switzerland: WHO 2006, 15.
25. Ha EH, Hong YC, Lee BE, Woo BH, Schwartz J, Christiani DC: Is air pollution
a risk factor for low birth weight in Seoul? Epidemiology 2001, 12:643-648.
26. Maroziene L, Grazuleviciene R: Maternal exposure to low-level air
pollution and pregnancy outcomes: a population-based study. Environ
Health 2002, 1:6.
27. Liu S, Krewski D, Shi Y, Burnett RT: Association between gaseous ambient
air pollutants and adverse pregnancy outcomes in Vancouver, Canada.
Environ Health Perspect 2003, 111:1773-1778.
28. Lee BE, Ha EH, Park HS, Kim YJ, Hong YC, Kim H, Lee JT: Exposure to air
pollution during different gestational phases contributes to risks of low
birth weight. Hum Reprod 2003, 18:638-643.
29. Gouveia N, Bremner SA, Novaes HM: Association between ambient air
pollution and birth weight in Sao Paulo, Brazil. J Epidemiol Community
Health 2004, 58:11-17.
30. Wilhelm M, Ritz B: Local variations in CO and particulate air pollution and
adverse birth outcomes in Los Angeles County, California, USA. Environ
Health Perspect 2005, 113:1212-1221.
31. Salam MT, Millstein J, Li YF, Margolis HG, Gilliland FD: Birth outcomes and
prenatal exposure to ozone, carbon monoxide, and particulate matter:
results from the Children’s Health Study. Environ Health Perspect 2005,
113:1638-1644.
32. Mannes T, Jalaludin B, Morgan G, Lincoln D, Sheppeard V, Corbett S: Impact
of ambient air pollution on birth weight in Sydney, Australia. Occup
Environ Med 2005, 62:524-530.
33. Liu S, Krewski D, Shi Y, Chen Y, Burnett RT: Association between maternal
exposure to ambient air pollutants during pregnancy and fetal growth
restriction. J Expo Sci Environ Epidemiol 2007, 17:426-432.
34. Hansen C, Neller A, Williams G, Simpson R: Maternal exposure to low
levels of ambient air pollution and preterm birth in Brisbane, Australia.
BJOG 2006, 113:935-941.
35. Brauer M, Lencar C, Tamburic L, Koehoorn M, Demers P, Karr C: A cohort
study of traffic-related air pollution impacts on birth outcomes. Environ
Health Perspect 2008, 116:680-686.
36. Hansen C, Neller A, Williams G, Simpson R:
Low levels of ambient air
pollution during pregnancy and fetal growth among term neonates in
Brisbane, Australia. Environ Res 2007, 103:383-389.
37. Choi H, Jedrychowski W, Spengler J, Camann DE, Whyatt RM, Rauh V,
Tsai WY, Perera FP: International studies of prenatal exposure to
polycyclic aromatic hydrocarbons and fetal growth. Environ Health
Perspect 2006, 114:1744-1750.
38. Slama RS, Sinno-Teller S, Thiébaugeorges O, Goua V, Forhan A, Ducot B,
Annesi-Maesano I, Heinrich J, Schweitzer M, Magnin G, Bouyer J,
Kaminski M, Charles MA, Eden Study Group: Relation between
atmospheric pollutants and head circumference in utero and at birth: a
cohort study relying on ultrasound imaging during pregnancy.
Epidemiology 2006, 17:S129-S130.
39. Moison RM, Palinckx JJ, Roest M, Houdkamp E, Berger HM: Induction of
lipid peroxidation of pulmonary surfactant by plasma of preterm babies.
Lancet 1993, 341:79-82.
40. Tabacova S, Balabaeva L, Little RE: Maternal exposure to exogenous
nitrogen compounds and complications of pregnancy. Arch Environ
Health 1997, 52:341-347.
41. Mohorovic L: The level of maternal methemoglobin during pregnancy in
an air-polluted environment. Environ Health Perspect 2003, 111:1902-1905.
42. Clougherty JE, Wright RJ, Baxter LK, Levy JI: Land use regression modeling
of intra-urban residential variability in multiple traffic-related air
pollutants. Environ Health 2008, 7:17.
doi:10.1186/1476-069X-9-6
Cite this article as: Ballester et al.: Air pollution exposure during
pregnancy and reduced birth size: a prospective birth cohort study in
Valencia, Spain. Environmental Health 2010 9:6.
Submit your next manuscript to BioMed Central
and take full advantage of:
• Convenient online submission
• Thorough peer review
• No space constraints or color figure charges
• Immediate publication on acceptance
• Inclusion in PubMed, CAS, Scopus and Google Scholar
• Research which is freely available for redistribution
Submit your manuscript at
www.biomedcentral.com/submit
Ballester et al. Environmental Health 2010, 9:6
/>Page 11 of 11