Báo cáo khoa học: Physicochemical properties and distinct DNA binding capacity of the repressor of temperate Staphylococcus aureus phage /11 doc
Bạn đang xem bản rút gọn của tài liệu. Xem và tải ngay bản đầy đủ của tài liệu tại đây (416.35 KB, 11 trang )
Physicochemical properties and distinct DNA binding
capacity of the repressor of temperate
Staphylococcus aureus phage /11
Tridib Ganguly*, Malabika Das*, Amitava Bandhu, Palas K. Chanda, Biswanath Jana, Rajkrishna
Mondal and Subrata Sau
Department of Biochemistry, Bose Institute, Calcutta, India
The basic regulatory elements that most temperate
phages use for the establishment and maintenance of
their lysogeny are the phage-encoded repressor and the
cognate operator DNA [1–12]. A temperate phage
generally enters into the lysogenic life cycle once
its repressor inhibits the transcription of the phage-
specific lytic genes from the early promoter by binding
to the overlapped operator DNA. Repressors of the
temperate phages, although varying greatly in size and
in primary sequence level, mostly harbor a DNA bind-
ing domain and an oligomerization domain. The size
and type of the operator DNAs also vary from phage
to phage. Although some repressors bind to operators
with dyad symmetry [1,5–9] or operators with direct
repeats [10], other repressors bind to asymmetric oper-
ators [2,3,11–13] to establish lysogeny. Interestingly,
the repressor of Vibrio cholerae phage CTX/ binds to
extended operators, stopping lytic growth, as well as
ensuring lysogeny of this phage [4]. Although these
regulatory elements have enriched both basic and
applied molecular biology enormously, they have not
been cloned from most temperate phages or character-
ized in any depth.
The temperate Staphylococcus aureus phage /11 [14]
harbors the cI and cro genes in a divergent orientation
to that in lambdoid phages [1,8]. The sequence of the
immunity region of /11, however, differs significantly
from those of the lambdoid phages and other temper-
Keywords
dimer; major groove; operator; phage /11;
repressor (CI)
Correspondence
S. Sau, Department of Biochemistry, Bose
Institute, P1 ⁄ 12 – CIT Scheme VII M,
Calcutta 700 054, India
Fax: +91 33 2355 3886
Tel: +91 33 2569 3200
E-mail:
*These authors contributed equally to this
work
(Received 20 November 2008, revised 16
January 2009, accepted 21 January 2009)
doi:10.1111/j.1742-4658.2009.06924.x
The repressor protein and cognate operator DNA of any temperate Staph-
ylococcus aureus phage have not been investigated in depth, despite having
the potential to enrich the molecular biology of the staphylococcal system.
In the present study, using the extremely pure repressor of temperate
Staphylococcus aureus phage /11 (CI), we demonstrate that CI is composed
of a-helix and b-sheet to a substantial extent at room temperature, pos-
sesses two domains, unfolds at temperatures above 39 °C and binds to two
sites in the /11 cI-cro intergenic region with variable affinity. The above
CI binding sites harbor two homologous 15 bp inverted repeats (O1 and
O2), which are spaced 18 bp apart. Several guanine bases located in and
around O1 and O2 demonstrate interaction with CI, indicating that these
15 bp sites are used as operators for repressor binding. CI interacted with
O1 and O2 in a cooperative manner and was found to bind to operator
DNA as a homodimer. Interestingly, CI did not show appreciable binding
to another homologous 15 bp site (O3) that was located in the same
primary immunity region as O1 and O2. Taken together, these results sug-
gest that /11 CI and the /11 CI–operator complex resemble significantly
those of the lambdoid phages at the structural level. The mode of action of
/11 CI, however, may be distinct from that of the repressor proteins of k
and related phages.
Abbreviations
CI, repressor of temperate Staphylococcus aureus phage /11; CTD, C-terminal domain; DMS, dimethyl sulfate; DTNB, 5,5¢-dithiobis-(2-
nitrobenzoic acid); NTD, N-terminal domain.
FEBS Journal 276 (2009) 1975–1985 ª 2009 The Authors Journal compilation ª 2009 FEBS 1975
ate S. aureus phages, such as /PVL, /13, /53, 3A, 77
and /Sa3ms [14–17]. By contrast, the 239 amino acid
product of the /11 cI gene shows a moderate homol-
ogy over the entire length of the k repressor. Interest-
ingly, although the sequences of the C-terminal ends of
the above S. aureus phage repressors are identical, the
sequences of their N-terminal ends vary considerably
[15]. The predicted secondary structures of the repres-
sors of S. aureus phages show a notable similarity to
that of k repressor, especially at the C-terminal ends.
As noted with the C-terminal end of k repressor [1],
the C-terminal ends of the repressors of S. aureus
phages may be involved in oligomerization. The N-ter-
minal half of /11 repressor carries a putative helix-
turn-helix DNA binding motif similar to that of
lambdoid phages, indicating that this half of the /11
repressor most likely participates in the binding of
operator DNA. An N-terminal histidine-tagged form
of the repressor of temperate S. aureus phage /11 (CI)
was overexpressed in Escherichia coli and was purified
to some extent [15]. An additional 19 kDa protein
was always co-purified at a low level along with the
intact 31 kDa repressor. This smaller protein, found
to comprise the N-terminal end fragment of repressor,
was most possibly the result of cleavage of the repres-
sor at its alanine–glycine site. The histidine-tagged
repressor, however, was shown to form dimers in solu-
tion and bind to two sites in the /11 cI-cro intergenic
region. Two homologous 15 bp inverted repeats with
partial two-fold symmetry, identified in the /11 cI-cro
intergenic region, were suggested to act as operator
sites because synthetic DNA fragments carrying either
repeat showed appreciable binding to CI [15]. Little is
known about the structures of /11 CI, its cognate
operators and CI–operator complex, the precise bind-
ing affinity of CI to the two operators, and the mecha-
nism of action of CI. In the present study, we report
the purification of /11 CI to near homogeneity and,
for the first time, present evidence for the two-domain
structure, its thermolability and the binding of CI to
two 15 bp operator sites in the cI-cro intergenic region
with variable affinity. We also suggest putative tertiary
structures for the domains of both the CI and the
CI–operator complex.
Results and Discussion
Purification, physicochemical properties and
structure of CI
To purify CI to homogeneity, we subjected affinity
column chromatography-purified CI [15] to gel filtra-
tion chromatography (for details, see Experimental
procedures), analyzed the resulting protein containing
elution fractions by 13.5% SDS ⁄ PAGE (Fig. 1A) and
found that only fractions F2 and F3 (loaded in lanes 2
and 3) contain intact CI with an estimated purity of
almost 98%. The overall yield of CI was approxi-
mately 1 mgÆL
)1
of induced E. coli culture. Because
the above highly-purified CI did not show any degra-
dation upon storage on ice for more than 1 month and
possessed operator DNA binding activity (described
below), it was utilized in all the in vitro experiments
performed in the present study.
To map the possible flexible region or domain struc-
ture in CI, we performed a partial proteolysis of CI by
trypsin and found that protein fragments I and II were
the two major products generated from CI at a very
early stage of the enzymatic cleavage (Fig. 1B). Both
the fragments remained mostly undigested throughout
the entire period of digestion. Interestingly, limited
proteolysis of CI with chymotrypsin also generated a
similar digestion pattern (data not shown). Neither of
the above fragments interacted with anti-(his Ig) (data
not shown), indicating the loss of the N-terminal histi-
dine tag from CI immediately after exposure to the
enzyme. The first three N-terminal end amino acid
residues of fragment I were determined to be LVS
(corresponding to amino acid residues 156–158 of CI),
suggesting that it belonged to the C-terminal end of
CI. The fragment I most possibly harbors residues
156–276 of CI, with a molecular mass of 13.3 kDa.
The fragment II, having a molecular mass of almost
12.14 kDa (as shown by MALDI-TOF analysis), might
originate from the N-terminal end of CI because the
intensity of fragment I did not decrease with time. The
N-terminal end sequencing of one of the chymotryp-
sin-digested fragments revealed that the junction region
between the C-terminal end of the histidine tag and
the N-terminal end of the native /11 repressor (which
carries both chymotrypsin and trypsin cleavage sites) is
exposed to the surface of the CI. Taken together, this
suggests that the histidine-tagged CI carries two flexi-
ble regions: one at the N-terminal end and another
almost at the middle of the molecule. Tryptic digestion
of CI at the above two regions yielded two extremely
folded structures or domains [designated N-terminal
domain (NTD) and C-terminal domain (CTD)] of CI
where the majority of the thirty four trypsin cleavage
sites are buried. The two-domain structure of /11 CI
monomer therefore approximately resembles that of k
CI and related repressor monomers [1,8]. Interestingly,
the putative tertiary structure of the CTD of the /11
repressor (Fig. 1C), modeled using amino acid residues
119–238 of the native /11 repressor (equivalent to
residues 156–275 of fragment I), indeed showed
Characterization of /11 repressor T. Ganguly et al.
1976 FEBS Journal 276 (2009) 1975–1985 ª 2009 The Authors Journal compilation ª 2009 FEBS
remarkable structural resemblance to the LexA CTDs
(r.m.s.d. = 0.46 A
˚
) [18] and to k CI CTD (r.m.s.d. =
1.09 A
˚
) [19]. Similarly, the NTD (Fig. 1D) generated
with residues 10–69 of the native /11 repressor exhib-
ited structural similarity to a putative DNA-binding
protein from Bacteriodes fragilis (r.m.s.d. = 0.06 A
˚
)
and to the NTD of k CI (r.m.s.d. = 1.43 A
˚
) [20].
The CD spectrum of /11 CI showed a peak of large
negative ellipticity at 208 nm and 25 °C, indicating
the presence of a-helix in CI at room temperature
(Fig. 1E). Analysis of the spectrum by CD neural
networks [21] revealed approximately 23.6% a-helix
and 18.5% b-sheet in CI at 25 °C. The above CD data
are as expected because the NTD and CTD of /11 CI
are mostly composed of a-helix and b-sheet
(Fig. 1C,D). The peaks in the CD spectra of CI at
208 nm, however, were reduced substantially once the
incubation temperature of CI was raised above 39 °C
(Fig. 1C). The plot of molar ellipticity at 222 nm ver-
sus the incubation temperature (Fig. 1C, inset) shows
that the melting temperature of CI is close to 41 °C.
At this temperature, the concentration ratio of native
12345678
30
25
20
15
30
25
20
15
10
15
10
5
0
–5
–10
–15
–20
[θ] × 10
–3
deg·cm
2
·dmol
–1
200 220
25 º & 39 ºC
40 ºC
48 ºC
Temp (ºC)
T
m
25
–14
–10
Ellipticity
(222 nM)
–6
≈
33 41 49
Wavelen
g
th (nm)
240 260
Min
0º
5º
15º
30º
60º
90º
120º
150º
180º
kDa
Tr y
I
II
–+++++ +++
kDa
41ºC
AD
E
B
C
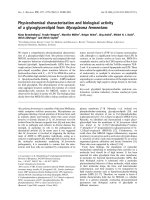
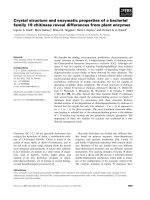
Fig. 1. Purification and properties of /11 CI. (A) The protein-containing elution fractions from different chromatographys were analyzed by
13.5% SDS ⁄ PAGE (for details, see Experimental procedures). Almost 10 lg of protein was loaded in each lane. Lane 1, elution fraction from
affinity chromatography; lanes 2–8, elution fractions F2 to F8. Molecular masses (kDa) of the marker protein bands are shown to the right of
the gel. (B) Approximately 4 lg of CI was incubated with 16 ng of trypsin (Try) at 25 °Cin20lL of buffer C and aliquots, withdrawn at the
indicated time intervals, were analyzed by Tris–Tricine 15% SDS ⁄ PAGE. Molecular masses (kDa) of marker proteins are shown to the right
of the gel. For some unknown reason, Try-generated fragments I and II showed a 3–4 kDa higher molecular mass than their actual masses.
(C) Schematic tertiary structure of CTD of /11 CI. The ribbons, helices and tubes represent a-helices, b-sheets and loops, respectively. (D)
Schematic representation of NTD of /11 CI; notation as in (C). (E) Far-UV CD-spectra of 10 l
M repressor in 200 lL of buffer C, were mea-
sured at temperatures in the range 25–48 °C. Spectra obtained at 25, 39, 40 and 48 °C are shown. The inset shows the plot of the molar
ellipticity (h) values at 222 nm (obtained from the above CD spectra) versus the incubation temperatures of CI. The melting temperature (T
m
)
of CI is also indicated.
T. Ganguly et al. Characterization of /11 repressor
FEBS Journal 276 (2009) 1975–1985 ª 2009 The Authors Journal compilation ª 2009 FEBS 1977
and denatured CI is 1. The data therefore suggest that
the a-helical content of CI, which decreases at temper-
atures above 39 °C, might be responsible for the alter-
ation of the conformation of CI, as well as the
reduced operator DNA binding affinity of CI [15]. /11
CI, although structurally similar, is more thermosensi-
tive than k repressor [22]. The biological significance
of this phenomenon is not known with any certainty.
However, we found that the alanine and proline con-
tents in /11 CI are significantly less than that in
k repressor. Several studies have demonstrated that a
higher alanine and ⁄ or proline content contributes sig-
nificantly to the enhanced thermostability of various
proteins, including phage repressor [22–24].
/11 CI carries three cysteine residues at positions 125,
159 and 207 [14]. To obtain clues about the status (bur-
ied versus exposed) of these cysteine residues, we deter-
mined the free sulfhydryl group content in CI by the
5,5¢-dithiobis-(2-nitrobenzoic acid) (DTNB) test and
found that the number of free thiols in CI is almost 1.5,
indicating that two cysteine residues are partially
exposed to its surface. The putative surface structure of
CTD of /11 CI (data not shown) reveals that cysteine
125 and cysteine 207 are approximately 27% and 30%
surface exposed, respectively, whereas, cysteine 159 is
mostly buried. The former two cysteine residues most
likely showed reactivity with DTNB. Interestingly, k CI
also harbors three cysteine residues in its CTD, but none
of them are exposed to the surface [25].
Cooperative binding of CI to two sites in the /11
cI-cro intergenic region
To identify the precise location of the repressor binding
sites in the primary immunity region of /11 (Fig. 2A),
we performed a DNase I footprinting experiment using
200 nm CI and radioactively labeled O DNA (Fig. 2B).
The footprints of both the top and bottom strands of O
DNA reveal that two regions in O DNA became resis-
tant to digestion by DNase I in the presence of CI. More
precisely, the )21 to )48 and )52 to )87 regions of
the top strand and )24 to )53 and )58 to )87 regions of
the bottom strand were protected by CI (Fig. 3B). The
centers of these two sites harbor the 15 bp O1 and O2,
which are the two putative CI binding sites [15].
Previously, we reported that the binding affinity of CI
to O1 DNA is slightly higher than that to O2 DNA [15].
To determine the relative affinities of the repressor to
O1 and O2 sites more accurately, we again performed
gel shift assays using a repressor of better quality and
smaller O1 and O2 DNA fragments. As expected, both
O1 (Fig. 2C) and O2 (Fig. 2D) yielded one shifted com-
plex with increasing CI concentrations. From the plot of
percent operator bound versus CI concentration
(Fig. 2E), the CI concentrations that gave 50% satura-
tion of input O1 and O2 DNAs (i.e. the apparent equi-
librium dissociation constants) were calculated to be
almost 32 nm and 120 nm, respectively. Thus, CI binds
to O1 nearly four-fold more strongly than to O2.
During the course of the present study, we identified
eight additional 15 bp inverted repeats in the /11 gen-
ome sequence [including one (designated O3) in the /11
cI-cro intergenic region; Figs 2A and 3B], which showed
60% or more identity with O1. The O3 site is located
31 bp upstream of O2. Surprisingly, CI was found to
bind to O3 DNA (Fig. 2F) at concentrations that are
required for its binding to S. aureus cspC DNA carrying
no operator (Fig. 2G). An additional gel shift assay
(Fig. 2H) using labeled O DNA and higher CI concen-
trations showed that CI does not bind to O3, even in the
presence of O1 and O2. The data therefore indicate that
binding of CI to O3 is nonspecific in nature. Interest-
ingly, /11 Cro that neither binds to O1 or O2 demon-
strates specific binding to O3 DNA [26].
To determine whether the binding of CI to O1 and O2
is cooperative in nature, we also studied the equilibrium
binding of CI to radiolabeled O1O2 DNA by a gel shift
assay. It was found that the O1O2 DNA formed two
shifted complexes (1 and 2) with increasing CI concen-
trations (Fig. 2I). The complex 1 appears at 3nm,
reaching a maximum at 46 nm and starts disappear-
ing at higher CI concentrations. By contrast, complex 2
is barely detectable at 10 nm and starts appearing as
the predominant form only when the intensity of com-
plex 1 declines at more than 50 nm CI. Complex 1
was estimated to contain 36% of the labeled O1O2
DNA at 46 n
m CI (Fig. 2J). Under these conditions, the
extent of labeled O1O2 DNA that remained in free form
or was retained in complex 2 was determined to be
approximately 30%. Using the above data, the cooper-
ativity parameter was calculated to be approximately 5
(for details, see Experimental procedures), indicating
that binding of CI to O1 causes an approximately five-
fold increase of the binding affinity of CI to O2, which is
18 bp away from the former operator (Fig. 3B).
Only 15 bp O1 and O2 interact with CI
To confirm that the 15 bp O1 and O2 operators inter-
act with CI, we performed the guanine base-specific
dimethyl sulfate (DMS) protection assay in the
presence ⁄ absence of saturating amounts of CI and
32
P-labeled O DNA (Fig. 3A). Only the guanine
base-specific methylation experiment was chosen
because both the operators were found to carry more
than one guanine base (Fig. 3B). The results revealed
Characterization of /11 repressor T. Ganguly et al.
1978 FEBS Journal 276 (2009) 1975–1985 ª 2009 The Authors Journal compilation ª 2009 FEBS
cl
O3
O
O1O2
O2
O3
O1
O1
O2
O2
O3
120
100
80
60
40
20
0
0 75 150 225 300 375 450
Bottom Top
2
1
*
O1
O1
O2
O1
O
2
G
0
15
0
0
0
3
10
25
50
75
100
50
100
250
500
1000
0
50
100
250
500
1000
0
50
100
250
500
75
% Operator
bound
100
125
150
175
200
300
400
30
40
50
60
70
100
125
150
A+G
[CI]
[CI]
A
B
C
D
E
FI
J
G
H
(n
M
)
[CI] (n
M
)
[CI] (n
M
)
[CI]
(n
M
)
[CI]
(n
M
)
O1O2
100
75
f
2
1
50
25
% O1O2
0
0 15 30 45 60 75 90 105
CI
(n
M
)
CI
(n
M
)
CI
(n
M
)
O
cspC
–+
–+
[CI]
O2 O1
cro
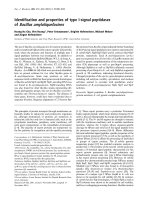
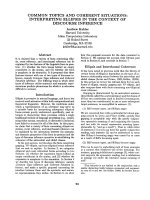
Fig. 2. DNA–protein interaction. (A) A schematic representation of the primary immunity region of /11 (not drawn to scale). The coding
regions of cI and cro genes (divergent arrows), the 15 bp O1, O2 and O3 operator sites (gray boxes) in the cI-cro intergenic region, and the
different DNA fragments of the immunity region (black horizontal bars), which were utilized in the gel shift or footprint assays, are shown.
(B) Autoradiograms of DNase I footprints. O DNA labeled (with
32
P) at the top (Top) or bottom (Bottom) strand was incubated with (+) ⁄ with-
out ()) 200 n
M CI, digested with DNase I and the resulting DNA fragments were resolved through urea ⁄ 6% PAGE. The guanine (G) and
adenosine + guanine (A + G) markers were generated from labeled O DNA by standard methods. Locations of the 15 bp O1 and O2 sites
within the protected regions are indicated by solid bars. (C, D, F–I) Autoradiograms of different gel shift assays. Each autoradiogram repre-
sents the gel shift assay with a specific
32
P-labeled DNA (noted in the left bottom corner) and the indicated amounts of CI. All gel shift
assays were performed three of four times and only representative data are presented. The arrow and asterisk indicate the shifted complex
and contaminating band, respectively. (E) Using the scanned data from the autoradigrams (C, D), plots of percent operator bound versus
repressor concentration were generated. Curves O1 and O2 denote the equilibrium binding of CI to O1 and O2 DNA respectively. (J). Coop-
erative binding: the operator DNA contents in the shifted complexes 1 and 2 and in the unbound labeled O1O2 DNA were determined by
scanning the intensities of all the bands shown in the autoradiogram of the gel shift assay (I) and plotted against the respective repressor
concentrations. Curves 1, 2 and f denote the status of O1O2 DNA concentrations in complexes 1 and 2 and in the unbound state. The maxi-
mum amount of bound operator in complex 1 was estimated from curve 1. The amounts of operator in complex 2 and in the unbound state
at the condition of maximum bound operator in complex 1 were determined from curves 2 and f, respectively. All these values were used
for calculation of the cooperativity parameter by a standard method (see Experimental procedures). All curves are best-fit curves.
T. Ganguly et al. Characterization of /11 repressor
FEBS Journal 276 (2009) 1975–1985 ª 2009 The Authors Journal compilation ª 2009 FEBS 1979
that the intensities of six bottom strand guanine bases
and five top strand guanine bases of O DNA are
decreased notably in the presence of CI. The guanines
protected by CI correspond to )41G, )43G, )63G,
)67G, )74G and )76G (bottom strand) and )33G,
)35G, )46G, )56G and )68G (top strand) (Fig. 3B).
All the protected guanine bases except )56G are
located in and around O1 and O2. Interestingly,
)35G, )41G and )43G in O1 and )68G, )74G and
)76G in O2 are conserved. The )40G in O1 and )73G
in O2, although conserved, most likely do not interact
with the CI. The data, however, confirm that 15 bp O1
and O2 DNAs are involved in the binding of CI. The
intensities of some top ()53G) and bottom ()36G and
)49G) strand guanine bases were also increased nota-
bly, suggesting that these bases became more exposed
as a result of a conformational change of the operator
DNA upon CI binding. The N7 group of guanine,
which is methylated by DMS, is exposed in the major
groove of the DNA helix [1]. Therefore, the data also
suggest that the interaction between CI and the opera-
tor DNA may occur through the major groove of the
operator DNA helix.
The absence of detectable interaction between O3
and /11 CI (as evident from both the gel shift and
footprint assays) is quite unexpected because the pri-
mary immunity regions of phages k [1], P22 [12], 434
[8], A2 [27], /g1e [28], HK022 [6] and N15 [29] bear
more than two CI binding sites. Lactococcal phage
Tuc2009 [30] and S. aureus /Sa3ms [17], however, bear
two CI binding sites, similar to that of /11 in the
cI-cro intergenic region. Transcription of k cI mRNA
from P
RM
, which overlaps O
R
2 and O
R
3, was shown
to be positively regulated by k CI [1]. At very high
concentrations, k CI binds to O
R
3, which in turn
inhibits the expression of k cI transcripts. The )35
element of promoter of /11 cI was found to partly
overlap with the 15 bp O2 site (data not shown).
Taken together, this suggests that the transcription of
/11 cI is most possibly regulated by O2 alone and O3
is needed merely to stop the transcription of /11 cI by
/11 Cro (which favors the lytic development of /11).
Binding stoichiometry
To determine the CI binding stoichiometry precisely,
we performed glutaraldehyde-mediated crosslinking
experiments with CI in the presence ⁄ absence of varying
amounts of O1 DNA. As shown in Fig. 4A, dimeric
CI is the predominant form formed in the presence of
O1 DNA. Although the tetrameric and hexameric
forms of CI (formed without O1 DNA) disappeared, a
small amount of monomeric CI reappeared in the
presence of O1 DNA. The reason for the presence of
[CI]
AB
[CI]
+
*
*
*
*
*
**
*
To p
Bottom
O1
O2
O2
cl
O3
O2
cro
O1
O1
+––
–140
5'CATTTTCTTACCTCCTTAAATTTACCTATAGTATAACCCAATTATTTTTGGTATTCA
GTAAAAGAATGGAGGAATTTAAATGGATATCATATTGGGTTAATAAAAACCATAAGT
ACAAAAAAATACACGAAAAGCAAACTTTTATGTTGACTCAAGTACACGTATCGTGTAT
TGTTTTTTTATGTGCTTTTCGTTTGAAAATACAACTGAGTTCATGTGCATAGCACATA
AGTAGGTTTTGTAAGCGGGAGGTGACAACATG
TCATCCAAAACATTCGCCCTCCACTGTTGTAC 5'
–130 –120 –110 –100 –90
–80
–70
–20
–10
+1
–60 –50 –40 –30
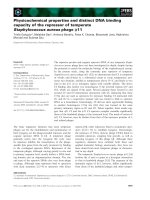
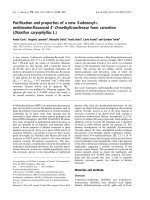
Fig. 3. Interaction of CI with 15 bp operator DNA. (A) Autoradiograms of DMS protection footprints. O DNA labeled at the top (Top) or
bottom (Bottom) strand was incubated with (+) ⁄ without ()) 0.25 l
M CI followed by treatment of the reaction mixture with DMS as described
in the Experimental procedures. Solid bars indicate the locations of O1 and O2 sites. Stars and arrowheads indicate the hypermethylation
sites and protected guanine bases, respectively. (B) Summary of different footprinting experiments. Angled lines at the top and bottom of
the DNA sequence (cI-cro intergenic region) indicate the DNase I-protected regions. The 15 bp O1 and O2 DNA sequences are surrounded
by a solid box, whereas O3 is surrounded by a broken box. The protected guanine bases and hyper-methylated bases detected in the DMS
protection experiment are denoted by vertical arrowheads and stars, respectively. The start codons of CI and Cro are indicated by angled
arrows. The first base of the start codon of Cro was considered as +1 and the whole sequence was numbered with respect to +1.
Characterization of /11 repressor T. Ganguly et al.
1980 FEBS Journal 276 (2009) 1975–1985 ª 2009 The Authors Journal compilation ª 2009 FEBS
operator DNA slightly slowing down the migration of
dimeric CI remains unclear at present.
To confirm that dimeric repressor binds to a single
operator, we carried out gel shift assays under condi-
tions (i.e. using very high CI and O1 DNA concentra-
tions) that strongly favor the formation of the CI–O1
complex (Fig. 4B). The corresponding plot of CI bind-
ing to O1 DNA, as obtained from quantitation of the
gel shift data, is also shown (Fig. 4C). It is apparent
that the binding stoichiometry is approximately two
CI monomers per O1 DNA. Taken together, the data
suggest that, similar to k CI and Cro [8] /11, CI binds
to 15 bp operator DNA as a homodimer.
The CTDs of k CI [1] and LexA [18] (i.e. the struc-
tural homologs of /11 CTD) are involved in the
homodimerization of these repressors. Sequence align-
ment of /11 CI and LexA revealed that several resi-
dues involved in the dimerization of LexA CTD were
also present in the CTD of /11 CI (data not shown).
The CTDs of two /11 CI monomers may therefore be
responsible for the formation of a dimeric /11 CI [15].
By contrast, the NTD of /11 CI, which harbors a
potential helix-turn-helix DNA binding motif, could
participate in the binding of the dimeric /11 CI to the
major groove of operator DNA helix (Fig. 3A). The
average size of each DNase I-protected region of oper-
ator DNA was found to be approximately 25–27 bp
(Fig. 2B), suggesting the involvement of at least two
adjacent (full) turns of DNA helix in the interaction
with /11 CI. Thus, two NTDs of dimeric /11 repres-
sor may attain a specific conformation in space for
easing the interaction of its two HTH motifs to two
adjacent major grooves located on the same face of
operator DNA helix (Fig. 4D). The )33G, )35G,
)41G and )43G bases of O1 possibly contact CI from
the front, whereas )46G may contact from the back of
helix. The way that NTD contacts with )46G and
other bases on the back of the DNA helix remains
unclear at present.
Conclusions
The present study provides valuable insights into the
basic structures of /11 CI, its cognate operators and
the /11 CI–operator complex, and these are found to
be quite similar to those in k and related phage
systems. Despite structural relatedness, the mechanism
of action of /11 CI does not completely resemble that
GCHO
A
B
D C
O1
(µ
M)
(µ
M)
O1
CTD CTD
NTD
NTD
[CI]
0 0 4 20 40 M
200
150
120
100
70
50
40
30
120
100
80
60
40
20
0
% O1 DNA bound
0 1
[CI]/[O1 DNA]
2 3
60
85
kb
0 0.2 0.3 0.4 0.5 0.6 0.7 0.8 1.0 2.0
+ + + + –
Fig. 4. Binding stoichiometry. (A) 10% SDS ⁄ PAGE analysis of glutaraldehyde (GCHO) treated CI. 4 lM CI was incubated with the indicated
amount of O1 DNA prior to treatment with (+) ⁄ without ()) GCHO. Protein marker bands and their respective molecular masses (kDa) are
shown to the right of the gel. (B) Autoradiogram of the gel shift assay shows the binding of varying concentrations (0.2–2 l
M)ofCItoa
fixed amount of O1 DNA mix ( 0.1 n
M
32
P-labeled O1 DNA plus 0.4 lM cold O1 DNA). Using the scanned data from the autoradiogram,
a plot of percent O1 bound versus CI concentration was generated (C). (D) The schematic model structure of the CI–O1 DNA complex,
developed as based on our present experimental data, reveals that two NTDs (light gray balls) of dimeric CI are pointed towards two adja-
cent major grooves of O1 DNA located on the same face of DNA helix. CI monomers in dimeric CI contact each other through their CTDs
(dark gray balls). The G bases that interact with the NTDs of dimeric CI are circled.
T. Ganguly et al. Characterization of /11 repressor
FEBS Journal 276 (2009) 1975–1985 ª 2009 The Authors Journal compilation ª 2009 FEBS 1981
of the repressor proteins of the lambdoid phages.
Although k CI requires three operators to regulate the
expression of genes flanking the k cI-cro intergenic
region, /11 CI possibly requires two operators to regu-
late the transcription of genes located on the two sides
of the /11 cI-cro intergenic region. Furthermore, the
information gathered in the present study may prove
useful in the construction of S. aureus-based expression
vectors that could be induced by a physical inducer
such as temperature.
Experimental procedures
Bacterial and phage strains and plasmids
S. aureus RN4220 [31] and E. coli BL21 (DE3) (Novagen,
Madison, WI, USA) cells were routinely grown in Trypti-
case soy broth [32] and LB [33], respectively. Growth media
were supplemented with appropriate antibiotics if required.
The temperate phage /11 and its growth conditions have
been described previously [32]. The construction of plasmid
pSAU1201 and pSAU1220 was also described previously
[15]. The 269 bp /11 DNA insert in pSAU1201 carrying
the /11 cI-cro intergenic region was designated as O DNA.
Plasmid pSAU1220 was utilized for overexpression of /11
CI in E. coli.
Molecular biological techniques
Plasmid DNA isolation, DNA estimation, digestion of
DNA by restriction enzymes, modification of DNA frag-
ments by modifying enzymes, PCR, purification of DNA
fragments, labeling of DNA fragments with radioactive
materials and agarose gel electrophoresis were carried out
following standard procedures [33] or according to the
protocols provided by the respective manufacturer’s
(Qiagen, Hilden, Germany; Fermentas GmbH, St Leon-
Rot, Germany; Bangalore Genei P. Ltd., Bangalore, India).
Protein estimation, native and SDS ⁄ PAGE, staining of
polyacrylamide gel and western blotting were performed as
described previously [13,34]. DNA from /11 phage particles
was isolated as described previously [32]. Sequencing of all
/11 DNA inserts (amplified by PCR) were performed at
the DNA sequencing facility at the University of Delhi,
South Campus (Delhi, India). Sequencing of the N-terminal
ends of all protein fragments was performed using a protein
sequencer (Applied Biosystems, Foster City, CA, USA)
according to the manufacturer’s protocol.
Overexpression and purification of /11 repressor
/11 CI was overexpressed in E. coli BL21 (DE3)
(pSAU1220) and purified by Ni-NTA column chromatogra-
phy, as described previously [15]. To further purify the /11
repressor, we loaded almost 2.8 mg of repressor (derived
from the above affinity chromatography) onto a 40 mL
Sephadex G-50 column (diameter 1.5 cm) pre-equilibrated
with buffer C [10 mm Tris–Cl¢ (pH 8.0), 200 mm NaCl,
1mm EDTA, 5% glycerol]. Repressors were eluted at a
flow rate of 24 mLÆh
)1
in buffer C. Twenty 600 lL frac-
tions (marked F1 to F20) were collected and protein esti-
mation revealed that only fractions F2 to F8 contained
protein. Because fractions F2 and F3 contained mainly
intact repressor (discussed below), we stored these fractions
on ice until use. The concentration of CI was calculated
using the molecular mass of monomeric CI.
Biochemical and biophysical analysis of /11
repressor
Glutaraldehyde-mediated crosslinking, partial proteolysis
and recording of CD spectrum of the repressor were car-
ried out as described previously [13,15]. Using the molar
extinction coefficients for 5-thio-2-nitrobenzoic acid at
412 nm and for CI at 280 nm of 14150 m
)1
Æcm
)1
and
18005 m
)1
Æcm
)1
, respectively, the content of free sulf-
hydryl (-SH) groups in CI in buffer C was determined by
DTNB according to a standard procedure [35]. MALDI-
TOF analysis of protein fragments was carried out using
an Autoflex II TOF ⁄ TOF instrument (Bruker Daltonics,
Ettlingen, Germany) according to the manufacturer’s
protocol.
Homology modeling
Amino acid residues 1–118 and 119–239 of native /11 CI
were used to develop 3D model structures of the NTD
and CTD of this protein by the First Approach Mode of
swiss-model (). Although the crystal
structure of E. coli LexA CTD (Protein Databank code:
1jhc) was utilized as a template for developing the model
structure of the CTD of /11 CI, the X-ray structure of a
putative DNA binding protein (Protein Databank code:
3bs3) of Bacteroides fragilis was used as a template for
generating the model structure of NTD of /11 CI. Using
the coordinates of the resulting model structures, molecu-
lar visualization, superimposition of the structures, surface
structure determination and drawing of Ramachandran
plots were carried out by the swiss-pdb viewer (http://
ExPasy.org).
Gel shift assay
Equilibrium binding of CI to various 0.1 nm
32
P-labeled
DNAs (harboring one ⁄ two /11 operators or no operator)
was investigated by the standard gel shift assay, as
described previously [15]. The 154 bp O1O2 DNA fragment
Characterization of /11 repressor T. Ganguly et al.
1982 FEBS Journal 276 (2009) 1975–1985 ª 2009 The Authors Journal compilation ª 2009 FEBS
(Fig. 2A) was synthesized by PCR using pSAU1201 DNA
as a template and primers IIa and pHC1 (Table 1).
Similarly, 90 bp O3 (a third putative operator in the /11
cI-cro intergenic region) DNA was amplified using primers
PCI15 and IIId and pSAU1201 DNA. On the other hand,
214 bp cspC DNA was amplified using primers CSP4 and
CSP6 and the chromosomal DNA of S. aureus Newman as
a template [36]. All three DNA fragments were purified
from agarose gel using the QIAquick Gel Extraction Kit
(Qiagen). The 34 bp O1, and 49 bp O2 DNAs (Fig. 2A)
were prepared by mixing and annealing primers PCR11
and PCR21 and IIa and IIb, respectively (Table 1). The
cooperativity parameter for the binding of CI to O1O2
DNA was determined from the scanned data of the autora-
diogram (Fig. 2I) according to Monini et al. [37]. To study
CI binding stoichiometry, a gel shift assay was performed
using essentially the same method (see above), except that
reaction mixtures contained higher CI concentrations
(0.2–2 lm) and 0.4 lm cold O1 DNA along with
0.1 nm
32
P-labeled O1 DNA. The CI preparation used in
the binding stoichiometry experiment was considered to
have 100% activity.
DNase I footprinting
Different
32
P-labeled DNA fragments, utilized in different
footprinting assays, were prepared by standard end labeling
procedures [33]. Briefly, to label the bottom strand of O
DNA with
32
P, pSAU1201 was treated successively with
EcoRI, Klenow polymerase and [a-
32
P] dATP, and BamHI.
Finally, the bottom strand labeled O DNA was purified
from an agarose gel. To label the top strand of O DNA
with
32
P, the oligonucleotide pHC2 (Table 1) was
end-labeled with [c-
32
P] ATP followed by the PCR amplifi-
cation of O DNA by Taq polymerase using pSAU1201
DNA or /11 DNA as a template and the oligonucleotides
pHC1 and labeled pHC2 as primers. The resulting DNA
fragment was purified from an agarose gel.
DNase I footprinting was performed according to a stan-
dard procedure [5] with some modifications. Briefly, 60 nm
labeled DNA fragment ( 5000 c.p.m.) was incubated with
varying concentrations of CI in 50 lL buffer C for 20 min
on ice. Every reaction mixture was made 1 mm with MgCl
2
and treated with 0.15 units of DNase I for 4 min at room
temperature followed by termination of the reactions by the
addition of 90 lL of Stop solution [200 mm NaCl, 80 m m
EDTA (pH 8.0), 1% SDS, 0.03% glycogen]. Cleaved DNA
fragments, prepared by sequential passage of each reaction
mixture through phenol–chloroform (1 : 1) extraction and
ethanol precipitation steps, were resuspended in sequencing
gel buffer [98% deionized formamide, 10 mm EDTA
(pH 8.0), 0.025% bromophenol blue]. Each labeled DNA
was treated with DNase I identically in the absence of CI
and the recovered DNA fragments were used as controls.
Finally, both experimental and control DNA fragments
were analyzed by urea ⁄ 6% PAGE along with guanine
and ⁄ or adenosine + guanine sequencing ladders generated
from the identically labeled DNA fragments by standard
procedures [38].
DMS protection assay
The DMS protection assay was performed as described pre-
viously [39]. Briefly, 0.5 lm repressor was incubated with
60 nm
32
P-labeled O DNA ( 5000 c.p.m.) in 100 lLof
buffer C for 20 min at room temperature followed by the
treatment of repressor–operator complexes with 0.2% DMS
for 2 min at room temperature. After termination of the
reaction with DMS stop solution [1.5 m sodium acetate
(pH 7.0), 1 m beta-mercaptoethanol], DNA was recovered
by successive passage of the reaction mixture through phe-
nol–chloroform (1 : 1) extraction and ethanol precipitation
steps in the presence of glycogen. The same labeled O DNA
was also treated directly with DMS as above in the absence
of CI and the recovered DNA was used as a control. The
gunaine-specific ladder DNAs, prepared from both control
and experimental DNAs by a standard procedure [38], were
analyzed by urea ⁄ 6% PAGE.
Acknowledgements
This work was supported by the financial assistance
from the Department of Atomic Energy (Government
of India, Mumbai, India) to S. Sau. The authors thank
Drs P. Parrack, R. Chattopadhyaya and N. C. Mandal
for critically reading, correcting and modifying the
manuscript. The authors are extremely grateful to
Table 1. Details of the oligonucleotides used.
Name Sequence (5¢-to3¢) Purpose
pHC1 GGATCCTAAATCTTCTTGAGTAC Synthesis of O and
O1O2 DNAs
pHC2 GAATTCTTGGTTCTATAGTATCTG Synthesis of O DNA
PCR11 GACTCAAGTACACGTATCGTGTATA
GTAGGTTTA
Synthesis of O1DNA
PCR21 AAACCTACTATACACGATACGTGTA
CTTGAGTCA
Synthesis of O1 DNA
IIa ATTCAACAAAAAAATACACGAAAAG
CAAACTTTTATGTTGACTCAAGTA
Synthesis of O2 and
O1O2 DNAs
IIb TACTTGAGTCAACATAAAAGTTTGC
TTTTCGTGTATTTTTTTGTTGAAT
Synthesis of O2 DNA
PCI51 GAATTCTCGCTAATTCTTTTTTATC Synthesis of O3 DNA
IIId TTTTTTTGTTGAATACCAAAAATAA
TTGGGTTATACTATAG
Synthesis of O3 DNA
CSP4 CATGCCATGGATGAATAACGGTACAG Synthesis of S. aureus
cspC DNA
CSP6 CTCGAGCATTTTAACTACGTTTG Synthesis of S. aureus
cspC DNA
T. Ganguly et al. Characterization of /11 repressor
FEBS Journal 276 (2009) 1975–1985 ª 2009 The Authors Journal compilation ª 2009 FEBS 1983
Dr C. Y. Lee (UAMS, Little Rock, AR, USA) for
providing plasmids and strains used in the study.
The authors would like to thank Mr A. Banerjee,
Mr A. Poddar, Mr J. Guin and Mr M. Das for their
excellent technical help. Mr Tridib Ganguly, Ms Mal-
abika Das and Mr Amitava Bandhu received Senior
Research fellowships from the Council of Scientific
and Industrial Research (Government of India, New
Delhi). Mr Palas K. Chanda is a recipient of the
Senior Research fellowship of Bose Institute. Mr Bisw-
anath Jana received a Junior Research fellowship from
the Department of Biotechnology (Government of
India, New Delhi).
References
1 Gussin GN, Johnson AD, Pabo CO & Sauer RT (1983)
Repressor and Cro Protein: Structure, Function, and
Role in Lysogenization. In Repressor and Cro Protein:
Structure, Function, and Role in Lysogenization. Lambda
II (Hendrix RW, Roberts JW, Stahl FW & Weisberg
RA, eds), pp. 93–121. Cold Spring Harbor Laboratory
Press, Cold Spring Harbor, NY.
2 Hatfull GF (2000) Molecular Genetics of Mycobacteria.
ASM Press, Washington, DC.
3 Heinrich J, Velleman M & Schuster H (1995) The tri-
partite immunity system of phages P1 and P7. FEMS
Microbiol Rev 17, 121–126.
4 Kimsey HH & Waldor MK (2004) The CTX phi repres-
sor RstR binds DNA cooperatively to form tetrameric
repressor-operator complexes. J Biol Chem 279, 2640–
2647.
5 Koudelka AP, Hufnagel LA & Koudelka GB (2004)
Purification and characterization of the repressor of the
shiga toxin-encoding bacteriophage 933W: DNA bind-
ing, gene regulation, and autocleavage. J Bacteriol 186,
7659–7669.
6 Carlson NG & Little JW (1993) Highly cooperative
DNA binding by the coliphage HK022 repressor. J Mol
Biol 230, 1108–1130.
7 Ogawa T & Ogawa H (1988) Organization of the early
region of bacteriophage 80. J Mol Biol 202, 537–550.
8 Ptashne M (ed.) (1992) A Genetic Switch Gene Control
and Phage k. Harvard University, Cell Press & Black-
well Scientific Publications, Cambridge, MA.
9 Dodd IB, Shearwin KE & Egan JB (2005) Revisited
gene regulation in bacteriophage Lambda. Curr Opin
Genet Dev 15, 145–152.
10 Rousseau P, Betermier M, Chandler M & Alazard R
(1996) Interactions between the repressor and the early
operator region of bacteriophage Mu. J Biol Chem 271,
9739–9745.
11 van Kaer L, van Montagu M & Dhaese P (1989) Purifi-
cation and in vitro DNA-binding specificity of the
Bacillus subtilis phage phi 105 repressor. J Biol Chem
264, 14784–14791.
12 Susskind MM & Youderian P (1983) Bacteriophage P22
Antirepressor and its control. In Bacteriophage P22
Antirepressor and its control. Lambda II (Hendrix RW,
Roberts JW, Stahl FW & Weisberg RA, eds), pp.
93–121. Cold Spring Harbor Laboratory Press, Cold
Spring Harbor, NY.
13 Ganguly T, Bandhu A, Chattoraj P, Chanda PK, Das
M, Mandal NC & Sau S (2007) Repressor of temperate
mycobacteriophage L1 harbors a stable C-terminal
domain and binds to different asymmetric operator
DNAs with variable affinity. Virol J 4, 64.
14 Iandolo JJ, Worrell V, Groicher KH, Qian Y, Tian R,
Kenton S, Dorman AH, Ji H, Lin S, Loh P et al.
(2002) Comparative analysis of the genomes of the
temperate bacteriophages phi 11, phi 12 and phi 13 of
Staphylococcus aureus 8325. Gene 289, 109–118.
15 Das M, Ganguly T, Chattoraj P, Chanda PK, Bandhu
A, Lee CY & Sau S (2007) Purification and character-
ization of repressor of temperate S. aureus phage phi11.
J Biochem Mol Biol 40, 740–748.
16 Kaneko J, Kimura T, Narita S, Tomita T & Kamio Y
(1998) Complete nucleotide sequence and molecular
characterization of the temperate staphylococcal bacte-
riophage phiPVL carrying Panton-Valentine leukocidin
genes. Gene 215, 57–67.
17 Sumby P & Waldor MK (2003) Transcription of the
toxin genes present within the Staphylococcal phage
phiSa3ms is intimately linked with the phage’s life cycle.
J Bacteriol 185, 6841–6851.
18 Luo Y, Pfuetzner RA, Mosimann S, Paetzel M, Frey
EA, Cherney M, Kim B, Little JW & Strynadka NC
(2001) Crystal structure of LexA: a conformational
switch for regulation of self-cleavage. Cell 106, 585–594.
19 Bell CE, Frescura P, Hochschild A & Lewis M (2000)
Crystal structure of the lambda repressor C-terminal
domain provides a model for cooperative operator
binding. Cell 101, 801–811.
20 Stayrook S, Jaru-Ampornpan P, Ni J, Hochschild A &
Lewis M (2008) Crystal structure of the lambda repres-
sor and a model for pairwise cooperative operator bind-
ing. Nature 452, 1022–1025.
21 Bohm G, Muhr R & Jaenicke R (1992) Quantitative
analysis of protein far UV circular dichroism spectra by
neural networks. Protein Eng 5, 191–195.
22 Hecht MH, Sturtevant JM & Sauer RT (1984) Effect of
single amino acid replacements on the thermal stability
of the NH2-terminal domain of phage lambda repres-
sor. Proc Natl Acad Sci USA 81, 5685–5689.
23 Stearman RS, Frankel AD, Freire E, Liu BS & Pabo
CO (1988) Combining thermostable mutations increases
the stability of lambda repressor. Biochemistry 27,
7571–7574.
Characterization of /11 repressor T. Ganguly et al.
1984 FEBS Journal 276 (2009) 1975–1985 ª 2009 The Authors Journal compilation ª 2009 FEBS
24 Watanabe K, Chishiro K, Kitamura K & Suzuki Y
(1991) Proline residues responsible for thermostability
occur with high frequency in the loop regions of an
extremely thermostable oligo-1,6-glucosidase from
Bacillus thermoglucosidasius KP1006. J Biol Chem 266,
24287–24294.
25 Chattopadhyaya R & Ghosh KA (2003) A comparative
three-dimensional model of the carboxy-terminal
domain of the lambda repressor and its use to build
intact repressor tetramer models bound to adjacent
operator sites. J Struct Biol 141, 103–114.
26 Das M, Ganguly T, Bandhu A, Mondal R, Chanda PK,
Jana B & Sau S (2009) Thermally stable Cro repressor of
phage /11 possesses novel DNA-binding capacity and
physicochemical properties. BMB Rep (in press).
27 Ladero V, Garcı
´
a P, Alonso JC & Sua
´
rez JE (2002)
Interaction of the Cro repressor with the lysis ⁄ lysogeny
switch of the Lactobacillus casei temperate bacterio-
phage A2. J Gen Virol 83, 2891–2895.
28 Kakikawa M, Ohkubo S, Sakate T, Sayama M, Taketo
A & Kodaira K (2000) Purification and DNA-binding
properties of the cro-type regulatory repressor protein
cng encoded by the Lactobacillus plantarum phage phi
g1e. Gene 249, 161–169.
29 Lobocka MB, Svarchevsky AN, Rybchin VN &
Yarmolinsky MB (1996) Characterization of the pri-
mary immunity region of the Escherichia coli linear
plasmid prophage N15. J Bacteriol 178, 2902–2910.
30 Kenny JG, Leach S, de la Hoz AB, Venema G, Kok J,
Fitzgerald GF, Nauta A, Alonso JC & van Sinderen D
(2006) Characterization of the lytic-lysogenic switch of
the lactococcal bacteriophage Tuc2009. Virol 347,
434–446.
31 Novick RP (1990) The Staphylococcus as a Molecular
Genetic System. In Molecular Biology of the Staphylo-
cocci (Novick RP, ed.), pp 1–37. VCH Publishers, Inc.,
New York, NY.
32 Lee CY & Iandolo JJ (1988) Structural analysis of
staphylococcal bacteriophage phi 11 attachment sites.
J Bacteriol 170, 2409–2411.
33 Sambrook J & Russell DW (2001) Molecular Cloning:
A Laboratory Manual. 3rd ed., Cold Spring Harbor
Laboratory Press, CSH, New York, NY.
34 Ausubel FM, Brent R, Kingston RE, Moore DD,
Seidman JG, Smith JA & Struhl K (1998) Current
Protocols in Molecular Biology. John Wiley & Sons,
New York, NY.
35 Saha RP, Basu G & Chakrabarti P (2006) Cloning,
expression, purification, and characterization of Vibrio
cholerae transcriptional activator, HlyU. Protein Expr
Purif 48, 118–125.
36 Chanda PK, Mondal R, Sau K & Sau S (2008) Anti-
biotics, arsenate and H
2
O
2
induce the promoter of
Staphylococcus aureus cspC gene more strongly than
cold. J Basic Microbiol, doi: 10.1002/jobm.200800065.
37 Monini P, Grossman SR, Pepinsky B, Androphy EJ &
Laimins LA (1991) Cooperative binding of the E2 pro-
tein of bovine papillomavirus to adjacent E2-responsive
sequences. J Virol 65, 2124–2130.
38 Maxam AM & Gilbert W (1980) Sequencing end-
labeled DNA with base-specific chemical cleavages.
Meth Enzymol 65, 499–560.
39 Ramesh V & Nagaraja V (1996) Sequence-specific DNA
binding of the phage Mu C protein: footprinting
analysis reveals altered DNA conformation upon
protein binding. J Mol Biol 260, 22–33.
T. Ganguly et al. Characterization of /11 repressor
FEBS Journal 276 (2009) 1975–1985 ª 2009 The Authors Journal compilation ª 2009 FEBS 1985