Báo cáo khoa học: Enzymatic investigation of the Staphylococcus aureus type I signal peptidase SpsB – implications for the search for novel antibiotics ppt
Bạn đang xem bản rút gọn của tài liệu. Xem và tải ngay bản đầy đủ của tài liệu tại đây (515.36 KB, 13 trang )
Enzymatic investigation of the Staphylococcus aureus
type I signal peptidase SpsB – implications for the search
for novel antibiotics
Smitha Rao C.V.
1
, Katrijn Bockstael
2
, Sangeeta Nath
3
, Yves Engelborghs
3
, Jozef Anne
´
1
and Nick Geukens
1,
*
1 Laboratory of Bacteriology, Katholieke Universiteit Leuven, Belgium
2 Laboratory for Medicinal Chemistry, Katholieke Universiteit Leuven, Belgium
3 Laboratory of Biomolecular Dynamics, Katholieke Universiteit Leuven, Belgium
Staphylococcus aureus is a frequent commensal of the
human skin and nose, but is also responsible for a wide
array of infections, ranging from minor skin infection to
life-threatening conditions such as endocarditis and
haemolytic pneumonia [1]. This Gram-positive bacte-
rium is the most common cause of nosocomial infec-
tions. S. aureus infections are becoming increasingly
difficult to treat because the bacterium has evolved into
a highly successful pathogen when it comes to antibiotic
resistance [2]. The emergence and spread of strains such
as methicillin-resistant S. aureus, vancomycin-interme-
diate S. aureus and vancomycin-resistant S. aureus has
become a major concern. New drugs are being devel-
oped and launched in the market, but most currently
Keywords
arylomycin; IsaA; signal peptidase; SpsB;
Staphylococcus aureus
Correspondence
J. Anne
´
, Laboratory of Bacteriology, Rega
Institute for Medical Research, Katholieke
Universiteit Leuven, Minderbroedersstraat
10, 3000 Leuven, Belgium
Fax: +32 16 337 340
Tel: +32 16 337 371
E-mail:
Website: />bacteriology/
*Present address
PharmAbs, Katholieke Universiteit Leuven
Antibody Center, Belgium
(Received 11 July 2008, revised 10 March
2009, accepted 3 April 2009)
doi:10.1111/j.1742-4658.2009.07037.x
Staphylococcus aureus has one essential type I signal peptidase (SPase),
SpsB, which has emerged as a potential target in the search for antibiotics
with a new mode of action. In this framework, the biochemical properties
of SpsB are described and compared with other previously characterized
SPases. Two different substrates have been used to assess the in vitro pro-
cessing activity of SpsB: (a) a native preprotein substrate immunodominant
staphylococcal antigen A and (b) an intramolecularly quenched fluorogenic
synthetic peptide based on the sequence of the SceD preprotein of Staphy-
lococcus epidermidis for fluorescence resonance energy transfer-based analy-
sis. Activity testing at different pH showed that the enzyme has an
optimum pH of approximately 8. The pH-rate profile revealed apparent
pK
a
values of 6.6 and 8.7. Similar to the other SPases, SpsB undergoes
self-cleavage and, although the catalytic serine is retained in the self-cleav-
age product, a very low residual enzymatic activity remained. In contrast,
a truncated derivative of SpsB, which was nine amino acids longer at the
N-terminus compared to the self-cleavage product, retained activity. The
specificity constants (k
cat
⁄ K
m
) of the full-length and the truncated deriva-
tive were 1.85 ± 0.13 · 10
3
m
)1
Æs
)1
and 59.4 ± 6.4 m
)1
Æs
)1
, respectively, as
determined using the fluorogenic synthetic peptide substrate. These obser-
vations highlight the importance of the amino acids in the transmembrane
segment and also those preceding the catalytic serine in the sequence of
SpsB. Interestingly, we also found that the activity of the truncated SpsB
increased in the presence of a non-ionic detergent.
Abbreviations
CBB, Coomassie brilliant blue; FRET, fluoresence resonance energy transfer; pre-IsaA, immunodominant staphylococcal antigen A precursor;
sc-SpsB, self-cleavage product of SpsB; SPase, signal peptidase; tr-SpsB, N-terminally truncated SpsB derivative.
3222 FEBS Journal 276 (2009) 3222–3234 ª 2009 The Authors Journal compilation ª 2009 FEBS
developed antimicrobials are derivatives of well-known
and extensively used compound classes [3] and, there-
fore, the chances that the bacterium would develop
cross-resistance to these drugs are quite high. However,
in the search for novel classes of antibiotics for combat-
ing this pathogen, new drug targets [4,5] have been in
focus in recent years.
Proteins that are destined for transmembrane trans-
port are produced in the cell as preproteins with a sig-
nal peptide that is recognized and cleaved off by signal
peptidases (SPases) [6,7]. Bacterial type I SPases are
membrane-bound endopeptidases that remove the sig-
nal peptide from proteins on translocation across the
cytoplasmic membrane [8]. SPases are unique serine
proteases, and differ from the classical serine proteases
in that they act using a serine ⁄ lysine catalytic dyad
mechanism [9–11]. Both Gram-positive and Gram-neg-
ative bacterial SPases have regions of high sequence
similarity, which are referred to as boxes A to E [6],
although they differ in certain aspects, including size,
the number of transmembrane segments and substrate
specificity [12]. SPases have already been proposed as
antibiotic targets because of their essentiality, the eas-
ier accessibility of the catalytic domain for potential
inhibitors as a result of being located on the outer side
of the cytoplasmic membrane, and the different cata-
lytic mechanism employed compared to that used by
eukaryotic SPases [8]. LepB, the SPase of Escherichia
coli, is the most extensively studied SPase. The crystal
structure of the soluble form of this enzyme has been
determined [13–15] and NMR data are also available
for the full-length enzyme [16] and the soluble deriva-
tive [17]. Among the Gram-positive bacteria, func-
tional analysis and biochemical characterization of
type I SPases have been described for Bacillus subtilis
[18], Bacillus amyloliquefaciens [19], Streptomyces
lividans [20] and Streptococcus pneumoniae [21]. For
S. aureus, two genes, designated spsA and spsB, were
identified encoding homologues of SPase of which only
the latter was shown to be essential [22]. SpsB also has
been functionally expressed in E. coli and was demon-
strated to process E. coli preproteins in vivo [22]. It
was predicted that SpsA is an inactive SPase homo-
logue. Furthermore, SpsB, but not SpsA, was shown
to be responsible for the removal of the N-terminal
leader of AgrD, in vitro, which also suggested a role
for type I SPases in quorum sensing [23].
In the present study, we report the biochemical char-
acteristics of SpsB and describe two different in vitro
assays for the enzyme: one with its native substrate
immunodominant staphylococcal antigen A precursor
(pre-IsaA) and the other with a fluorogenic synthetic
peptide, SceD. In addition, a nonmembrane-bound,
truncated SpsB (tr-SpsB) was designed to determine
the effect of removal of the transmembrane segment of
SpsB. The specific activities of the full-length and the
truncated SpsB were compared using the fluoresence
resonance energy transfer (FRET)-based assay involv-
ing the SceD peptide.
Results and discussion
Expression and purification of the full-length
SpsB and preprotein IsaA
The gene encoding SpsB was amplified by PCR using
primers that were also designed to bring about two
modifications: the incorporation of NdeI and EcoRI
restriction sites (at the 5¢ and 3¢ ends, respectively) and
a hexa-histidine-encoding sequence for obtaining a
His-tag at the N-terminus of the produced protein to
facilitate purification. The fragments were cloned after
the T7 promoter in pET-3a plasmid. The proteins
expressed in E. coli BL21(DE3)pLysS were purified
(see Experimental procedures) and analyzed by
SDS ⁄ PAGE. The purification of the full-length SpsB
normally yielded samples of sufficient purity (> 95%)
and concentration (30–40 lm) (see Supporting infor-
mation, Fig. S1A).
The gene encoding pre-IsaA was amplified by PCR
using oligonucleotides that were also designed to incor-
porate NcoI and EcoRI restriction sites and sequences
encoding a hexa-histidine tag and a c-Myc tag to
appear at N- and C-terminal ends of the expressed
protein, respectively. The c-Myc tag was included to
facilitate immunodetection of the protein. The gene
was cloned in pET-23d and expressed in E. coli
BL21(DE3)pLysS. Pre-IsaA (predicted
MW = 26.2 kDa, including hexa-his and c-Myc tag)
was purified, refolded and used in the in vitro assay
after analysis by SDS ⁄ PAGE (see Supporting informa-
tion, Fig. S1B).
In vitro preprotein processing by SpsB
The choice of the preprotein substrate was made after
a preliminary analysis of secreted proteins indicated in
the genomic sequence data of S. aureus. The criteria
for selection of the substrate were a good prediction of
the presence and location of the signal peptide cleav-
age site (as indicated by signalp 3.0 server [24]), and
non-indication as a general protease. The latter is not
desirable because it could degrade the SPase itself.
Pre-IsaA was selected as the substrate for this assay.
IsaA was first identified as one of the four proteins
expressed in vivo during sepsis caused by methicillin-
Rao C. V. S. et al. S. aureus type I signal peptidase SpsB
FEBS Journal 276 (2009) 3222–3234 ª 2009 The Authors Journal compilation ª 2009 FEBS 3223
resistant S. aureus [25]. It is a lytic transglycosylase
and was proposed to be important for the virulence of
S. aureus along with another paralogue, SceD [26],
which is also a substrate of SpsB.
The in vitro assay was carried out in the presence of
a protease inhibitor cocktail and the reactions were
stopped at different time intervals in the range 0–15 h.
Analysis of the assay products by means of immuno-
detection of pre-IsaA ⁄ IsaA revealed the presence of
two bands in the sample containing the preprotein
substrate and SpsB (Fig. 1A). The upper band
corresponds to the unprocessed preprotein and the
lower one to the mature protein (predicted
MW = 22.5 kDa). As shown in Fig. 1A, the substrate
remained unprocessed in the absence of the enzyme.
The amount of preprotein processed increased over
time (Fig. 1A). After 15 h, unprocessed protein
remained and the addition of fresh SpsB followed by
incubation for 3 h did not result in any significant
improvement in processing. Similar observations of
incomplete processing have been made previously with
in vitro assays involving the SPases and preproteins
[21,27–29] and it has been suggested that the remaining
preprotein is probably in an unprocessible state.
The addition of arylomycin A
2
[15], a known SPase
inhibitor, to the reaction mixture containing the
enzyme and the substrate did not result in pre-IsaA
processing (Fig. 1B). These observations confirmed the
in vitro activity of the purified SpsB. The specificity of
the preprotein cleavage by SpsB was confirmed by
N-terminal sequence analysis of the mature protein
obtained. The substrate was cleaved at the predicted
site (Fig. 2), following the ()1, )3) or ‘Ala-X-Ala’ rule
[30]. This substrate could also be processed by LepB,
the SPase of the Gram-negative bacterium E. coli
under the same in vitro conditions described in the
present study (data not shown), indicating the broad
substrate specificity of the SPases.
A continuous fluorometric assay for SpsB and
measurement of its specific enzymatic activity
A FRET-based assay was designed for SpsB. The
substrate used was an internally quenched peptide
based on the sequence of the signal peptide region of
Staphylococcus epidermidis SceD preprotein and
containing 4-(4-dimethylaminophenylazo)benzoic acid ⁄
5-((2-aminoethyl)amino)-1-naphthalenesulfonic acid as
the FRET pair. SpsB was found to cleave this peptide
efficiently in the presence of protease inhibitor cocktail,
to which the bacterial type I SPases are resistant (see
Supporting information, Fig. S2). The standardized
assays were carried out in microtitre plates in a total
volume of 100 lL in the assay buffer (50 mm Tris-HCl
pH 8; 0.5% Triton X-100) with a certain concentration
of SpsB (final concentration of 1 lm in most cases)
and SceD peptide (final concentration of 5 or 10 lm,
as indicated) dissolved in dimethylformamide. The
final concentration of dimethylformamide in the reac-
tion mixtures was 1%. The hydrolysis of the peptide
was measured by the increase in fluorescence on a
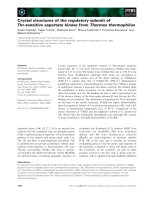
Fig. 1. Preprotein processing by SpsB (full-length): (A) as function of time and (B) blocked by arylomycin A
2
. SpsB and pre-IsaA (at final con-
centrations of 2 and 10 l
M, respectively) were incubated at 37 °C in the assay buffer for different time periods. The proteins were separated
on 12.5% (w ⁄ v) SDS ⁄ PAA gels and analyzed by western blotting and chemiluminescent detection. (A) Lane 1, SpsB (control); lane 2,
pre-IsaA (control); lane 3, SpsB and pre-IsaA at time = 0; lanes 4–10, pre-IsaA processing by SpsB with increase in time; lane 11, pre-IsaA
processing by SpsB after 900 min followed by addition of fresh SpsB (final concentration of 2 l
M) and further incubation for 3 h. (B) SpsB
and pre-IsaA (final concentrations of 1 and 10 l
M, respectively) were incubated without and with arylomycin A
2
(final concentration of
200 l
M) for 15 h at 37 °C. Lane 1, pre-IsaA processing by SpsB; lane 2, pre-IsaA processing blocked by arylomycin A
2
.
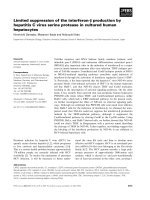
Fig. 2. SPase recognition sequence and cleavage sites of the SpsB
substrates used in the present study: Showing part of the sequence
of the IsaA precursor (upper row) and the sequence of the SceD pep-
tide (lower row) with the SPase cleavage sites indicated. The SPase
recognition sequence, which consists of small aliphatic residues at
positions )1 and )3 relative to the cleavage sites, is shown in bold.
S. aureus type I signal peptidase SpsB Rao C. V. S. et al.
3224 FEBS Journal 276 (2009) 3222–3234 ª 2009 The Authors Journal compilation ª 2009 FEBS
microplate reader using excitation and emission wave-
lengths of 340 and 510 nm, respectively. As part of the
validation of the assay, inhibitor arylomycin A
2
was
used and no increase in fluorescence was observed in
the time-based scan (see Supporting information,
Fig. S3A), confirming that the peptide remains
uncleaved when the enzyme activity is inhibited. A
dose-dependent response to arylomycin A
2
was plotted
(see Supporting information, Fig. S3B) and the IC
50
of
the inhibitor against SpsB was found to be 1 lm
(0.82 lgÆmL
)1
). The specificity of the proteolytic reac-
tion of the SceD peptide by SpsB was also analysed by
RP-HPLC to determine whether the SceD peptide was
cleaved at the expected cleavage site. The resulting
fractions were subjected to ESI-MS and it was found
that the fluorogenic synthetic SceD peptide was
cleaved by S. aureus SpsB at a single cleavage site and
that this cleavage occurred specifically at the predicted
site located at the A-S bond (data not shown). The
sequence and cleavage site of the SceD peptide are
shown in Fig. 2.
It should be noted that, at high substrate concentra-
tions (> 20 lm), the linear correlation between the
fluorescence and the substrate concentration is lost as
a result of the inner filter effect. The inner filter effect
is the phenomenon observed when the fluorescent light
is absorbed by quenching groups on neighbouring sub-
strates or cleaved product molecules, allowing only a
fraction of light to be detected by the instrument.
Therefore, only k
cat
⁄ K
m
could be measured using the
condition [S]<<K
m
. Consistent with this condition,
the time-course of the FRET assay with the enzyme
followed simple first-order kinetics (see Supporting
information, Fig. S4). The pseudo-first-order rate
constant (K
obs
) derived from these curves was directly
proportional to the enzyme concentration throughout
the experimentally accessible range of concentrations
(0.1–10 lm). The apparent second-order rate constant
k
cat
⁄ K
m
or specific enzymatic activity of the full-length
SpsB was found to be 1.85 ± 0.13 · 10
3
m
)1
Æs
)1
. This
k
cat
⁄ K
m
value is approximately 26-fold higher than
that reported for E. coli LepB in a continuous FRET
assay involving a fluorogenic synthetic peptide based
on maltose-binding protein [31].
Activity at varying pH and the pH-rate profile
of SpsB
The activity of SpsB over a range of pH was initially
determined by observing in vitro preprotein processing
in reaction buffers varying over the pH range 2–12.
The enzyme was found to be active at the wide pH
range 5–12 but not at or below pH 4 (data not
shown). An assessment of the amount of preprotein
processed at varying pH did not yield sufficient quanti-
tative data, and therefore the FRET assay was used to
study the effect of pH on the enzyme. The stability of
the synthetic SceD peptide substrate was determined
by incubating it in different buffers in the absence of
the enzyme. No increase in fluorescence was observed
over the entire pH range 2–12 during the time-course
of the assay (data not shown), confirming its suitability
for this purpose. The enzyme reactions were carried
out in different buffers over the pH range 2–12 and
the increase in fluorescence was observed as a function
of time (see Supporting information, Fig. S5). The
curve obtained for pH 12 could not be fitted to obtain
the exact k
cat
⁄ K
m
value (see Supporting information,
Fig. S5). However, the activity at pH 12 appears to be
lower in terms of the initial velocity and, to plot
the pH-rate profile, the approximate k
cat
⁄ K
m
value
obtained was used. The pH-rate profile obtained by
plotting k
cat
⁄ K
m
versus pH was fitted with the equa-
tion (Eqn 1) for a complex bell-shaped curve (Fig. 3).
Maximum activity for SpsB was observed at pH
7.9 ± 0.2. The high pH optimum of SpsB in vitro is
consistent with those reported for the other SPases
and is in agreement with the catalytic mechanism. Spi
(S. pneumoniae), SipS (B. subtilis) and LepB (E. coli)
have optima of pH 8, pH 10 and pH 9, respectively
[21,28,32].
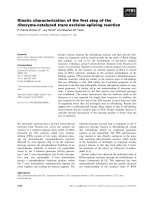
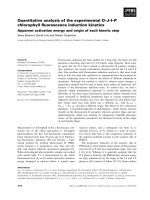
Fig. 3. pH-rate profile of SpsB. The calculated specific enzymatic
activities (k
cat
⁄ K
m
) obtained after carrying out the reactions in
buffers varying over the pH range 4–12 were fitted using the equa-
tion for a complex bell-shaped curve. The results shown are the
average of three independent experiments.
Rao C. V. S. et al. S. aureus type I signal peptidase SpsB
FEBS Journal 276 (2009) 3222–3234 ª 2009 The Authors Journal compilation ª 2009 FEBS 3225
k
cat
=K
m
¼
k
cat
K
m
1
H
þ2
K
a3
K
a2
þ
k
cat
K
m
2
H
þ
K
a3
1 þ
H
þ
K
a3
þ
H
þ2
K
a3
K
a2
þ
H
þ3
K
a3
K
a2
K
a1
ð1Þ
The curve obtained from the pH-rate profile (Fig. 3)
was not a typical single bell-shaped curve because there
appeared to be another smaller peak around pH 11. The
apparent pK
a
values for the free enzyme are approxi-
mately 6.6 and 8.7, with possibly another pK
a
around
11.8. The apparent pK
a
value of 6.6 from the ascending
limb could correspond to lysine, which acts as a general
base in this class of enzyme. It is interesting to note that
this value is 2.1 pH units lower than that observed for
LepB of E. coli [32] and 4 pH units lower than the pK
a
of lysine in solution. The reason for the decreased pK
a
of the active-site lysine in the SPases is not known. It is
also unclear whether the hydrophobic environment of
the membrane contributes to this.
The presence of two peaks in the pH-dependence
curve (Fig. 3) and the high pK
a1
suggests that two acid
groups can play the role of acid catalyst, as represented
in Scheme 1 [33,34]. Deprotonation of ESH
2
+
with a
pK
a2
of 8.7 decreases the rate of the catalyzed reaction.
Further deprotonation of ESH
+
with a pK
a3
around
11.8 most likely stops the catalytic reaction (Scheme 1).
The k
cat
⁄ K
m
values were calculated using Eqn (1).
For ESH
þ
2
k
cat
K
m
ffi 1500 and ESH
þ
k
cat
K
m
ffi 400
Stability and the effect of temperature on the
in vitro activity of SpsB
As SPases are known to undergo degradation upon
incubation or storage over time, we tested the stability
of SpsB (full-length) by storing or incubating
the enzyme at 4, 27 or 37 °C for different lengths of
time in the presence of general protease inhibitors. In
the sample stored at 4 °C for 9 days, only one band
corresponding to the native SpsB was observed
(Fig. 4A). However, the k
cat
⁄ K
m
of this sample was
70 m
)1
Æs
)1
, which was 18.5-fold lower compared to the
enzyme stored at )80 °C for the same length of time.
After 4 days of incubation at 27 °C, apart from the
band corresponding to the native SpsB, a smaller
protein was found (MW 18 kDa), which we desig-
nated as sc-SpsB. The amount of sc-SpsB increased
over time and with increasing temperature. The
addition of arylomycin A
2
blocked the appearance of
sc-SpsB (Fig. 4B), suggesting that this was a result of
intermolecular self-cleavage.
In vitro self-cleavage
The N-terminal sequence analysis of the self-cleavage
product sc-SpsB revealed that the enzyme was
cleaved one amino acid before the catalytic serine
(Fig. 5). The self-cleavage site resembles the signal
peptide cleavage site following the ()1, )3) rule for
SPase recognition, as observed in the case of LepB,
SipS and Spi. A comparison of the site of cleavage
of SpsB with that of Spi from S. pneumoniae shows
that they are cleaved at the same point, whereas, in
the case of SipS from B. subtilis, the cleavage site is
just after the catalytic serine (Fig. 5). It has been
reported that the self-cleavage products of Spi and
SipS have no SPase activity [21,35]. We tested the
self-cleavage product sc-SpsB and also found it to be
inactive at the concentration (1 lm) normally used
for the FRET assay. A very low residual activity
was found when the concentration was increased
(data not shown). These SPases (Spi, SipS and SpsB)
have their self-cleavage site in the region around the
catalytic serine, unlike in E. coli LepB, where it is
located in a hydrophilic domain connecting the two
transmembrane domains at the N-terminus of the
enzyme [36]. The self-cleavage product of LepB was
reported to have 100-fold less specific activity com-
pared to the native enzyme [36]. Although the above
observations of self-cleavage were made in vitro, self-
cleavage has also been reported to occur in vivo for
Spi. In the case of LepB, it is believed that the
enzyme is protected from self-cleavage in vivo as a
result of the autolysis site and the catalytic site being
at opposite sides of the membrane. This view is sup-
ported by studies involving membrane-incorporated
LepB, where a dramatic decrease in self-cleavage was
observed [37].
Expression, purification, in vitro activity and the
requirement of detergent of an N-terminally
truncated SpsB (tr-SpsB) derivative
Topology prediction for SpsB (see Experimental
procedures) by tmhmm [38] and the porter server [39]
Scheme 1. Mechanism for two protonic states of the enzyme.
S. aureus type I signal peptidase SpsB Rao C. V. S. et al.
3226 FEBS Journal 276 (2009) 3222–3234 ª 2009 The Authors Journal compilation ª 2009 FEBS
indicated the presence of a single N-terminal trans-
membrane segment anchoring it to the membrane. The
tr-SpsB was designed to obtain a soluble derivative of
SpsB devoid of the transmembrane segment but retain-
ing the amino acids in the box B region (Fig. 6). This
N-terminally hexa-his-tagged protein was found to be
in the soluble fraction when expressed in E. coli and
could be purified under native conditions from the
cytoplasmic fraction by Ni
2+
-affinity chromatography.
Further purification by cation exchange chromato-
graphy was required to obtain a pure sample suitable
for use in the in vitro assays (see Supporting informa-
tion, Fig. S6). The tr-SpsB was able to process the sub-
strate pre-IsaA in vitro, confirming that the enzyme
activity was retained (see Supporting information,
Fig. S7).
The specific activity of the truncated derivative was
determined using the FRET assay in the presence and
absence of detergents. To achieve complete processing,
the final substrate concentration used for the truncated
enzyme was 2.5 lm. It was observed that the addition
of non-ionic Triton X-100 increased the activity of the
enzyme, whereas the addition of sodium deoxycholate
(ionic) or sulfobetain SB12 (zwitterionic) detergents
rendered the enzyme inactive (data not shown). The
apparent second-order rate constant k
cat
⁄ K
m
of the
truncated enzyme was found to be 59.4 ± 6.4 m
)1
Æs
)1
(Fig. 7) in the presence of 0.5% Triton X-100. The
specific activity was halved in the absence of detergents
(data not shown). Three different concentrations of
Triton X-100 were tested (0.1%, 0.5% and 1%) and it
was found that the activity was maximum at 1%,
although the difference between 0.5% and 1% was
minor (data not shown). Detergent-dependent activity
of truncated SPase was first reported for E. coli LepB
[40]. Among the Gram-positive bacteria, detergent-
Fig. 5. Site of self-cleavage of SpsB in comparison with Spi and
SipS: alignment of SpsB with Spi and SipS sequences showing the
sites of self-cleavage. The )1 and )3 positions relative to the cleav-
age sites are shown in bold, the catalytic serine is shown in italics
and the site of self-cleavage is indicated by an arrow.
Fig. 6. N-terminal region of the SpsB sequence showing the differ-
ence between tr-SpsB and sc-SpsB: The starting points of the trun-
cated SpsB and the self-cleavage product of SpsB are indicated in
the SpsB sequence. The prediction of the transmembrane segment
(TMS) was carried out using the
PORTER server [39]. The predicted
TMS is shown in bold and the catalytic serine is shown in italics.
The conserved box B [6] is highlighted.
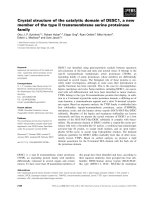
Fig. 4. Stability of SpsB (A) at different temperatures and (B) in the presence of arylomycin A
2
. (A) The stability of SpsB was tested by main-
taining 20 lL aliquots of purified SpsB at different temperatures for up to 9 days. The proteins were analyzed by SDS ⁄ PAGE followed by
staining with CBB. Lane 1, molecular weight marker; lane 2, SpsB stored at )80 °C; lanes 3–5, SpsB incubated for 4, 6 and 9 days respec-
tively at 4, 27 and 37 °C, showing the full-length SpsB and the sc-SpsB. (B) Purified full length SpsB was incubated without and with arylo-
mycin A
2
(final concentration of 200 lM)at37°C for 7 days and analyzed by SDS ⁄ PAGE. Lane 1, molecular weight marker; lane 2, SpsB
without arylomycin A
2
(time = 0); lane 3, SpsB without arylomycin A
2
incubated for 7 days; SpsB with arylomycin A
2
(time = 0); lane 4, SpsB
with arylomycin A
2
incubated for 7 days.
Rao C. V. S. et al. S. aureus type I signal peptidase SpsB
FEBS Journal 276 (2009) 3222–3234 ª 2009 The Authors Journal compilation ª 2009 FEBS 3227
dependent activity of the full-length SPase has been
reported in S. pneumoniae, Spi [21], and in three of the
four SPases (SipX, SipY and SipZ) of S. lividans [41].
In S. lividans, a truncated SipY derivative devoid of
the C-terminal anchor was shown to be stimulated by
detergents, albeit to a lesser extent compared to the
full-length derivative [41]. However, truncated SipS
from B. subtilis was reported to have detergent-inde-
pendent activity [28]. The effect of detergent on the
truncated SPase is most likely protein specific.
Although it is not clear at this stage, the tr-SpsB
probably has a better conformation in the presence of
detergent, which could partially make up for the lack
of the hydrophobic membrane segment.
Additionally, a truncated mutant in which the cata-
lytic serine was replaced by alanine (data not shown)
was used as a control in the FRET assay. This mutant
had a k
cat
⁄ K
m
value of 4 ± 0.8 m
)1
Æs
)1
, which is 14.8-
fold lower than the active truncated or tr-SpsB and
462-fold lower than the full-length enzyme (Fig. 7B).
This also confirmed that the activity observed in the
in vitro assay is specifically a result of the enzyme SpsB
and is not caused by background activity of LepB of
E. coli (which was used as the host for overproduction
of SpsB).
The importance of the transmembrane segment for
optimum activity of the SPases was also confirmed by
these results, which revealed a 30-fold reduction in the
specific activity of the tr-SpsB compared to the full-
length enzyme. A similar reduction in activity has been
reported with truncated derivatives of LepB from
E. coli and SipS from B. subtilis and it was also shown
that these enzymes maintain their high in vitro cleavage
fidelity [42].
Interestingly, the observed activity of the truncated
SpsB contrasts with that of sc-SpsB, the fragment
obtained after self-cleavage, which was unable to
cleave the substrate in the in vitro assay. The tr-SpsB
has nine additional amino acids at the N-terminus
compared to sc-SpsB and three of these are part of the
conserved box B region (Fig. 6). In E. coli LepB, the
crystal structure [14] and modelling data [43] revealed
that some of these corresponding amino acids are a
part of the substrate binding pocket. Furthermore,
NMR experiments on the truncated derivative of LepB
enzyme also showed that five of these amino acids are
perturbed by substrate binding [17], highlighting their
significance. In SpsB, it is also likely that one or more
of the amino acids immediately preceding the catalytic
serine form a part of the substrate-binding pocket.
They might also contribute to the correct folding and
conformation of the enzyme.
In conclusion, SpsB has certain common characteris-
tics typical for SPases, which include a requirement for
high pH and autocatalytic activity. The transmem-
brane segment and some of the amino acid residues
preceding the catalytic serine are found to be impor-
tant for optimum activity. The FRET assay is suitable
for high-throughput screening of compounds against
SpsB, and the preprotein processing assay involving
the physiologically relevant substrate pre-IsaA can
serve as a confirmatory assay for identifying SpsB
inhibitors. We are currently testing compound libraries
for potential inhibitors using these assays. This line of
research has the potential to result in a new class of
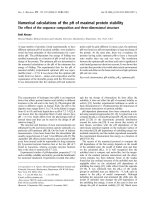
Fig. 7. A comparison of the activities of the full-length and the
truncated SpsB derivatives. (A) The enzyme assay was performed
using a final concentration of 5 l
M (where [S]<<K
m
) of the
synthetic SceD peptide with the full-length (2 l
M), truncated (2 lM)
and an active site mutant (10 l
M) of SpsB in a reaction buffer at
37 °C. Fluorescent intensity was measured as a function of time
using InfiniteÔ M200. (B) The specific enzymatic activity k
cat
⁄ K
m
of
the full-length and the truncated SpsB were compared using
varying concentrations of enzymes and a fixed concentration of the
peptide substrate (5 l
M for the full-length and 2.5 lM for the
truncated). The pseudo-first-order rate constant K
obs
was plotted as
a function of enzyme concentration.
S. aureus type I signal peptidase SpsB Rao C. V. S. et al.
3228 FEBS Journal 276 (2009) 3222–3234 ª 2009 The Authors Journal compilation ª 2009 FEBS
antibiotics that will contribute to tackling the problem
of drug resistance in S. aureus.
Experimental procedures
Bacterial strains, growth conditions and plasmids
E. coli strains TG1 [44] and BL21(DE3)pLysS [45], used for
genetic manipulations and protein expression, respectively,
were grown at 37 °C in LB medium, supplemented with
ampicillin (50 lgÆmL
)1
) or chloramphenicol (25 lgÆmL
)1
),
where applicable. The plasmids used are listed in Table 1.
General molecular genetic techniques
DNA manipulations in E. coli were carried out as described
previously [44]. Plasmid DNA isolation, gel electrophoresis
and PCR clean-up were carried out using commercial kits
(Promega, Madison, WI, USA) according to the manufac-
turer’s instructions.
Cloning of spsB (full-length and truncated)
and isaA
The gene encoding SpsB was amplified by PCR from
S. aureus ATCC 65388 genomic DNA as template using
the oligonucleotides fl-SpsB5 and fl-SpsB3 for the full-
length and oligonucleotides tr-SpsB5 and fl-SpsB3 for the
truncated derivative, respectively. The oligonucleotides were
designed based on the spsB gene sequence (source: http://
cmr.jcvi.org/tigr-scripts/CMR/CmrHomePage.cgi). The oli-
gonucleotide sequences are provided in Table 2 and, as
indicated, a hexa-histidine encoding sequence was included
at the 5¢ end. The resulting PCR-amplified DNA fragments
were first cloned in pGEM-T Easy (Promega) and subse-
quently cloned as NdeI ⁄ EcoRI fragments into pET-3a
(Novagen, Madison, WI, USA) expression plasmid, which
was also cut with the same restriction enzymes.
The gene isaA was amplified from S. aureus genomic
DNA using oligonucleotides pIsaA5 and IsaA3Myc
(Table 2). The forward primer pIsaA5 contained a hexa-his-
tidine-encoding sequence and the reverse primer IsaA3Myc
contained a c-Myc-encoding sequence. PCR amplified
DNA was cloned in pGEM-T Easy and subsequently
cloned as a NcoI ⁄ EcoRI fragment into the corresponding
sites of pET-23d (Novagen).
Expression and purification of full-length SpsB
Expression of the protein was carried out essentially as
described previously [45]. E. coli BL21(DE3)pLysS cells
harbouring pET-fl-SpsB were grown in 600 ml LB medium
at 37 °C until D
600
of 0.6 was reached. Isopropyl thio-b-d-
galactoside was then added (final concentration of 1 mm).
Three hours later, the cells were pelleted by centrifugation
(4000 g at 4 °C for 10 min).
For purification of full-length SpsB, the cells were resus-
pended in 20 mL of 50 mm Tris-HCl, pH 8, containing
20% sucrose and lysed by three passages through a French
pressure cell at 15 000 psi. After removal of the cell debris
by centrifugation (12 000 g at 4 °C for 10 min), the cell
lysate was subjected to ultracentrifugation at 100 000 g for
Table 1. Plasmids used in the present study.
Plasmid Description Source
pGEM-T Easy 3¢-T overhang suited for cloning
PCR products; lacZ; Ampicillin
resistance (bla)
Promega
pET-3a T7 promoter; MCS; Ampicillin
resistance (bla)
Novagen
pET-23d T7 promoter; MCS; Ampicillin
resistance (bla)
Novagen
pET-fl-SpsB pET-3a derivative containing
hexa-his-encoding sequence
(5¢ end) and spsB between
NdeI and EcoRI
Present study
pET-tr-SpsB pET-3a derivative containing
hexa-his-encoding sequence
and 5¢ end truncated spsB
between NdeI and EcoRI
Present study
pET-pIsaA pET-23d derivative containing
hexa-his- (5¢ end) and c-Myc-
(3¢ end) encoding sequence
with pre-IsaA (immunodominant
staphylococcal antigen A precursor)
gene between NcoI and EcoRI.
Present study
Table 2. Oligonucleotides used in the present study. Restriction sites are underlined, the hexa-histidine-encoding sequence is shown in
italics and the c-myc-encoding sequence is shown in bold.
Oligonucleotide Sequence (5¢-to3¢) Restriction site
fl-SpsB5 TA
CATATGCACCATCACCATCACCATAAAAAAGAATTATTGGAATGGATTATTTC NdeI
fl-SpsB3 TA
GAATTCTTAATTTTTAGTATTTTCAGG EcoRI
tr-SpsB5 TA
CATATGCACCATCACCATCACCATATTGTTACACCATATA NdeI
pIsaA5 TA
CCATGGCACATCACCATCACCATCACAAAAAGACAATTATGGC NcoI
IsaA3Myc TA
GAATTCTTACAGATCCTCCTCTGAGATGAGCTTCTGCTCGAATCCCCAAGCACCTAAACC EcoRI
Rao C. V. S. et al. S. aureus type I signal peptidase SpsB
FEBS Journal 276 (2009) 3222–3234 ª 2009 The Authors Journal compilation ª 2009 FEBS 3229
2 h. The pellet was resuspended in 5 mL of buffer A
(50 mm NaH
2
PO
4
, 300 mm NaCl, pH 8.0) containing
10 mm imidazole and 0.5% of Triton X-100. The sample
was transferred onto a polypropylene column (Qiagen
GmbH, Hilden, Germany) loaded with Ni-NTA superflow
(IBA GmbH, Go
¨
ttingen Germany) and pre-equilibrated
with buffer A containing 10 mm imidazole. The column
was placed on ice on a rotary shaker (45 r.p.m.) for 1 h.
The column was washed twice with buffer A containing 10
and 20 mm imidazole, respectively, in the presence of
0.05% Triton X-100. Samples were eluted in two steps: first
with buffer A containing 100 mm imidazole and then with
buffer A containing 250 mm imidazole in the presence
of 0.05% Triton X-100. For analysis of purity, 4 lLof
6 · SDS ⁄ PAGE loading buffer was added to 20 lLof
different elution fractions and incubated at 37 °C for
10 min followed by loading on 12.5% SDS ⁄ PAGE gels.
After separation of the proteins, the gel was stained with
Coomassie brilliant blue (CBB).
Expression and purification of the truncated
SpsB
For production of the truncated SpsB, E. coli BL21(DE3)-
pLysS was transformed with the plasmid pET-tr-SpsB. The
cell pellet obtained from 600 mL of culture of E. coli
BL21(DE3)pLysS harbouring pET-tr-SpsB was resuspended
in 10 mL of buffer A with 10 mm imidazole and passed three
times through a French pressure cell at 15 000 psi. After cen-
trifugation (12 000 g at 4 °C for 10 min), the clarified sample
was taken for purification by Ni
2+
-affinity chromatography
as described for the full-length SpsB. The eluted fractions
were pooled and subjected to buffer exchange on PD-10
desalting column (GE Healthcare UK Limited, Chalfont
St Giles, UK). The sample eluted in 50 mm HEPES buffer,
pH 7.4, was further purified by cation exchange chromatog-
raphy using HiTrap SP FF column on AKTAprimeÔ plus
(GE Healthcare) in accordance with the manufacturer’s
instructions. The fractions containing tr-SpsB were passed
through a PD-10 desalting column and eluted in 50 mm
Tris-HCl pH 8. The purified protein was observed on
CBB-stained SDS ⁄ PAGE gel and subsequently used in the
in vitro assay.
Expression and purification of pre-IsaA
Pre-IsaA (with a hexa-his-tag at the N-terminus and a
c-Myc tag at the C-terminus) was expressed in E. coli
BL21(DE3)pLysS cells harbouring pET-pIsaA. Isopropyl
thio-b-d-galactoside induction was carried out as described
above. Additionally, sodium azide (final concentration
of 1 mm) was added to prevent the translocation of the
preprotein and subsequent cleavage of the signal peptide.
Pre-IsaA was purified under denaturing conditions (8 m
urea) by Ni
2+
-affinity chromatography in accordance with
the manufacturer’s instructions (The QIAexpressionistÔ;
Qiagen, USA). Removal of urea and subsequent protein
renaturation was carried out using PD10 columns. The
sample was eluted from the column in buffer containing
50 mm Tris-HCl pH 8 and 0.5% Triton X-100. The purified
protein was then analyzed by SDS ⁄ PAGE followed by
western blotting.
In vitro activity assay for SpsB using the
preprotein pre-IsaA
The concentrations of the purified proteins were determined
by a Bio-Rad protein assay (Bio-Rad Laboratories GmbH,
Mu
¨
nchen, Germany) based on the method of Bradford. The
enzyme SpsB (pre-treated with a protease inhibitor cocktail
tablet; complete Mini, EDTA-free; Roche Diagnostics
GmbH, Mannheim, Germany) and pre-IsaA were added to
assay buffer (50 mm Tris-HCl, pH 8, with 0.5% Triton
X-100) to achieve final concentrations of 2 lm and 10 lm,
respectively, in a total volume of 20 lL and incubated at
37 °C for different periods of time in the range 0–15 h. For
the preprotein assay in the presence of inhibitor, arylomycin
A
2
(final concentration of 200 lm) was added to a reaction
mixture containing SpsB (final concentration of 1 lm) in the
assay buffer and incubated for 5 min at 37 °C followed by
the addition of pre-IsaA (10 lm). The reactions were stopped
by addition of 4 lLof6· SDS ⁄ PAGE sample loading buf-
fer. The proteins were separated by SDS ⁄ PAGE using
12.5% (w ⁄ v) PAA resolving gels and subsequently trans-
ferred to a nitrocellulose membrane (Macherey Nagel,
Du
¨
ren, Germany). For western blotting, anti-cMyc (DiaMed
Benelux NV, Belgium) and anti-mouse IgG (whole-
molecule)-alkaline phosphatase sera produced in rabbit
(Sigma, St Louis, MO, USA) were used and chemi-
lumeniscent detection was carried out using the Western
Star
TM
kit (Tropix, Bedford, MA, USA) in accordance with
the manufacturer’s instructions.
Specificity of the cleavage of the SceD peptide
by SpsB
The synthesis and validation of the SceD peptide as a gen-
eral SPase I substrate will be described elsewhere
(K. Bockstael, N. Geukens, S. Rao C.V., J. Anne
´
, P. Herd-
ewijn, J. Anne
´
& A. Van Aerschot, unpublished results).
Additional SceD peptide for further work was obtained by
custom peptide synthesis (Peptide Protein Research Ltd,
Wickham, UK). The proteolysis of the peptide substrate
was performed under conditions similar to those used to
obtain previously reported experimental data [31] with
some modifications (K. Bockstael, N. Geukens, S. Rao
C.V., J. Anne
´
, P. Herdewijn & A. Van Aerschot, unpub-
lished results). In brief, SpsB and SceD peptide (at final
concentrations of 1 lm and 500 lm, respectively) were incu-
bated at 37 °C for 15 h in a total reaction volume of
S. aureus type I signal peptidase SpsB Rao C. V. S. et al.
3230 FEBS Journal 276 (2009) 3222–3234 ª 2009 The Authors Journal compilation ª 2009 FEBS
40 lL. A negative control reaction without SpsB was
included. The reactions were stopped by the addition of
trifluoroacetic acid. After centrifugation, supernatants from
the samples were applied to a RP-HPLC column. The
resulting fractions were collected, lyophilized and subse-
quently subjected to ESI-MS analysis.
FRET assay
The reaction mixtures contained SpsB (pretreated with pro-
tease inhibitor cocktail) and SceD peptide (dissolved in
dimethylformamide) at final concentrations of 1 and 10 lm,
respectively, in the assay buffer (50 mm Tris-HCl, pH 8,
with 0.5% Triton X-100) and the reactions were carried out
in 96-well (black, clear bottom) microtitre plates (Greiner
Bio One, Frickenhausen, Germany) at 37 °C in a total
volume of 100 lL. The enzyme was initially pre-incubated
in the buffer for 5 min at 37 °C and the reaction was
started by the addition of the substrate. Fluorescence inten-
sity measurements were taken as a function of time using
InfiniteÔ M200 automated microplate reader (Tecan
Austria GmbH, Gro
¨
dig, Austria). The excitation and
emission wavelengths used were 340 and 510 nm
respectively. The data obtained were fitted by nonlinear
curve fitting on OriginÒ Pro 7.5 (OriginLab Corporation,
Northampton, MA, USA) using the equation y =[A
0
(1 –
e
(–kt)
)] + B0, to achieve the first-order rate constant
k = K
obs
. The specific enzymatic activity was calculated
using the equation k
cat
⁄ K
m
= k
obs
⁄ [Enz].
The specific enzymatic activity or apparent second order
rate constant k
cat
⁄ K
m
of the full-length and the truncated
SpsB were measured with varying concentrations of the
enzymes (freshly purified) and a fixed concentration of the
peptide substrate, wherein [S]<<K
m
(apparent). The final
concentration of the substrate was 5 lm for the full-length
and 2.5 lm for the truncated enzyme.
FRET-assay with the inhibitor arylomycin A
2
The inhibitor arylomycin A
2
(Basilea Pharmaceutica Ltd.,
Basel, Switzerland) was dissolved in dimethylsulfoxide and
diluted to obtain different stock concentrations. For the
in vitro assay, the reaction mixtures containing SpsB (final
concentration of 1 lm) with different concentrations of
arylomycin A
2
were incubated in the assay buffer for
15 min. The final concentration of dimethylsulfoxide in
each reaction mixture was 2%. The fluorogenic synthetic
peptide SceD (5 or 10 lm) was added and fluorescence
intensity was measured as a function of time. For dose-
dependent response and determination of IC
50
, ten different
concentrations of arylomycin A
2
were used (two-fold
dilutions with a final concentration in the range 12.5–
0.0244 lm) and the substrate concentration was 10 lm
(final concentration). Percent inhibition was calculated
using the equation [(1 – (v
i
⁄ v
0
)] · 100, where v
i
is the initial
velocity in the presence of inhibitor, v
0
is the initial velocity
in the absence of inhibitor but with (2%) dimethylsulfoxide.
The IC
50
value was determined by fitting the percent
inhibition versus inhibitor concentration using the Morgan–
Mercer–Flodin model for a sigmoidal curve (Eqn 2).
y ¼
ab þ cx
d
b þ x
d
ð2Þ
Activity at varying pH
For determination of optimum pH, the in vitro preprotein
processing assay was carried out in buffers of varying pH:
Glycine-HCl buffer, pH 2; citric acid ⁄ sodium citrate buffer,
pH 3, 4 and 5; Clark and Lubs solutions: KH
2
PO
4
⁄ NaOH,
pH 6 and 7; Tris-HCl buffer, pH 7, 7.5, 8 and 8.5 and 9;
glycine-NaOH buffer, pH 9 and 10; carbonate buffer, pH
10.9; phosphate buffer, pH 11; and hydroxide-chloride, pH
12, prepared as previously described [46].
The pH-rate profile using the synthetic SceD peptide was
measured by calculating the k
cat
⁄ K
m
values of the full-length
enzyme incubated in buffers with varying pH. It should be
noted that the freshly purified enzyme was stored at 4 °C for
approximately 24 h before use in the reactions. The reactions
were carried out in a total volume of 100 lL with a final con-
centration of the enzyme of 1 lm. After a pre-incubation of
this reaction mixture for 5 min at 37 °C, the peptide sub-
strate was added at a final concentration of 5 lm
([S]<<K
m
). This was followed by measurement of fluores-
cence intensity as a function of time. The specific activity
obtained was plotted as a function of pH using Eqn (1).
Stability at different temperatures
Purified SpsB (pre-treated with a general protease inhibitor)
was aliquoted into polypropylene microfuge tubes (20 lLin
each) and allowed to stand at different temperatures (27, 37
or 4 °C) for a maximum of 9 days. All samples were initially
stored at )80 °C and collected in the reverse order for incu-
bation, meaning that ninth day samples were incubated first
followed by the sixth and the fourth and, finally, the 0 h
sample was removed just before preparing the samples for
loading on gel. For stability of SpsB in the presence of inhib-
itor arylomycin A
2
,18lL of purified length SpsB (stock
concentration of 31 lm) was incubated with 2 lL of arylo-
mycin A
2
(stock concentration of 2 mm) or dimethylsulfox-
ide (control) at 37 °C for 7 days. To these samples, 4 lLof
SDS ⁄ PAGE sample buffer was added and incubated for
10 min at 37 °C. The proteins were separated on 12.5% w ⁄ v
SDS ⁄ PAGE gels followed by staining with CBB.
N-terminal sequencing
The proteins were separated by SDS ⁄ PAGE using 12.5%
SDS ⁄ PAGE gels followed by electroblotting onto poly
Rao C. V. S. et al. S. aureus type I signal peptidase SpsB
FEBS Journal 276 (2009) 3222–3234 ª 2009 The Authors Journal compilation ª 2009 FEBS 3231
(vinylidene difluoride) membrane. The bands were visual-
ized after staining with CBB and destaining with methanol.
The proteins of interest (sc-SpsB and IsaA) were excised
from the membrane and N-terminal amino acid sequence
was determined by automated Edman degradation.
Acknowledgements
We thank Professor Dr Paul Proost (Katholieke Uni-
versiteit Leuven) for carrying out the N-terminal
sequencing; Philip Gutschoven for technical support;
Basilea Pharmaceutica (Basel, Switzerland) for the
kind gift of arylomycin A
2
; and Dr Richard Parlitz for
his valuable suggestions. We would also like to thank
three anonymous reviewers and Dr Lieve van Mellaert
and Dr David Coil (Katholieke Universiteit Leuven)
for their useful suggestions. Smitha Rao C. V. would
like to acknowledge the Interfaculty Council for
Development Co-operation of Katholieke Universiteit
Leuven for the IRO grant. Katrijn Bockstael is PhD
grant fellow of Research Foundation – Flanders. This
work was further supported by IWT (Institute for the
Promotion of Innovation by Science and Technology
in Flanders) via grant SBO 50164.
References
1 Casey AL, Lambert PA & Elliott TSJ (2007) Staphylo-
cocci. Int J Antimicrob Agents 29, S23–S32.
2 Chopra I (2003) Antibiotic resistance in Staphylococcus
aureus: concerns, causes and cures. Expert Rev Anti
Infect Ther 1, 45–55.
3 Projan SJ & Bradford PA (2007) Late stage antibacte-
rial drugs in the clinical pipeline. Curr Opin Microbiol
10, 441–446.
4 Garcı
´
a-Lara J, Masalha M & Foster SJ (2005) Staphy-
lococcus aureus: the search for novel targets. Drug
Discov Today 10, 643–651.
5 Van Bambeke F, Mingeot-Leclercq MP, Struelens MJ
& Tulkens PM (2008) The bacterial envelope as a target
for novel anti-MRSA antibiotics. Trends Pharmacol Sci
29, 124–34.
6 Paetzel M, Karla A, Strynadka NC & Dalbey RE
(2002) Signal peptidases. Chem Rev 102, 4549–
4580.
7 Tuteja R (2005) Type I signal peptidase: an overview.
Arch Biochem Biophys 441, 107–111.
8 Paetzel M, Dalbey RE & Strynadka NCJ (2000) The
structure and mechanism of bacterial type I signal pep-
tidases – a novel antibiotic target. Pharmacol Ther 87,
27–49.
9 Sung M & Dalbey RE (1992) Identification of potential
active-site residues in the Escherichia coli leader
peptidase. J Biol Chem 267, 13154–13159.
10 Tschantz WR, Sung M, Delgadopartin VM & Dalbey
RE (1993) A serine and a lysine residue implicated in
the catalytic mechanism of the Escherichia coli leader
peptidase. J Biol Chem 268, 27349–27354.
11 Black MT (1993) Evidence that the catalytic activity of
prokaryote leader peptidase depends upon the operation
of a serine-lysine catalytic dyad. J Bacteriol 175, 4957–
4961.
12 van Roosmalen ML, Geukens N, Jongbloed JD,
Tjalsma H, Dubois JY, Bron S, van Dijl JM & Anne
´
J
(2004) Type I signal peptidases of Gram-positive bacte-
ria. Biochim Biophys Acta 1694, 279–297.
13 Paetzel M, Chernaia M, Strynadka N, Tschantz W,
Cao G, Dalbey RE & James MN (1995) Crystallization
of a soluble, catalytically active form of Escherichia coli
leader peptidase. Proteins 23, 122–125.
14 Paetzel M, Dalbey RE & Strynadka NC (1998) Crystal
structure of a bacterial signal peptidase in complex with
a beta-lactam inhibitor. Nature 396, 186–190.
15 Paetzel M, Goodall JJ, Kania M, Dalbey RE & Page
MG (2004) Crystallographic and biophysical analysis of
a bacterial signal peptidase in complex with a lipopep-
tide-based inhibitor. J Biol Chem 279, 30781–30790.
16 Musial-Siwek M, Kendall DA & Yeagle PL (2008)
Solution NMR of signal peptidase, a membrane pro-
tein. Biochim Biophys Acta 1778
, 937–944.
17 Musial-Siwek M, Yeagle PL & Kendall DA (2008) A
small subset of signal peptidase residues are perturbed by
signal peptide binding. Chem Biol Drug Des 72, 140–146.
18 Tjalsma H, Noback MA, Bron S, Venema G, Yamane
K & van Dijl JM (1997) Bacillus subtilis contains four
closely related type I signal peptidases with overlapping
substrate specificities – constitutive and temporally
controlled expression of different sip genes. J Biol Chem
272, 25983–25992.
19 Chu HH, Hoang V, Kreutzmann P, Hofemeister B,
Melzer M & Hofemeister J (2002) Identification and
properties of type I-signal peptidases of Bacillus amylo-
liquefaciens. Eur J Biochem 269, 458–469.
20 Geukens N, Parro V, Rivas LA, Mellado RP & Anne
´
J
(2001) Functional analysis of the Streptomyces lividans
type I signal peptidases. Arch Microbiol 176, 377–380.
21 Peng SB, Wang L, Moomaw J, Peery RB, Sun PM,
Johnson RB, Lu J, Treadway P, Skatrud PL & Wang
QM (2001) Biochemical characterization of signal
peptidase I from gram-positive Streptococcus
pneumoniae. J Bacteriol 183, 621–627.
22 Cregg KM, Wilding I & Black MT (1996) Molecular
cloning and expression of the spsB gene encoding an
essential type I signal peptidase from Staphylococcus
aureus. J Bacteriol 178, 5712–5718.
23 Kavanaugh JS, Thoendel M & Horswill AR (2007) A
role for type I signal peptidase in Staphylococcus aureus
quorum sensing. Mol Microbiol 65, 780–798.
S. aureus type I signal peptidase SpsB Rao C. V. S. et al.
3232 FEBS Journal 276 (2009) 3222–3234 ª 2009 The Authors Journal compilation ª 2009 FEBS
24 Bendtsen JD, Nielsen H, von Heijne G & Brunak S
(2004) Improved prediction of signal peptides: SignalP
3.0. J Mol Biol 340, 783–795.
25 Lorenz U, Ohlsen K, Karch H, Hecker M, Thiede A &
Hacker J (2000) Human antibody response during sep-
sis against targets expressed by methicillin resistant
Staphylococcus aureus. FEMS Immunol Med Microbiol
29, 145–153.
26 Stapleton MR, Horsburgh MJ, Hayhurst EJ, Wright L,
Jonsson IM, Tarkowski A, Kokai-Kun JF, Mond JJ &
Foster SJ (2007) Characterization of IsaA and SceD,
two putative lytic transglycosylases of Staphylococcus
aureus. J Bacteriol 189, 7316–7325.
27 Talarico TL, Barkocy-Gallagher GA, Ray PH &
Bassford PJ Jr (1993) In vitro processing by signal
peptidase I of precursor maltose-binding protein species
with alterations in and around the signal peptide.
Biochem Biophys Res Commun 197, 1154–1166.
28 van Roosmalen ML, Jongbloed JD, de Jonf A, van
Eerden J, Venema G, Bron S & van Dijl JM (2001)
Detergent-independent in vitro activity of a truncated
Bacillus signal peptidase. Microbiology 147, 909–917.
29 Geukens N, Frederix F, Reekmans G, Lammertyn E,
Van Mellaert L, Dehaen W, Maes G & Anne
´
J (2004)
Analysis of type I signal peptidase affinity and specific-
ity for preprotein substrates. Biochem Biophys Res
Commun 314, 459–467.
30 Nielsen H, Engelbrecht J, Brunak S & von Heijne G
(1997) Identification of prokaryotic and eukaryotic
signal peptides and prediction of their cleavage sites.
Protein Eng 10, 1–6.
31 Zhong W & Benkovic SJ (1998) Development of an
internally quenched fluorescent substrate for Escherichia
coli leader peptidase. Anal Biochem 255, 66–73.
32 Paetzel M, Strynadka NC, Tschantz WR, Casareno R,
Bullinger PR & Dalbey RE (1997) Use of site-directed
chemical modification to study an essential lysine in
Escherichia coli leader peptidase. J Biol Chem 272,
9994–10003.
33 Tipton KF & Dixon HB (1979) Effect of pH on
enzymes. Methods Enzymol 63, 183–234.
34 Brocklehurst K & Dixon HB (1976) pH-dependence of
the steady-state rate of a two-step enzymic reaction.
Biochem J 155, 61–70.
35 van Roosmalen ML, Jongbloed JD, Kuipers A, Venema
G, Bron S & van Dijl JM (2000) A truncated soluble
Bacillus signal peptidase produced in Escherichia coli is
subject to self-cleavage at its active site. J Bacteriol 182,
5765–5770.
36 Talarico TL, Dev IK, Bassford PJ Jr & Ray PH (1991)
Inter-molecular degradation of signal peptidase I
in vitro. Biochem Biophys Res Commun 181, 650–656.
37 Wang Y, Bruckner R & Stein RL (2004) Regulation of
signal peptidase by phospholipids in membrane:
characterization of phospholipid bilayer incorporated
Escherichia coli signal peptidase. Biochemistry 43,
265–270.
38 Krogh A, Larsson B, von Heijne G & Sonnhammer EL
(2001) Predicting transmembrane protein topology with
a hidden Markov model: application to complete
genomes. J Mol Biol 305, 567–580.
39 Pollastri G & McLysaght A (2005) Porter: a new,
accurate server for protein secondary structure
prediction. Bioinformatics 21, 1719–1720.
40 Tschantz WR, Paetzel M, Cao G, Suciu D, Inouye M
& Dalbey RE (1995) Characterization of a soluble,
catalytically active form of Escherichia coli leader
peptidase: requirement of detergent or phospholipid for
optimal activity. Biochemistry 34, 3935–3941.
41 Geukens N, Lammertyn E, Van Mellaert L,
Engelborghs Y, Mellado RP & Anne
´
J (2002) Physical
requirements for in vitro processing of the Streptomyces
lividans signal peptidases. J Biotechnol 96, 79–91.
42 Carlos JL, Paetzel M, Brubaker G, Karla A, Ashwell
CM, Lively MO, Cao G, Bullinger P & Dalbey RE
(2000) The role of the membrane-spanning domain of
type I signal peptidases in substrate cleavage site
selection. J Biol Chem 275, 38813–38822.
43 Choo KH, Tong JC & Ranganathan S (2008) Modeling
Escherichia coli signal peptidase complex with bound
substrate: determinants in the mature peptide
influencing signal peptide cleavage. BMC Bioinformatics
9: S15.
44 Sambrook J, Fritsch EF & Maniatis T (1989) Molecu-
lar Cloning: A laboratory manual, 2nd edition. Cold
Spring Harbor Laboratory Press, Cold Spring Harbor,
NY.
45 Studier FW & Moffatt BA (1986) Use of bacteriophage
T7 RNA polymerase to direct selective high-level
expression of cloned genes. J Mol Biol 189, 113–130.
46 Dawson RM, Elliott DC, Elliott WH & Jones KM
(1989) pH, Buffers and Physiological Media. Data for
Biochemical Research, 3rd edition. Oxford University
Press, London.
Supporting information
The following supplementary material is available:
Fig. S1. Purified fractions of (A) SpsB full-length and
(B) IsaA precursor.
Fig. S2. Emission scan of the reaction products con-
taining SceD peptide with or without SpsB.
Fig. S3. Inhibition of SpsB activity by arylomycin A
2
in the FRET assay. (A) Time-based scan. (B) Dose-
dependent response.
Fig. S4. Time-course of FRET assay with different
concentrations of SpsB.
Fig. S5. Effect of pH on the activity of SpsB observed
using the FRET assay.
Rao C. V. S. et al. S. aureus type I signal peptidase SpsB
FEBS Journal 276 (2009) 3222–3234 ª 2009 The Authors Journal compilation ª 2009 FEBS 3233
Fig. S6. Purified truncated SpsB.
Fig. S7. Preprotein processing by truncated SpsB in
comparison with the full-length SpsB.
This supplementary material can be found in the
online version of this article.
Please note: Wiley-Blackwell is not responsible for
the content or functionality of any supplementary
materials supplied by the authors. Any queries (other
than missing material) should be directed to the corre-
sponding author for the article.
S. aureus type I signal peptidase SpsB Rao C. V. S. et al.
3234 FEBS Journal 276 (2009) 3222–3234 ª 2009 The Authors Journal compilation ª 2009 FEBS