Báo cáo khoa học: Amino acid limitation regulates the expression of genes involved in several specific biological processes through GCN2-dependent and GCN2-independent pathways ppt
Bạn đang xem bản rút gọn của tài liệu. Xem và tải ngay bản đầy đủ của tài liệu tại đây (284.76 KB, 12 trang )
Amino acid limitation regulates the expression of genes
involved in several specific biological processes through
GCN2-dependent and GCN2-independent pathways
Christiane Deval, Ce
´
dric Chaveroux, Anne-Catherine Maurin, Yoan Cherasse, Laurent Parry, Vale
´
rie
Carraro, Dragan Milenkovic, Marc Ferrara, Alain Bruhat, Ce
´
line Jousse and Pierre Fafournoux
Unite
´
de Nutrition Humaine, Equipe Ge
´
nes-Nutriments, Saint Gene
`
s Champanelle, France
In mammals, amino acids exhibit two important char-
acteristics: (a) nine amino acids are essential for health
in adult humans, and (b) amino acids are not stored,
which means that essential amino acids must be
obtained from the diet. Consequently, amino acid
homeostasis may be altered in response to malnutrition
[1,2] with two major consequences: (a) a large varia-
tion in blood amino acid concentrations, and (b) a
negative nitrogen balance. In these situations, individu-
als must adjust several physiological functions involved
in the defense ⁄ adaptation response to amino acid limi-
tation. For example, after feeding on an amino acid-
imbalanced diet, an omnivorous animal recognizes the
amino acid deficiency and subsequently develops a
taste aversion [3]. It has been shown that the mecha-
nism underlying the recognition of protein quality acts
through the sensing of free circulating amino acids
resulting from the intestinal digestion of proteins [4,5].
Another example of the detection of the lack of an
amino acid is metabolic adaptation to cope with epi-
sodes of protein malnutrition. In these circumstances,
amino acid availability regulates fatty acid homeostasis
in the liver during the deprivation of an essential
amino acid [6]. These examples demonstrate that
Keywords
amino acid; GCN2; gene expression;
rapamycin; TORC1
Correspondence
P. Fafournoux, UMR 1019, Unite
´
Nutrition
Humaine, INRA de Theix, 63122 St Gene
`
s
Champanelle, France
Fax: +33 4 73 62 47 55
Tel: +33 4 73 62 45 62
E-mail:
(Received 6 May 2008, revised 29 October
2008, accepted 25 November 2008)
doi:10.1111/j.1742-4658.2008.06818.x
Evidence has accumulated that amino acids play an important role in con-
trolling gene expression. Nevertheless, two components of the amino acid
control of gene expression are not yet completely understood in mammals:
(a) the target genes and biological processes regulated by amino acid avail-
ability, and (b) the signaling pathways that mediate the amino acid
response. Using large-scale analysis of gene expression, the objective of this
study was to gain a better understanding of the control of gene expression
by amino acid limitation. We found that a 6 h period of leucine starvation
regulated the expression of a specific set of genes: 420 genes were up-regu-
lated by more than 1.8-fold and 311 genes were down-regulated. These
genes were involved in the control of several biological processes, such as
amino acid metabolism, lipid metabolism and signal regulation. Using
GCN2) ⁄ ) cells and rapamycin treatment, we checked for the role of
mGCN2 and mTORC1 kinases in this regulation. We found that (a) the
GCN2 pathway was the major, but not unique, signaling pathway involved
in the up- and down-regulation of gene expression in response to amino
acid starvation, and (b) that rapamycin regulates the expression of a set of
genes that only partially overlaps with the set of genes regulated by leucine
starvation.
Abbreviations
ARE, A ⁄ U-rich element; aRNA, amplified RNA; Asns, asparagine synthetase; ATF4, activating transcription factor 4; CAT-1, cationic amino
acid transporter-1; Chop, CCAAT ⁄ enhancer binding protein homologous protein; Cy, cyanine; Dusp16, dual specificity phosphatase 16; Egr1,
early growth response 1; GO, gene ontology; Hmgcs1, 3-hydroxy-3-methylglutaryl-CoA synthase 1; Idi1, isopentenyl-diphosphate delta
isomerase 1; Ifrd1, interferon-related developmental regulator 1; MEF, mouse embryonic fibroblast; Ndgr1, N-myc downstream-regulated
gene 1; Sqstm1, sequestosome 1; Trb3, tribbles homolog 3.
FEBS Journal 276 (2009) 707–718 Journal compilation ª 2008 FEBS. No claim to original French government works 707
mammals regulate several physiological functions to
adapt their metabolism to the amino acid supply. It
has been shown that nutritional and metabolic signals
play an important role in controlling gene expression
and physiological functions. However, currently, the
mechanisms involved in this process are not completely
understood in mammals [7].
Conversely, in prokaryotes and lower eukaryotes,
the regulation of gene expression in response to
changes in the nutritional environment has been well
documented. For example, the regulation of gene
expression in response to amino acid availability has
been studied extensively in yeast [8]. The GCN2 and
TOR kinases sense the intracellular concentration of
amino acids. In addition, yeast cells possess an amino
acid sensing system, localized at the plasma membrane,
that transduces information regarding the presence of
extracellular amino acids [9,10]. In addition to these
general control processes, yeast uses three specific con-
trol processes, whereby a subset of genes is coordi-
nately induced by starvation of the cell for one single
amino acid [11].
In mammals, our knowledge of the regulation of gene
expression by amino acid availability is more limited.
Investigations at the molecular level have thus far
focused only on the translational control of cationic
amino acid transporter-1 (CAT-1) expression [12,13]
and the transcriptional regulation of asparagine synthe-
tase (Asns) [14] and CCAAT ⁄ enhancer binding protein
homologous protein (Chop) [15] (for a review, see
[7,16]). Chop and Asns gene transcription is regulated
by a cis-element located in the promoter of these genes,
which is known as the amino acid response element
[14,17]. The signaling pathway responsible for this regu-
lation involves the kinase GCN2, which is activated by
free tRNA accumulation during amino acid starvation
[7,18]. Once activated, GCN2 phosphorylates the trans-
lation initiation factor, eukaryotic initiation factor 2a,
thereby impairing the synthesis of the 43S preinitiation
complex and thus strongly inhibiting translation initia-
tion. Under these circumstances, activating transcrip-
tion factor 4 (ATF4) is translationally up-regulated as a
result of the presence of upstream ORFs in the 5¢-UTR
of its mRNA [19,20]. ATF4 then binds the amino acid
response element and induces the expression of target
genes [18,21,22]. It has also been shown that mTORC1
inhibition by amino acid starvation affects gene expres-
sion, but the molecular mechanisms involved in this
process have not been described [23].
Two components of the amino acid control of gene
expression are not yet completely understood in mam-
mals: (a) the genes and biological processes regulated
by amino acid availability, and (b) the signaling path-
ways that mediate the amino acid response. In this
study, using transcriptional profiling, we identified a
set of genes regulated by amino acid depletion. We
also showed that the GCN2 pathway is the major, but
not unique, signaling pathway involved in the up- and
down-regulation of gene expression in response to
amino acid starvation.
Results
Amino acid starvation triggers changes in gene
expression
In order to identify amino acid-regulated genes, mouse
embryonic fibroblast (MEF) cells were starved of leu-
cine. A 6 h incubation was chosen in order to capture
rapid changes in gene expression in response to amino
acid deficiency. Labeled probes synthesized from cellu-
lar mRNA were hybridized to oligonucleotide micro-
arrays capable of detecting the expression of about
25 000 different mouse genes and expressed sequence
tags. We found that about 85% of the genes repre-
sented on the microarray were expressed in MEF cells.
We considered that a gene was expressed when its cor-
responding spot gave a measured signal threefold
higher than the background in the control medium.
We then measured the effect of amino acid depletion
on gene expression. The results are given as the induc-
tion ratio between the expression levels measured in
amino acid-deficient medium versus the control
medium.
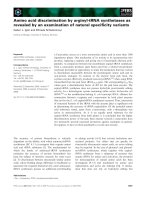
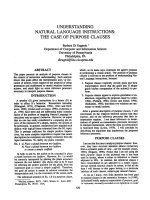
In wild-type MEF cells (GCN2+ ⁄ +), 731 genes
were regulated by leucine starvation: 420 genes were
up-regulated by more than 1.8-fold and 311 genes were
down-regulated by more than 1.8-fold (Fig. 1 and
Table S1). These genes were classified into functional
categories according to the gene ontology (GO) anno-
tation (Table 1). This analysis revealed that the up-reg-
ulated genes belonged to GO categories such as the
regulation of transcription, defense response, transport
and signal transduction. The down-regulated genes
were involved in lipid metabolic processes, regulation
of transcription, signal transduction and carbohydrate
metabolic processes. These results suggest that amino
acid shortage could regulate specific physiological
functions.
The expression of a set of genes is regulated by
amino acid starvation independent of the GCN2
pathway
In mammals, the GCN2 pathway is the only mecha-
nism described at the molecular level that is involved
Regulation of gene expression by amino acid limitation C. Deval et al.
708 FEBS Journal 276 (2009) 707–718 Journal compilation ª 2008 FEBS. No claim to original French government works
in the regulation of gene expression in response to
amino acid starvation. However, comparison of the
regulatory mechanisms involved in the control of gene
expression by amino acid availability between yeast
and mammals suggests that one or more control pro-
cesses other than the GCN2 pathway could be
involved in mammalian cells (see introduction). To
address this question, we used MEF cells either
expressing or not expressing GCN2 (GCN2+ ⁄ + and
GCN2) ⁄ ) cells).
In GCN2) ⁄ ) cells, 108 genes were regulated by
amino acid starvation: 88 genes were induced and 20
genes were repressed by more than 1.8-fold in response
to amino acid starvation (Fig. 1 and Table S1). Focus-
ing on the effect of GCN2, we considered that a gene
was GCN2 dependent when it was not regulated in
GCN2) ⁄ ) cells, and GCN2 independent when more
than 75% of its induction (or repression) in response
to amino acid starvation was maintained in GCN2) ⁄ )
cells. A gene was considered to be partially GCN2
dependent if its induction ratio was decreased but
remained higher than 1.8-fold in GCN2) ⁄ ) cells.
Among the genes regulated by amino acid starvation,
61% were GCN2 dependent, 18% were GCN2 inde-
pendent and 21% were partially GCN2 dependent
(Table S1). As the GCN2 pathway regulates gene
expression via transcription factor ATF4, we deter-
mined the ATF4 dependence of a few GCN2-depen-
dent genes [Chop, Asns, tribbles homolog 3 (Trb3)
and system A transporter 2]. Our results showed that
these genes were no longer regulated by amino acid
starvation in ATF4) ⁄ ) cells (data not shown), suggest-
ing that GCN2-dependent regulation of these genes
was accomplished via the function of ATF4. Taken
together, these results demonstrate that the GCN2
pathway is the major, but not unique, mechanism
involved in the amino acid control of gene expression
in mammals.
400
Genes induced by leucine starvation
(420)
0
100
200
300
100
Genes repressed by leucine starvation
(88)
(20)
300
200
400
GCN2+/+ GCN2–/–
Number of genes
(311)
Fig. 1. Global behavior of gene expression on leucine starvation in
GCN2+ ⁄ + and GCN2) ⁄ ) MEF cells. The number of genes exhibit-
ing changes in their expression level after 6 h of leucine starvation.
Filled bars, expression level increased by more than 1.8-fold;
hatched bars, expression level decreased by more than 1.8-fold.
The details of the experiment are given in Table S1.
Table 1. Distribution of leucine starvation-responding mRNA cate-
gorized across GO biological processes. For each GO term, the
number of genes up- or down-regulated in response to amino acid
starvation is given.
Ontology ID Ontology terms
Up
regulated
genes
Down
regulated
genes
GO: 0045449 Regulation of transcription 49 19
GO: 0006952 Defense response 41 8
GO: 0006810 Transport 25 14
GO: 0007145 Signal transduction 23 19
GO: 0006412 Translation 20 9
GO: 0008283 Cell proliferation 17 4
GO: 0006508 Proteolysis 16 9
GO: 0016310 Phosphorylation 14 16
GO: 0006418 tRNA aminoacylation for
protein translation
11 2
GO: 0006629 Lipid metabolic process 10 25
GO: 0006915 Apoptosis 9 7
GO: 0006139 Nucleoside, nucleotide
and nucleic acid
metabolic
process
82
GO: 0008652 Amino acid biosynthetic
process
61
GO: 0007010 Cytoskeleton organization
and biogenesis
65
GO: 0005975 Carbohydrate metabolic
process
58
GO: 0006464 Protein modification
process
58
GO: 0006865 Amino acid transport 5 2
GO: 0006457 Protein folding 4 6
GO: 0006371 mRNA splicing 3 1
GO: 0016072 rRNA metabolic process 5 3
GO: 0007155 Cell adhesion 2 7
GO: 0006397 Pre-mRNA processing 2 0
GO: 0007154 Cell communication 2 0
GO: 0006259 DNA metabolic process 2 1
GO: 0022008 Neurogenesis 2 2
GO: 0001525 Angiogenesis 1 2
GO: 0051726 Regulation of cell cycle 1 3
GO: 0006333 Chromatin assembly ⁄
disassembly
12
GO: 0006732 Coenzyme metabolic
process
12
GO: 0006260 DNA replication 0 2
GO: 0006069 Glycolysis 0 5
GO: 0006936 Muscle contraction 0 2
Other 12 13
Biological process
unclassified (EST
and Riken)
112 102
C. Deval et al. Regulation of gene expression by amino acid limitation
FEBS Journal 276 (2009) 707–718 Journal compilation ª 2008 FEBS. No claim to original French government works 709
We measured the enrichment of the amino acid-
responding genes in both cell lines, and the results are
shown in Table 2. It is noticeable that the biological
processes regulated by amino acid starvation in
GCN2) ⁄ ) cells differed clearly from those regulated in
wild-type cells. For example, the genes involved in
amino acid metabolism were not regulated by amino
acid starvation in GCN2) ⁄ ) cells, whereas enrichment
for the genes involved in cholesterol biosynthesis pro-
cesses remained high in these cells. These results dem-
onstrate that GCN2 may be involved in the regulation
of particular physiological functions (such as amino
acid metabolism) when there is insufficient amino acid
availability.
Validation of the microarray results
As a genome-wide analysis over a time course would
have been very laborious, we chose a 6 h incubation
period to perform these studies. This time window was
chosen to: (a) avoid secondary effects of amino acid
starvation, and (b) to measure gene expression accu-
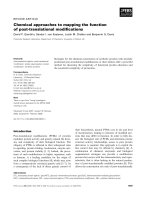
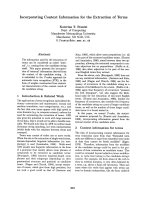
rately. We performed a kinetic analysis of the expres-
sion of four genes previously identified [24] as
belonging to different biological processes (Fig. 2A).
mRNA levels of early growth response 1 (Egr1) and
N-myc downstream-regulated gene 1 (Ndgr1) were
up-regulated in response to leucine starvation and
increased as a function of time. Isopentenyl-diphos-
phate delta isomerase 1 (Idi1) and 3-hydroxy-3-methyl-
glutaryl-CoA synthase 1 (Hmgcs1) mRNA contents
were down-regulated. The progressive change in the
mRNA contents of these genes shows that the regula-
tory mechanisms activated by leucine starvation are
turned on rapidly after amino acid removal (about
2–4 h). It also suggests that the regulation of gene
expression by leucine limitation is not caused by a sec-
ondary effect of amino acid starvation. These data
reinforce the choice of a 6 h time window to perform
microarray analysis.
In order to confirm the data obtained using micro-
arrays, we measured the expression of eight genes
regulated by amino acid starvation using quantitative
RT-PCR. We selected genes that were either repressed
(Hmgcs1) by amino acid starvation or induced by
amino acid starvation in a GCN2-dependent [Asns,
Table 2. Enrichment of the amino acid-regulated genes according to the biological process in which they are involved. Enrichment was
determined using
FATIGO software. (A) and (B) show the significantly enriched GO categories calculated from GCN2+ ⁄ + and GCN2) ⁄ ) cells,
respectively. In (B), the GO terms already present in (A) are not shown. For each cell line, only the most relevant and non-redundant terms
were reported. The FatiGO level is indicated for each GO category. A given GO category was considered to be significantly enriched when
its enrichment was higher than 1.8 and P < 0.05 (indicated in bold). The enrichment for a given GO category was computed as the ratio of
the distribution of the amino acid-regulated genes* versus the distribution of the genes spotted onto the microarray**. *Percentage of the
representation of one GO term among all the amino acid-regulated genes. **Percentage of the representation of one GO term among all
the genes present on the micro-array.
Ontology ID Ontology terms
GO
level
Gcn2+ ⁄ +
enrichment
Gcn2+ ⁄ +
P value
Gcn2) ⁄ )
enrichment
Gcn2) ⁄ )
P value
A
GO: 0009070 Serine family amino acid biosynthetic process 8 15 3.39e-02 0 1
GO: 0006695 Cholesterol biosynthetic process 9 8.5 2.20e-02 13.2 4.23e-01
GO: 0006418 tRNA aminoacylation for protein translation 9 6.3 1.12e-04 2.1 1
GO: 0007005 Mitochondrion organization and biogenesis 5 6.3 2.44e-02 15.9 1.31e-01
GO: 0006469 Negative regulation of protein kinase avtivity 8 4.8 3.76e-02 12.5 5.00e-02
G0: 0051094 Positive regulation of developmental process 5 4.6 4.45e-02 10.3 2.23e-01
GO: 0044262 Main pathways of carbohydrate metabolic
process
6 4.3 1.45e-02 6.7 4.04e-01
GO: 0006006 Glucose metabolic process 8 3.8 2.47e-02 3.5 1
GO: 0008285 Negative regulation of cell proliferation 6 3.4 2.85e-02 5.1 5.68e-01
GO: 0000074 Regulation of progression through cell cycle 6 2.7 1.12e-04 3.9 1.30e-01
GO: 0006955 Immune response 4 2.3 1.45e-02 2.3 1.45e-02
GO: 0009887 Organ morphogenesis 6 2.1 2.60e-02 3.0 3.55e-01
GO: 0043067 Regulation of programmed cell death 8 2.0 1.45e-02 2.0 1
G0: 0006915 Apoptosis 8 1.8 1.68e-02 2.6 2.15e-01
B
GO: 0006950 Response to stress 3 1.7 5.51e-02 3.8 1.91e-02
GO: 0030154 Cell differentiation 4 1.6 1.56e-03 2.6 1.91e-02
GO: 0050789 Regulation of biological process 3 1.3 2.42e-02 1.9 7.72e-03
Regulation of gene expression by amino acid limitation C. Deval et al.
710 FEBS Journal 276 (2009) 707–718 Journal compilation ª 2008 FEBS. No claim to original French government works
sequestosome 1 (Sqstm1), interferon-related develop-
mental regulator 1 (Ifrd1)], partially GCN2-indepen-
dent (Egr1, Trb3, Chop) or GCN2-independent (dual
specificity phosphatase 16, Dusp16) manner. Figure 2B
shows that the quantitative RT-PCR data are in good
agreement with the data presented in Table S1, thus
demonstrating the validity of the microarray exp-
eriments.
8
10
A
B
6
4
Fold changeFold change
EGR1
NDGR1
2
–2
2
4
81
(h)
IDI1
HMGCS1
–4
–6
–8
–10
6
9
Sqstm1
2
3
Asns
–1
–2
3
5
Fold change
Fold change
Fold change
Fold change
Fold change
Fold changeFold change
Fold change
1
Hmgsc1
–3
–4
4
3
2
1
Ifrd1
3
6
9
Trb3
(Trib3)
20
15
10
5
Chop
(Ddit3)
9
12
3
–/–
GCN2
+/+
–/–
GCN2
+/+
–/–
GCN2
+/+
–/–
GCN2
+/+ –/–
GCN2
+/+
–/–
GCN2
+/+ –/–
GCN2
+/+ –/–
GCN2
+/+
1
3
Egr1
6
Control 6 h
Amino acid
Starved 6 h
1
2
3
Dusp16
Fig. 2. Induction by amino acid starvation of
selected genes. (A) Time course analysis of
the mRNA content of Egr1, Ndgr1, Idi1 and
Hmgcs1 in response to leucine starvation.
The gene expression level was quantified by
quantitative RT-PCR. The results are given
as fold changes. (B) GCN2+ ⁄ + and
GCN2) ⁄ ) MEF cells were incubated for 6 h
in either control medium or medium starved
of leucine. RNA was then extracted and the
gene expression levels were quantified by
quantitative RT-PCR. Oligonucleotide
sequences are given in Materials and meth-
ods. Two independent experiments were
performed. Trb3, Chop and Egr1 belong to
the ‘regulation of transcription’ biological
process. Hmgsc1, Asns, Sqstm1, Ifrd1 and
Dusp16 are associated with a lipid metabolic
process, amino acid biosynthetic process,
defense response, neurogenesis and phos-
phorylation biological process, respectively.
C. Deval et al. Regulation of gene expression by amino acid limitation
FEBS Journal 276 (2009) 707–718 Journal compilation ª 2008 FEBS. No claim to original French government works 711
The mechanisms regulating GCN2-independent
gene expression by amino acid starvation involve
both transcriptional and post-transcriptional
regulation
It has been documented that the induction by amino
acid starvation of Chop, Atf3 or Cat-1 [15,25,26]
involves regulation at the level of transcription and
mRNA stability. The molecular mechanisms involved
in the regulation of GCN2-independent genes are not
understood. We investigated the role of transcription
in the amino acid regulation of three genes that were
either not or only partially regulated by the GCN2
pathway. To investigate the changes in the transcrip-
tion rate of one gene, the level of unspliced pre-
mRNA was measured. Given that introns are rapidly
removed from heterogeneous nuclear RNA during
splicing, this procedure is considered to be a means of
measuring transcription [27,28]. Quantitative RT-PCR
analysis with specific primers spanning an intron–exon
junction was used to amplify a transient intermediate
of the mRNA, whereas primers located in two differ-
ent exons were used to amplify the mature mRNA.
We chose to study the regulation of chemokine (C-X-
C motif) ligand 10 (Cxcl10), Egr1 (partially GCN2
independent) and Dusp16 (GCN2 independent)
because the structures of these genes were known. In
order to avoid any interference with the GCN2 path-
way, we performed this experiment in GCN2) ⁄ )
cells.
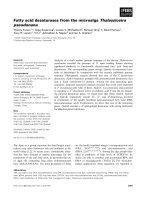
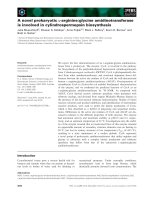
Figure 3 shows that both the pre-mRNA and
mature mRNA of Egr1 and Cxcl10 are similarly regu-
lated by amino acid starvation, suggesting that the reg-
ulation occurs mainly at the transcriptional level. By
contrast, the amount of pre-mRNA of Dusp16 is not
affected by amino acid starvation, but the amount of
mature transcript is increased. These results suggest
that the Dusp16 transcript is probably regulated at a
post-transcriptional level, such as mRNA stabilization,
splicing or nucleocytoplasmic transport. These results
show that the mechanisms responsible for the amino
acid regulation of gene expression in GCN2) ⁄ ) cells
involve both transcription and ⁄ or mRNA stabilization
and ⁄ or processing. However, we cannot exclude the
possibility that regulatory processes, such as mRNA
stabilization or processing, may also be regulated by
the GCN2 pathway.
Rapamycin triggers changes in gene expression
In addition to GCN2, cells possess another amino
acid-sensitive regulatory pathway, mTORC1, which is
inhibited by amino acid starvation. In order to address
the relative contribution of mTORC1 to the control of
gene expression, we used MEF cells (GCN2+ ⁄ + cells)
to generate transcriptional profiles in response to rapa-
mycin treatment (TORC1 inhibitor). For this experi-
ment, the RNG microarrays were no longer available,
and so the experiment was performed using Operon
microarrays.
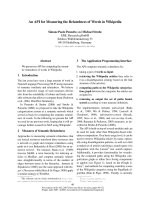
Cells were incubated for 6 h in a medium containing
50 nm rapamycin; the RNA was extracted and ana-
lyzed as described in Materials and methods. It was
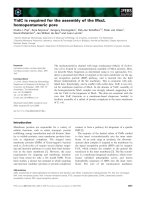
found that 622 genes were regulated by rapamycin
treatment: 444 genes were up-regulated by more than
1.8-fold, and 178 genes were down-regulated by more
than 1.8-fold (Fig. 4A and Table S2). These genes were
classified into functional categories according to GO
annotation (Fig. 4B). This analysis revealed that the
up- and down-regulated genes belonged to GO cate-
3
4 h 6 h
2
1
0
Fold change
Fig. 3. Regulation of unspliced mRNA of
CxCl10, Dusp16 and Egr1 in response to
amino acid starvation. GCN2) ⁄ ) cells were
incubated for 4 and 6 h in either a control
medium or a medium devoid of leucine.
Quantitative RT-PCR analyses were per-
formed using specific primers in order to
detect both primary transcripts and mature
mRNA (see Materials and methods for
details). Three independent experiments
were performed.
Regulation of gene expression by amino acid limitation C. Deval et al.
712 FEBS Journal 276 (2009) 707–718 Journal compilation ª 2008 FEBS. No claim to original French government works
gories such as regulation of transcription, transport
and signal transduction.
A comparison of the transcriptional profile induced
by rapamycin and amino acid deprivation revealed
that only 20 genes were regulated by both treatments
(Table S3). Rapamycin treatment and amino acid star-
vation had similar effects on the expression of 12 genes
and opposite effects on the regulation of eight genes.
These results suggest that rapamycin inhibition of
TORC1 modifies the expression of a set of genes that
only partially overlaps with the set of genes regulated
by amino acid deprivation.
Discussion
There is growing evidence that amino acids play an
important role in controlling gene expression. Using
transcriptional profiling, the objective of this work was
to gain a better understanding of the amino acid con-
trol of gene expression. As our aim was to study the
effects of short-term amino acid starvation, our experi-
mental protocol was designed to avoid the long-term
and secondary effects of amino acid starvation.
Our data demonstrate that a 6 h amino acid starva-
tion regulates the expression of a specific set of genes:
of the 25 000 genes spotted onto the microarray,
0.55% were up-regulated and 0.4% were down-regu-
lated in fibroblasts (> 1.8-fold). The expression levels
of the vast majority of genes (about 99%) remained
unaffected by amino acid starvation.
The mechanisms involved in the up-regulation of
gene expression by amino acid starvation in mammals
have been partially identified. Conversely, the signaling
pathways involved in the down-regulation of gene
expression remain unknown. The low percentage
(0.4%) of genes down-regulated by amino acid limita-
tion suggests that specific regulatory mechanisms are
involved. Our results clearly show that GCN2 is
involved in this process, at least for a certain set of
genes. The simplest hypothesis to explain the role of
this pathway is that GCN2 regulates ATF4, which, in
turn, negatively regulates transcription via the cAMP
response element, as shown in human enkephalin pro-
moter and other genes [29]. Another possibility may be
that a gene induced by the GCN2 ⁄ ATF4 pathway
could, in turn, inhibit gene expression. Further experi-
Genes induced by rapamycin treatment
(444)
0
100
200
300
400
Genes repressed by rapamycin treatment
100
200
Number of genes
(178)
Ontology ID Ontology Terms Up regulated
genes
Down regulated
genes
GO : 0045449 Regulation of transcription
GO : 0006810 Transport
GO : 0007165 Signal transduction
GO : 0006508 Proteolysis
GO : 0016310 Phosphorylation
GO : 0007155 Cell adhesion
GO : 0006952 Defense response
GO : 0030154 Cell differentiation
GO : 0006412 Translation
GO : 0006629 Lipid metabolic process
GO : 0005975 Carbohydrate metabolic process
GO : 0006397 mRNA processing
GO : 0006915 Apoptosis
GO : 0007242 Intracellular signaling cascade
GO : 0009117 Nucleotide metabolic process
GO : 0007049 Cell cycle
GO : 0006259 DNA metabolic process
GO : 0006457 Protein folding
GO : 0006364 rRNA processing
GO : 0007264 Small GTPase mediated signal transduction
GO : 0008283 Cell proliferation
GO : 0006260 DNA replication
GO : 0007186 G-protein coupled receptor protein signaling pathway
GO : 0000165 MAPKKK cascade
GO : 0006281 DNA repair
Other
Biological process unclassified
43
31
18
17
16
13
7
6
7
6
4
4
3
2
3
2
2
2
2
2
1
1
1
1
0
50
200
11
16
1
9
9
4
7
2
2
4
2
1
5
0
1
4
0
4
1
0
1
1
2
1
2
13
75
A
B
Fig. 4. Global behavior of gene expression
on rapamycin treatment in MEF cells. (A)
Number of genes exhibiting changes in their
expression level after 6 h of rapamycin
treatment (50 n
M). Filled bars, expression
level increased by more than 1.8-fold;
hatched bars, expression level decreased by
more than 1.8-fold. The details of the experi-
ment are given in Table S2. (B) Distribution
of the rapamycin-responding mRNAs cate-
gorized across GO biological processes.
C. Deval et al. Regulation of gene expression by amino acid limitation
FEBS Journal 276 (2009) 707–718 Journal compilation ª 2008 FEBS. No claim to original French government works 713
ments are required to understand the molecular mech-
anisms involved in the down-regulation of gene expres-
sion by amino acid limitation.
Our data demonstrate that, in addition to the
GCN2 pathway, other signaling mechanisms are
involved in the control of gene expression (up and
down) in response to amino acid limitation. The down-
stream molecular mechanisms involved in this process
could require transcriptional regulation and ⁄ or stabil-
ization of mRNA. This latter mechanism has been
described for the amino acid-dependent regulation of
several genes, including Chop, Atf3, Cat-1 and insulin-
like growth factor binding protein 1 (Igfbp1), making
it possible that amino acid availability may affect a
mechanism regulating transcript stability of a larger set
of genes [15,25,26,30,31]. Based on an analysis of the
literature, the regulation of mRNA half-life has mainly
been studied by focusing on the A ⁄ U-rich element
(ARE) instability determinant of certain mRNAs. In
particular, there has been much discussion of a link
between ARE-dependent mRNA degradation and the
inhibition of protein synthesis [31,32]. However, the
universality of such a translation-coupled ARE-medi-
ated decay has been discussed and remains unclear
[33,34]. The most plausible hypothesis to explain
mRNA stability would be that many factors contribute
to these multistep processes, including the metabolic
conditions of the cell, nature of the stimulus, RNA
binding factors and the sequence of the target mRNA
[35].
Another amino acid sensing mechanism involves
mTORC1. Therefore, it is tempting to speculate that
the mTORC1 pathway could be involved in the
GCN2-independent regulation of gene expression. Our
results show that rapamycin, an inhibitor of mTORC1,
regulates the expression of a set of genes almost as
large as the set of genes regulated by amino acid depri-
vation (622 versus 731 genes). However, only 12 genes
are regulated by both rapamycin and amino acid star-
vation, whereas both of these stimuli are known to
inhibit mTORC1. Several hypotheses could explain
these results: (a) rapamycin may regulate gene expres-
sion through an mTORC1-independent mechanism, or
(b) amino acid deprivation may not inhibit mTORC1
activity as much as the inhibition caused by rapamy-
cin, and therefore may not regulate gene expression to
the same extent. We cannot exclude the possibility that
different extents of inhibition of mTORC1 signaling
could account for the induction of distinct sets of
genes.
Recently, Peng et al. [23] have shown that the tran-
scriptional profile induced by rapamycin exhibits some
similarities to that induced by leucine deprivation.
However, rapamycin and amino acid starvation had
opposite effects on the expression of a large group of
genes involved in the synthesis, transport and use of
amino acids. The experimental procedures may explain
the discrepancy between our results and those obtained
by Peng et al. [23]. Indeed, we focused our studies on
short-term amino acid starvation and rapamycin treat-
ment, whereas Peng et al. used longer treatment peri-
ods (12 and 24 h); moreover, the experimental
conditions (cellular model and rapamycin treatment)
were different. Taken together, these results demon-
strate that rapamycin and amino acid deprivation do
not regulate the same pattern of genes, suggesting that
the mTORC1 and GCN2 pathways do not regulate
the same physiological functions. In addition, it is clear
that the cellular context and treatment conditions are
also important factors in the regulation of gene expres-
sion by amino acid starvation and ⁄ or rapamycin [24].
Further investigations are needed to understand the
role of mTORC1 kinase in the regulation of gene
expression by amino acid availability.
The enrichment of amino acid-regulated genes
according to their biological processes reveals that
amino acid limitation regulates groups of genes that
are involved in amino acid and protein metabolism,
lipid and carbohydrate metabolism and various pro-
cesses related to the stress response. These adaptive
responses enable the cell to become accustomed to low
amino acid availability. It is conceivable that, in vivo,
animals modulate their metabolism in order to adapt
to a diet partially or totally devoid of a given essential
amino acid.
Our data suggest that the GCN2 pathway is directly
involved in the regulation of amino acid and protein
metabolism, as many of the genes involved in these
processes are not regulated in GCN2) ⁄ ) cells. These
results are in good agreement with those of Harding
et al. [18], who showed that the transcription factor
ATF4 (downstream of GCN2) regulates the transport
and metabolism of amino acids. Taken together, these
results demonstrate that amino acids can regulate their
own metabolism as a function of their availability.
In this process, GCN2 is the sensor for amino acid
limitation.
A previous study has shown that amino acid starva-
tion can regulate lipid metabolism [6]. Our results rein-
force these data, as they show that amino acid
starvation affects the expression of genes involved in
various biological processes related to lipids and ⁄ or
energetic processes. In addition, data from Cavener’s
group clearly show that GCN2 is involved in the
amino acid regulation of lipid metabolism (mainly
lipogenesis). Our data suggest that amino acid starva-
Regulation of gene expression by amino acid limitation C. Deval et al.
714 FEBS Journal 276 (2009) 707–718 Journal compilation ª 2008 FEBS. No claim to original French government works
tion may also control lipid metabolism through a
GCN2-independent process. Indeed, in GCN2) ⁄ )
cells, a number of genes involved in carbohydrate or
lipid metabolism (particularly in cholesterol bio-
synthetic processes) are regulated by amino acid star-
vation.
Further investigations are necessary to determine the
relevance of the amino acid regulation of the genes
involved in carbohydrate and lipid metabolism. In par-
ticular, the regulatory role of amino acids should be
addressed in tissues and cells involved in metabolic
processes (liver, adipose tissue, muscle), and the
GCN2-independent pathway(s) controlled by amino
acid availability, as well as the regulated metabolic
processes, should be identified.
The idea that amino acids can regulate gene expres-
sion is now well established. However, further work is
needed to understand the molecular steps by which the
cellular concentration of an individual amino acid can
regulate gene expression. The molecular basis of gene
regulation by dietary protein intake is an important
field of research for studying the regulation of the
physiological functions of individuals living under con-
ditions of restricted or excessive food intake.
Materials and methods
Cell cultures and treatment conditions
GCN2+ ⁄ + and GCN2) ⁄ ) MEF cells were kindly pro-
vided by D. Ron (New York University, NY, USA). For
amino acid starvation experiments, cells were starved of
leucine. F12 ⁄ DMEM without amino acids was used. The
medium was supplemented with individual amino acids at
the concentration of the control medium. In all experiments
involving amino acid starvation, dialyzed serum was used.
RNA extraction
Total RNA was prepared using the RNeasy total RNA
Mini kit (Qiagen France, Les Ulis, France). RNA concen-
tration and integrity were assessed using the Agilent 2100
Bioanalyzer (Agilent Technologies, Massy, France). High-
quality RNAs with an A
260
⁄ A
280
ratio above 1.9 and intact
ribosomal 28S and 18S bands were utilized for microarray
experiments and real-time RT-PCR.
Oligo microarray
A mouse oligonucleotide microarray containing 25 000
genes and expressed sequence tags were used to profile the
change in gene expression of different cultured cells starved
of essential amino acids. Microarray chips were obtained
from RNG (Re
´
seau National des Ge
´
nopoles, Every,
France). For rapamycin microarray experiments, mouse Op
Arrays (Operon Biotechnologies GmbH BioCampus
Cologne, Cologne, Germany) were used.
RNA labeling and hybridization
For microarray experiments, 1 lg of total RNA from each
sample was amplified by a MessageAmp RNA Kit (Ambion,
Austin, TX, USA) according to the manufacturer’s instruc-
tions. RNAs from cells cultured in complete medium were
labeled with cyanine-3 (Cy3), and RNAs from cells cul-
tured in starved medium were labeled with Cy5. Three
micrograms of each Cy3- and Cy5-labeled amplified RNA
(aRNA) were fragmented with Agilent aRNA fragmenta-
tion buffer and made up in Agilent hybridization buffer.
Labeled aRNAs were then hybridized to a mouse pan-
genomic microarray at 60 °C for 17 h. Microarrays were
washed and then scanned with an Affymetrix 428 scanner
(Affymetrix, Santa Clara, CA, USA) at a resolution of
10 lm using appropriate gains on the photomultiplier to
obtain the highest signal without saturation.
Microarray analysis
The signal and background intensity values for the Cy3 and
Cy5 channels from each spot were obtained using
imagene 6.0 (Biodiscovery, El Segundo, CA, USA). Data
were filtered using Imagene ‘empty spots’ to remove from the
analysis genes that were too weakly expressed. After base-2
logarithmic transformation, data were corrected for system-
atic dye bias by Lowess normalization using genesight 4.1
software (Biodiscovery) and controlled by M–A plot repre-
sentation. Statistical analyses were performed using free
r 2.1 software. The log ratios between the two conditions
(with two independent experiments conducted for each cell
line) were analyzed using a standard Student’s t-test to detect
differentially expressed genes. P values were adjusted using
the Bonferroni correction for multiple testing to eliminate
false positives. Differences were considered to be significant
at adjusted P < 0.01 and a cut-off ratio of > 1.8 or < 0.55
to identify genes differentially expressed by amino acid star-
vation. All the genes given in the figures and Supporting
Information (using GCN2+ ⁄ + cells) were regulated with a
fold change of greater than (±)1.8 in all independent experi-
ments. The genes that were found to be regulated in only one
experiment were not taken into account. This occurred
mainly for genes either having an induction ratio close to 1.8
or expressed at a low basal level.
These genes were then classified according to their bio-
logical process ontology determined from the QuickGO
gene ontology browser [QuickGO GO Browser (online
database), European Bioinformatics Institute, available
from: />C. Deval et al. Regulation of gene expression by amino acid limitation
FEBS Journal 276 (2009) 707–718 Journal compilation ª 2008 FEBS. No claim to original French government works 715
Enrichment rate calculation
To calculate the enrichment rate and to determine the func-
tional interpretation of the data, we analysed the regulated
genes with fatigo s oftwar e fr om t he B abelom ics suite web tool
() [36]. fatigo software calcu lates
the distribution of GO terms for biological processes between
the regulated genes obtained from microarray experiments and
the RNG microarray gene l ists. The enrichment is computed as
the percentage of changed genes divided by the percentage of
total g enes in the chip in o ne G O term.
Analysis of gene expression using quantitative
RT-PCR
Real-time quantitative PCR was performed as described
previously [37]. Each analysis was normalized with b-actin.
The primers used for quantitative RT-PCR were as listed
in Table 3.
Table 3. Primers used for quantitative RT-PCR.
Primer (5¢-to3¢)
Ddit3 (Chop) forward, CCTAGCTTGGCTGACAGAGG;
reverse, CTGCTCCTTCTCCTTCATGC
Asns forward, TACAACCACAAGGCGCTACA;
reverse, AAGGGCCTGACTCCATAGGT
Trb3 forward, CAGGAAGAACCGTTGGAGTT;
reverse, TTGCTCTCGTTCCAAAAGGA
Actb forward, AAGGAAGGCTGGAAAAGAGC
reverse, TACAGCTTCACCACCACAGC
Hmgcs1 forward, TTTGATGCAGGTGTTTGAGG
reverse, CCACCTGTAGGTCTGGCA
Sqstm1 forward, CCTTGCCCTACAGCTGAGTC
reverse, CTTGTCTTCTGTGCCTGTGC
Ifrd1 forward, GTTTGAATTGGCCAGAGGAA
reverse, TCTGTTGGAAAATCCCGTTC
Cxcl10 forward, CCCACGTGTTGAGATCATTG
reverse, GAGGAACAGCAGAGAGCCTC
Cxcl10
pre-mRNA
forward, AGCAGAGGAAAATGCACCAG
reverse, CACCTGGGTAAAGGGGAGTGA
Dusp16 forward, GCTCCGCCACTATTGCTATT
reverse, AGGTGCAGCAGCTTCAGTTT
Dusp16
pre-mRNA
forward, CAGTGCTGGAATTGTACGTGA
reverse, AGTCCATGAGTTGGCCCATA
Egr1 forward, CCTATGAGCACCTGACCACA
reverse, AGGCCACTGACTAGGCTGAA
Egr1
pre-mRNA
forward, GAGCAGGTCCAGGAACATTG
reverse, GGGATAACTCGTCTCCACCA
Ndrg1 forward, ACCTGCTACAACCCCCTCTT
reverse, TGCCAATGACACTCTTGAGC
Idi1 forward, GGGCTGACCAAGAAAAAC
reverse, TCGCCTGGGTTACTTAATGG
Acknowledgements
We thank Dr D. Ron (New York University, NY,
USA), for providing us with GCN2)/) cells.
References
1 Jackson AA & Grimble MS (1990) The Malnourished
Child. Raven Press, Vevey.
2 Baertl JM, Placko RP & Graham GG (1974) Serum
proteins and plasma free amino acids in severe malnu-
trition. Am J Clin Nutr 27, 733–742.
3 Gietzen DW (1993) Neural mechanisms in the responses
to amino acid deficiency. J Nutr 123, 610–625.
4 Maurin AC, Jousse C, Averous J, Parry L, Bruhat A,
Cherasse Y, Zeng H, Zhang Y, Harding HP, Ron D
et al. (2005) The GCN2 kinase biases feeding behavior
to maintain amino acid homeostasis in omnivores.
Cell Metab 1, 273–277.
5 Hao S, Sharp JW, Ross-Inta CM, McDaniel BJ,
Anthony TG, Wek RC, Cavener DR, McGrath BC,
Rudell JB, Koehnle TJ et al. (2005) Uncharged tRNA
and sensing of amino acid deficiency in mammalian
piriform cortex. Science 307, 1776–1778.
6 Guo F & Cavener DR (2007) The GCN2 eIF2alpha
kinase regulates fatty-acid homeostasis in the liver dur-
ing deprivation of an essential amino acid. Cell Metab
5, 103–114.
7 Kilberg MS, Pan YX, Chen H & Leung-Pineda V
(2005) Nutritional control of gene expression: how
mammalian cells respond to amino acid limitation.
Annu Rev Nutr 25, 59–85.
8 Struhl K (1987) Promoters, activator proteins, and the
mechanism of transcriptional initiation in yeast. Cell 49,
295–297.
9 Forsberg H & Ljungdahl PO (2001) Sensors of extracel-
lular nutrients in Saccharomyces cerevisiae. Curr Genet
40, 91–109.
10 Iraqui I, Vissers S, Andre B & Urrestarazu A (1999)
Transcriptional induction by aromatic amino acids in
Saccharomyces cerevisiae. Mol Cell Biol 19, 3360–3371.
11 Hinnebusch AG (1988) Mechanisms of gene regulation
in the general control of amino acid biosynthesis in Sac-
charomyces cerevisiae. Microbiol Rev 52, 248–273.
12 Fernandez J, Yaman II, Mishra R, Merrick WC, Snider
MD, Lamers WH & Hatzoglou M (2000) IRES-medi-
ated translation of a mammalian mRNA is regulated by
amino acid availability. J Biol Chem 12, 12.
13 Yaman I, Fernandez J, Liu H, Caprara M, Komar AA,
Koromilas AE, Zhou L, Snider MD, Scheuner D,
Kaufman RJ et al. (2003) The zipper model of transla-
tional control: a small upstream ORF is the switch
that controls structural remodeling of an mRNA leader.
Cell 113, 519–531.
14 Barbosa-Tessmann IP, Chen C, Zhong C, Siu F, Schus-
ter SM, Nick HS & Kilberg MS (2000) Activation of
the human asparagine synthetase gene by the amino
acid response and the endoplasmic reticulum stress
response pathways occurs by common genomic
elements. J Biol Chem 275, 26976–26985.
Regulation of gene expression by amino acid limitation C. Deval et al.
716 FEBS Journal 276 (2009) 707–718 Journal compilation ª 2008 FEBS. No claim to original French government works
15 Bruhat A, Jousse C, Wang XZ, Ron D, Ferrara M &
Fafournoux P (1997) Amino acid limitation induces
expression of CHOP, a CCAAT ⁄ enhancer binding pro-
tein-related gene, at both transcriptional and post-tran-
scriptional levels. J Biol Chem 272, 17588–17593.
16 Jousse C, Averous J, Bruhat A, Carraro V, Mordier S
& Fafournoux P (2004) Amino acids as regulators of
gene expression: molecular mechanisms. Biochem Bio-
phys Res Commun 313, 447–452.
17 Bruhat A, Jousse C, Carraro V, Reimold AM, Ferrara
M & Fafournoux P (2000) Amino acids control mam-
malian gene transcription: activating transcription fac-
tor 2 is essential for the amino acid responsiveness of
the CHOP promoter. Mol Cell Biol 20, 7192–7204.
18 Harding HP, Zhang Y, Zeng H, Novoa I, Lu PD, Cal-
fon M, Sadri N, Yun C, Popko B, Paules R et al.
(2003) An integrated stress response regulates amino
acid metabolism and resistance to oxidative stress. Mol
Cell 11, 619–633.
19 Lu PD, Harding HP & Ron D (2004) Translation reini-
tiation at alternative open reading frames regulates gene
expression in an integrated stress response. J Cell Biol
167, 27–33.
20 Vattem KM & Wek RC (2004) Reinitiation involving
upstream ORFs regulates ATF4 mRNA translation in
mammalian cells. Proc Natl Acad Sci USA 101, 11269–
11274.
21 Averous J, Bruhat A, Jousse C, Carraro V, Thiel G &
Fafournoux P (2004) Induction of CHOP expression by
amino acid limitation requires both ATF4 expression
and ATF2 phosphorylation. J Biol Chem 279, 5288–
5297.
22 Siu F, Bain PJ, LeBlanc-Chaffin R, Chen H & Kilberg
MS (2002) ATF4 is a mediator of the nutrient-sensing
response pathway that activates the human asparagine
synthetase gene. J Biol Chem 277, 24120–24127.
23 Peng T, Golub TR & Sabatini DM (2002) The immu-
nosuppressant rapamycin mimics a starvation-like signal
distinct from amino acid and glucose deprivation. Mol
Cell Biol 22, 5575–5584.
24 Deval C, Talvas J, Chaveroux C, Maurin AC, Mordier
S, Cherasse Y, Parry L, Carraro V, Jousse C, Bruhat A
et al. (2008) Amino-acid limitation induces the GCN2
signaling pathway in myoblasts but not in myotubes.
Biochimie 90, 1716–1721.
25 Pan YX, Chen H & Kilberg MS (2005) Interaction of
RNA-binding proteins HuR and AUF1 with the human
ATF3 mRNA 3¢-untranslated region regulates its amino
acid limitation-induced stabilization. J Biol Chem 280,
34609–34616.
26 Yaman I, Fernandez J, Sarkar B, Schneider RJ, Snider
MD, Nagy LE & Hatzoglou M (2002) Nutritional con-
trol of mRNA stability is mediated by a conserved AU-
rich element that binds the cytoplasmic shuttling protein
HuR. J Biol Chem 277, 41539–41546.
27 Chen H, Pan YX, Dudenhausen EE & Kilberg MS
(2004) Amino acid deprivation induces the transcription
rate of the human asparagine synthetase gene through a
timed program of expression and promoter binding of
nutrient-responsive bZIP transcription factors as well as
localized histone acetylation. J Biol Chem 279, 50829–
50839.
28 Lipson KE & Baserga R (1989) Transcriptional activity
of the human thymidine kinase gene determined by a
method using the polymerase chain reaction and an
intron-specific probe. Proc Natl Acad Sci USA 86,
9774–9777.
29 Karpinski BA, Morle GD, Huggenvik J, Uhler MD &
Leiden JM (1992) Molecular cloning of human CREB-
2: an ATF ⁄ CREB transcription factor that can nega-
tively regulate transcription from the cAMP response
element. Proc Natl Acad Sci USA 89, 4820–4824.
30 Jousse C, Bruhat A, Ferrara M & Fafournoux P (1998)
Physiological concentration of amino acids regulates
insulin-like-growth-factor-binding protein 1 expression.
Biochem J 334, 147–153.
31 Averous J, Maurin AC, Bruhat A, Jousse C, Arliguie C
& Fafournoux P (2005) Induction of IGFBP-1 expres-
sion by amino acid deprivation of HepG2 human hepa-
toma cells involves both a transcriptional activation and
an mRNA stabilization due to its 3¢UTR. FEBS Lett
579, 2609–2614.
32 Jousse C, Bruhat A, Ferrara M & Fafournoux P (2000)
Evidence for multiple signaling pathways in the regula-
tion of gene expression by amino acids in human cell
lines. J Nutr 130, 1555–1560.
33 Aharon T & Schneider RJ (1993) Selective destabiliza-
tion of short-lived mRNAs with the granulocyte–macro-
phage colony-stimulating factor AU-rich 3¢ noncoding
region is mediated by a cotranslational mechanism. Mol
Cell Biol 13, 1971–1980.
34 Koeller DM, Horowitz JA, Casey JL, Klausner RD &
Harford JB (1991) Translation and the stability of
mRNAs encoding the transferrin receptor and c-fos.
Proc Natl Acad Sci USA 88, 7778–7782.
35 Kawai T, Fan J, Mazan-Mamczarz K & Gorospe M
(2004) Global mRNA stabilization preferentially linked
to translational repression during the endoplasmic retic-
ulum stress response. Mol Cell Biol 24, 6773–6787.
36 Al-Shahrour F, Minguez P, Vaquerizas JM, Conde L &
Dopazo J (2005) BABELOMICS: a suite of web tools
for functional annotation and analysis of groups of
genes in high-throughput experiments. Nucleic Acids
Res 33, W460–W464.
37 Jousse C, Deval C, Maurin AC, Parry L, Cherasse Y,
Chaveroux C, Lefloch R, Lenormand P, Bruhat A &
Fafournoux P (2007) TRB3 inhibits the transcriptional
activation of stress-regulated genes by a negative
feedback on the ATF4 pathway. J Biol Chem 282,
15851–15861.
C. Deval et al. Regulation of gene expression by amino acid limitation
FEBS Journal 276 (2009) 707–718 Journal compilation ª 2008 FEBS. No claim to original French government works 717
Supporting information
The following supplementary material is available:
Table S1. Regulation of gene expression on amino acid
starvation in GCN2+ ⁄ + and GCN2) ⁄ ) MEF cells.
Table S2. Regulation of gene expression on rapamycin
treatment in MEF cells.
Table S3. Genes regulated by both amino acid starva-
tion and rapamycin treatment.
This supplementary material can be found in the
online version of this article.
Please note: Wiley-Blackwell is not responsible for
the content or functionality of any supplementary
materials supplied by the authors. Any queries (other
than missing material) should be directed to the corre-
sponding author for the article.
Regulation of gene expression by amino acid limitation C. Deval et al.
718 FEBS Journal 276 (2009) 707–718 Journal compilation ª 2008 FEBS. No claim to original French government works