Báo cáo khoa học: Studies on the role of the receptor protein motifs possibly involved in electrostatic interactions on the dopamine D1 and D2 receptor oligomerization pdf
Bạn đang xem bản rút gọn của tài liệu. Xem và tải ngay bản đầy đủ của tài liệu tại đây (529.9 KB, 16 trang )
Studies on the role of the receptor protein motifs
possibly involved in electrostatic interactions on the
dopamine D
1
and D
2
receptor oligomerization
Sylwia Łukasiewicz
1
, Agata Faron-Go
´
recka
2
, Jerzy Dobrucki
3
, Agnieszka Polit
1
and Marta Dziedzicka-Wasylewska
1,2
1 Department of Physical Biochemistry, Jagiellonian University, Krako
´
w, Poland
2 Laboratory of Biochemical Pharmacology, Polish Academy of Sciences, Krako
´
w, Poland
3 Division of Cell Biophysics, Jagiellonian University, Krako
´
w, Poland
Various molecular techniques based on biophysical, bio-
chemical and pharmacological approaches have dem-
onstrated that G protein-coupled receptors (GPCRs),
also known as heptahelical receptors, can exist and be
physiologically active as dimers in the plasma mem-
brane [1,2]. These molecules can both homo- and
heterodimerize. The phenomenon of receptor dimeriza-
tion is important in different aspects of receptor biogen-
esis and function, such as receptor maturation, folding,
plasma membrane expression [3–8], signal transduction
speed and specificity [1,5,9–12], and receptor desensiti-
zation [5,13–16]. Interactions between different classes
Keywords
Arg-rich motif; dopamine D
1
receptor;
dopamine D
2
receptor; FRET; GPCR
oligomerization
Correspondence
M. Dziedzicka-Wasylewska, Faculty of
Biochemistry, Biophysics and
Biotechnology, Jagiellonian University
7 Gronostajowa Street, Krakow, Poland
Fax: +48 012 664 6902 or
+48 012 637 4500
Tel: +48 012 664 6122 or
+48 012 662 3372
E-mail: or
(Received 1 August 2008, revised 19
November 2008, accepted 27 November
2008)
doi:10.1111/j.1742-4658.2008.06822.x
We investigated the influence of an epitope from the third intracellular
loop (ic3) of the dopamine D
2
receptor, which contains adjacent arginine
residues (217RRRRKR222), and an acidic epitope from the C-terminus of
the dopamine D
1
receptor (404EE405) on the receptors’ localization and
their interaction. We studied receptor dimer formation using fluorescence
resonance energy transfer. Receptor proteins were tagged with fluorescence
proteins and expressed in HEK293 cells. The degree of D
1
–D
2
receptor
heterodimerization strongly depended on the number of Arg residues
replaced by Ala in the ic3 of D
2
R, which may suggest that the indicated
region of ic3 in D
2
R might be involved in interactions between two dopa-
mine receptors. In addition, the subcellular localization of these receptors
in cells expressing both receptors D
1
–cyan fluorescent protein, D
2
–yellow
fluorescent protein, and various mutants was examined by confocal micros-
copy. Genetic manipulations of the Arg-rich epitope induced alterations in
the localization of the resulting receptor proteins, leading to the conclusion
that this epitope is responsible for the cellular localization of the receptor.
The lack of energy transfer between the genetic variants of yellow fluores-
cent protein-tagged D
2
R and cyan fluorescent protein-tagged D
1
R may
result from differing localization of these proteins in the cell rather than
from the possible role of the D
2
R basic domain in the mechanism of
D
1
–D
2
receptor heterodimerization. However, we find that the acidic
epitope from the C-terminus of the dopamine D
1
receptor is engaged in the
heterodimerization process.
Abbreviations
CFP, cyan fluorescent protein; FRET, fluorescence resonance energy transfer; GBR, GABA
B
receptor; GPCRs, G protein-coupled receptors;
ic3, third intracellular loop; M3R, m3 muscarinic receptor; TCSPC, time-correlated single photon counting measurements; TM,
transmembrane domains of a receptor; YFP, yellow fluorescent protein.
760 FEBS Journal 276 (2009) 760–775 ª 2008 The Authors Journal compilation ª 2008 FEBS
of GPCRs point to a new level of molecular cross-talk
among signaling molecules [1,5,11,17].
Structural information about receptor dimer forma-
tion is currently limited, and the question of whether
receptors dimerize in a similar way or have their own
paths of dimerization remains open. In general, either
covalent or noncovalent interactions are involved in
this process; however, the latter seem to be more effec-
tive [18–21]. Either the transmembrane domains (TMs)
[22–31] of GPCRs or the N- [32–34] or C-tail [35,36]
could play a role in dimer formation. It has been
shown that cysteine residues located in the extracellu-
lar loops are essential for disulfide-linked m3 musca-
rinic receptor (M3R) dimer formation; however this
kind of interaction is not the only point of contact
[37]. For GABA
B
receptors (GBR), a coiled-coil inter-
action within the C-tail of GBR1 and GBR2 seems to
be involved in receptor heterodimerization. However,
this motif is not necessary, as deleting the C-tail does
not abolish dimerization. Also, hydrophobic interac-
tions within the TM of GPCRs are essential for forma-
tion and stabilization of the dimers and have been
detected for beta-adrenergic, dopamine, muscarinic
and angiotensin receptors [38–40].
In earlier studies, the role of certain amino acid resi-
dues in the formation of noncovalent complexes
between protein molecules was highlighted. Electro-
static interactions occur between an epitope containing
mainly two or more adjacent arginine residues on one
protein fragment and an acidic epitope containing two
or more adjacent glutamate or aspartate residues,
and ⁄ or a phosphorylated residue, on the other protein
[41,42]. Ciruela et al. demonstrated that electrostatic
interactions between an arginine-rich epitope from the
third intracellular loop of the D
2
receptor and two
adjacent aspartate residues or a phosphorylated serine
residue in the C-terminus of the A
2A
receptor are
involved in heterodimerization between the adeno-
sine A
2A
receptor and the dopamine D
2
receptor [43].
A similar interaction has also been shown for
D
1
–NMDA receptor heterodimers [44].
Although the dopamine D
1
and D
2
receptor sub-
classes are biochemically distinct, coactivation of both
receptors has been shown to be essential for their physi-
ological function. The view that these receptors may
also function as a physically linked unit is especially
important because recent data suggest that the D
1
and
D
2
receptors are co-expressed by a moderate to sub-
stantial proportion of striatal neurons [45,46]. Lee et al.
provided anatomical evidence suggesting significant col-
ocalization of D
1
and D
2
receptors in the caudate and
pyramidal cells in the rat frontal cortex [47]. Earlier
studies by Vincent et al. have also shown that the lami-
nar distribution of medial prefrontal cortex neurons
expressing both D
1
and D
2
receptors was similar to
that of the mesocortical dopamine afferents [48].
The dopamine D
2
receptor can form homodimers
[19]. Recently, we have shown that the D
2
receptor
also forms heterodimers with the dopamine D
1
recep-
tor [49]; however, the precise role of specific regions of
receptor molecule(s) in that process has not yet been
elucidated. In this study, we investigated the role of an
epitope from the third intracellular loop (ic3) of the
dopamine D
2
receptor, which contains adjacent argi-
nine residues (217RRRRKR222), and an acidic epi-
tope from the C-terminus of dopamine D
1
receptor
(404EE405) on the D
1
–D
2
receptor interaction.
Fluorescence resonance energy transfer (FRET)
occurs between fluorescence donor and acceptor chro-
mophores when they are located within 100 A
˚
of each
other and are arranged properly in terms of their tran-
sition dipole moments [50]. Using this technique, we
studied receptor dimer formation using fluorescence
lifetime microscopy and time-correlated single photon
counting (TCSPC) measurements. The receptor pro-
teins were tagged with cyan (CFP; fluorescence donor)
and yellow fluorescent proteins (YFP; fluorescence
acceptor) and expressed in HEK293 cells. We find
FRET to be a very sensitive tool, and measurements
are especially useful to quantitatively monitor the
physical interactions between receptor proteins [51,52].
Results
Radioligand binding assay
As shown in Table 1, the binding parameters obtained
for dopamine D
1
receptor and its mutant indicate that
the K
d
values for these two receptors were similar;
however, the density of the D
1
MUT (404AA405) was
Table 1. Binding parameters for the dopamine receptors. For dopa-
mine D
2
receptor binding, the statistical significance was evaluated
using a one-way ANOVA, followed by a Dunnett’s test for post hoc
comparison. *P < 0.05. For dopamine D
1
receptor binding, the
statistical significance was evaluated using a Student’s t-test;
***P < 0.001.
Species
B
max
± SEM
(pmolÆmg
)1
protein)
K
d
± SEM
(n
M)
D
1
–CFP 14.66 ± 0.13 1.50 ± 0.08
D
1
MUT–CFP 9.85 ± 0.08*** 1.20 ± 0.06
D
2
–YFP 4.88 ± 0.10 0.41 ± 0.06
D
2
R1–YFP 2.53 ± 0.08* 0.44 ± 0.03
D
2
R2–YFP 0.70 ± 0.07* 0.44 ± 0.09
S. Łukasiewicz et al. Dopamine D
1
and D
2
receptors dimerization
FEBS Journal 276 (2009) 760–775 ª 2008 The Authors Journal compilation ª 2008 FEBS 761
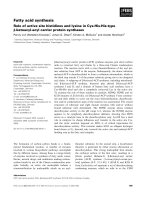
lower than that of wild-type D
1
R (Fig. 1A). Also, all
three genetic variants of dopamine D
2
R displayed sim-
ilar K
d
values, but the density of these receptors
strongly depended on the number of Arg residues still
present within the receptor sequence. The D
2
R1
(217AARRKR222) mutant displayed half of the B
max
value obtained for D
2
R, whereas the density of the
D
2
R2 (217AAAAKR222) mutant was much lower
(Fig. 1B). For the D
2
R3 (217AAAAAA222) variant,
no binding parameters could be obtained, which indi-
cates that there was no receptor protein in the cellular
membrane. This conclusion is further justified by
confocal microscopy analysis of receptor localization.
Analysis of the localization of dopamine D
1
,D
2
and their genetic variant fusion proteins
Confocal microscopy was used to visualize HEK293
cells co-expressing the dopamine D
1
and D
2
receptors,
as well as their genetic variants (D
1
MUT, D
2
R1,
D
2
R2, D
2
R3). These experiments were performed to
determine the influence of the introduced mutations on
the localization of the receptor proteins and the degree
of their colocalization.
Figure 2A,B shows HEK293 cells transiently
cotransfected with plasmids encoding the dopa-
mine D
1
, dopamine D
2
,D
1
MUT, D
2
R1, D
2
R2 and
D
2
R3 receptors in different combinations. Merged pic-
tures with apparent yellow signal indicating overlap of
green fluorescent signal (CFP channel) and red fluores-
cent signal (YFP channel) show colocalization.
As seen from the figures, these receptor proteins
were localized differentially in the cell. Cell edge sharp-
ness confirms that dopamine D
1
and D
1
MUT recep-
tors localize in the plasma membrane, in contrast to
the dopamine D
2
receptor and its genetic variants,
D
2
R1, D
2
R2, which were localized in the plasma mem-
brane and inside the cell. In the case of the dopa-
mine D
2
receptor mutants, the degree of membrane
localization depended on the number of mutated resi-
dues in the ic3 region (D
2
217–222).
The dopamine D
2
R3 receptor location was very
interesting and surprising. As seen in Fig. 2A, which
shows a cell co-expressing both D
1
–CFP and D
2
R3–
YFP fusion proteins, these receptors were found in dif-
ferent parts of the cell. The D
2
R3 mutant was localized
inside the cell, whereas the D
1
receptor was found in
the plasma membrane. However, when the cell
co-expressed both types of D
2
receptors, i.e. the wild-
type and the D
2
R1, D
2
R2 as well as D
2
R3 variant, colo-
calization was observed in both the plasma membrane
and inside the cell. For a quantitative estimation of the
degree of colocalization between the two different pro-
teins of interest, Pearson’s correlation coefficients and
coefficients of determination were estimated (Fig. 2C).
In case of cells co-expressing dopamine D
1
and dopa-
mine D
2
receptor mutants, the degree of colocalization
decreased, which was correlated with number of
exchanged residues within the ic3 of D
2
receptor.
When cells were cotransfected with the same type of
receptors (D
1
MUT–CFP ⁄ D
1
–YFP, D
2
–CFP ⁄ D
2
R1–
YFP, D
2
–CFP ⁄ D
2
R2–YFP, D
2
–CFP ⁄ D
2
R3–YFP) and
with dopamine D
2
and genetic variant dopamine D
1
receptors (D
1
MUT–CFP ⁄ D
2
–YFP) the obtained values
of coefficients remained approximated.
Fluorescence spectroscopy measurements of
dopamine receptor dimerization
Although steady-state fluorescence spectroscopy mea-
surements in cell suspension enable only the qualitative
estimation of the FRET phenomenon, this approach is
Fig. 1. Saturation binding of [
3
H]SCH23390 (A) and [
3
H]-spiperone
(B) to human D
1
and D
2
dopamine receptors, respectively. Data are
from a single experiment performed in triplicate and are representa-
tive of at least three independent experiments. Elimination of the
Arg-rich or di-Glu motif in D
2
RorD
1
R, respectively, does not alter
the ligand binding constant.
Dopamine D
1
and D
2
receptors dimerization S. Łukasiewicz et al.
762 FEBS Journal 276 (2009) 760–775 ª 2008 The Authors Journal compilation ª 2008 FEBS
very demonstrative and gives a quick answer to
whether there is any energy transfer in the examined
sample. Therefore, we used this type of measurement
to investigate interactions between the dopamine D
1
and D
2
receptors and their genetic variants. Fluores-
cence emission profiles for the HEK293 cell suspension
expressing fusion proteins in different combinations
(D
1
–CFP ⁄ D
2
–YFP, D
1
–CFP ⁄ D
2
R1–YFP, D
1
–CFP ⁄
D
2
R2–YFP, D
1
CFP ⁄ D
2
R3–YFP, D
1
MUT–CFP ⁄
D
2
–YFP, D
1
–CFP ⁄ D
1
–YFP, D
1
MUT–CFP ⁄ D
1
–YFP,
D
2
–CFP ⁄ D
2
–YFP and D
2
–CFP ⁄ D
2
R3–YFP) were
compared using an excitation wavelength of 434 nm
(donor absorption).
The upper panel of Fig. 3 shows emission spectra of
HEK293 cell populations after cotransfection with
plasmids encoding genes for dopamine D
1
and D
2
receptor fusion proteins (D
1
–CFP and D
2
–YFP) in
comparison with emission spectra of the cell popula-
tions that co-express dopamine D
1
receptor fusion
protein (D
1
–CFP) and one of the genetic variants of
dopamine D
2
receptor fusion protein (D
2
R1, D
2
R2
or D
2
R3–YFP) (Fig. 3A). In Fig. 3B, the results
presented are from a cell suspension expressing the
dopamine D
2
–YFP fusion protein and the genetic vari-
ant of the dopamine D
1
receptor (D
1
MUT–CFP)
fusion protein. We observed energy transfer between
wild-type dopamine D
1
and D
2
receptors, but when
either the genetic variant of dopamine D
1
(D
1
MUT)
or the D
2
R3 genetic variant of the dopamine D
2
recep-
tor was present in the sample, there was no visible
energy transfer, despite the presence of both fluoro-
phores in the sample.
Figure 3C,D shows the emission profiles of cells
cotransfected with plasmids encoding genes for the
same type of dopamine receptor (D
1
or D
2
, respec-
tively), tagged with different fluorescence proteins,
A
B
C
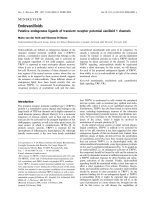
Fig. 2. Expression of D
1
R and D
2
R and their mutants in HEK293 cells. (A) HEK293 cells were cotransfected with either D
1
–CFP or D
1
MUT–
CFP and either D
2
–YFP, D
2
R1–YFP, D
2
R2–YFP, D
2
R3–YFP or D
1
MUT–YFP (green and red). Image overlays show extensive colocalization in
D
1
⁄ D
1
,D
1
⁄ D
1
MUT, D
1
⁄ D
2
and D
1
⁄ D
2
R1 assays and partial colocalization in D
1
⁄ D
2
R2 assays. D
1
⁄ D
2
R3 does not colocalize. (B) HEK293 cells
were cotransfected with D
2
–CFP and either D
2
–YFP, D
2
R1–YFP, D
2
R2–YFP or D
2
R3–YFP. Image overlays show extensive colocalization in
every case. (C) Bar graph of Pearson‘s correlation coefficient calculated for HEK293 cells cotransfected with different dopamine D
1
and D
2
receptor protein construct combination. Data are mean ± SE, and statistical significance was evaluated using Student’s t-test and Mann–
Whitney test. ***P < 0.001 for combinations D
1
with all variants of D
2
versus D
1
⁄ D
2
. Either D
2
⁄ D
2
R1, D
2
⁄ D
2
R2 or D
2
⁄ D
2
R3 versus D
2
⁄ D
2
,
D
1
MUT ⁄ D
1
versus D
1
⁄ D
1
, and D
1
MUT ⁄ D
2
versus D
1
⁄ D
2
combinations are not statistically significant. Values of corresponding coefficients
of determination (r
2
) are reported in brackets.
S. Łukasiewicz et al. Dopamine D
1
and D
2
receptors dimerization
FEBS Journal 276 (2009) 760–775 ª 2008 The Authors Journal compilation ª 2008 FEBS 763
compared with emission profiles of cells in which one
of the tagged receptors was its own mutant (D
1
–CFP ⁄
D
1
–YFP and D
1
MUT–CFP ⁄ D
1
–YFP or D
2
–CFP ⁄
D
2
–YFP and D
2
–CFP ⁄ D
2
R3–YFP). The lower panel
of Fig. 3 shows that both dopamine receptors, D
1
and
D
2
, form homo-oligomeric structures and confirms
that both of the investigated epitopes are probably not
engaged in the homodimerization process. In both
cases, we observed efficient energy transfer, which can
be judged by the localization of the appropriate peaks
of the spectra.
To serve as a control for this experiment, we
co-expressed the a subunits of the G protein, a
i
and a
s
tagged with CFP with dopamine D
1
or D
2
receptors,
which were tagged with YFP. As seen in Fig. 4, the
FRET phenomenon takes place only when the D
1
receptor is co-expressed with a
s
or D
2
receptor is
co-expressed with a
i
. The interactions are specific
because no energy transfer was observed following
co-transfection of D
1
–YFP ⁄ a
i
–CFP or D
2
YFP ⁄ a
s
CFP,
despite the identical overexpression level of the
proteins in all studied combinations.
Fluorescence lifetime microscopy studies of
dopamine receptor dimerization
Time-correlated single-photon counting experiments
were performed on the inverted fluorescence micro-
scope. The FRET phenomenon was observed in a
single living cell transiently transfected with the
dopamine D
1
and D
2
receptors and their genetic
variants, tagged with fluorescent proteins. This kind of
measurement provides highly quantifiable data because
it is independent of any change in fluorophore concen-
tration or excitation intensity.
To determine FRET efficiency, precise measurement
of the donor fluorescence lifetime (CFP), in the pres-
ence and absence of the acceptor (YFP), is required.
A
C
B
D
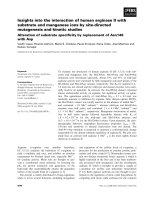
Fig. 3. Fluorescence emission spectra of HEK293 cells expressing the CFP- and YFP-tagged proteins coupled to D
1
R and D
2
R and their
mutants. (A) Cotransfection of HEK293 with D
1
–CFP and either D
2
–YFP (gray dashed line), D
2
R1–YFP (black line), or D
2
R2–YFP (gray line) or
D
2
R3–YFP (black dashed line). (B) Cotransfection of HEK293 with D
1
MUT–CFP and D
2
–YFP (gray line) in comparison with D
1
–CFP and
D
2
–YFP (black line). (C) Cotransfection of HEK293 with D
1
MUT–CFP and D
1
–YFP (gray line) in comparison with D
1
–CFP and D
1
–YFP (black
line). (D) Cotransfection of HEK293 with D
2
–CFP and D
2
R3–YFP (gray line) in comparison with D
2
–CFP and D
2
–YFP (black line). CFP was
excited at 434 nm, and fluorescence was detected at 450–550 nm through a double monochromator. The spectral contributions arising from
light scattering and nonspecific fluorescence of cells and buffer were eliminated.
Dopamine D
1
and D
2
receptors dimerization S. Łukasiewicz et al.
764 FEBS Journal 276 (2009) 760–775 ª 2008 The Authors Journal compilation ª 2008 FEBS
Fluorescence decays were analyzed as both mono- and
multi-exponentials. Analysis of the reduced chi-squared
value and residual distribution led to the conclusion
that best fit parameters were obtained with two expo-
nentials. Adding a third exponential did not signifi-
cantly influence the parameters, and the fractional
contribution of the additional lifetime was close to
zero. Figure 5 shows the typical time-dependent donor
decays for the D
1
–CFP bearing donor alone and with
the donor and acceptor D
1
–CFP ⁄ D
1
MUT–YFP.
The average CFP fluorescence lifetime obtained
during TCSPC experiments was 2.37 ns, and the value
changed when acceptor was present in a cell. The
greatest average fluorescence lifetime decrease (to
1.52 ns), which was regarded as the highest FRET effi-
ciency ($ 36%), was detected in our earlier studies for
the CFP–YFP hybrid (CFP connected by a short 15
amino acid linker with YFP) [49].
Measurements on the cells co-expressing dopa-
mine D
1
and D
2
receptor fusion proteins indicated
$ 4% efficiency of energy transfer, with an average
donor fluorescence lifetime of 2.27 ns. This changed
when the dopamine D
2
receptor was replaced by a
genetic variant (D
2
R1, D
2
R2 or D
2
R3) and also when
D
1
MUT was used instead of the dopamine D
1
recep-
tor. Transfer efficiency was equal to 2.1% (2.32 ns) for
A
B
C
D
Fig. 4. Representative fluorescence emission spectra of HEK293 cells cotransfected with either D
1
–YFP or D
2
–YFP and Ga–CFP fusion pro-
teins. (A) Negative FRET control, spectra from a 1 : 1 mixture of cells individually expressing the Ga
S
–CFP (black line) fusion protein (excited
at 434 nm) and the D
1
–YFP (gray line) fusion protein (excited at 475 nm). (B) Cotransfection of HEK293 cells with D
1
–YFP and Ga
S
–CFP
(gray line) or D
1
–YFP and Ga
I
–CFP (black line), excited at 434 nm. (C) Negative FRET control, spectra from a 1 : 1 mixture of cells individually
expressing Ga
I
–CFP (black line) fusion protein (excited at 434 nm) and D
2
–YFP (gray line) fusion protein (excited at 475 nm). (D) Cotransfec-
tion of HEK293 cells with D
2
–YFP and Ga
I
–CFP (gray line) or D
2
–YFP and Ga
S
–CFP (black line), excited at 434 nm. Fluorescence was
detected at 450–550 nm through a double monochromator. The spectral contributions arising from light scattering and nonspecific fluores-
cence of cells and buffer were eliminated.
S. Łukasiewicz et al. Dopamine D
1
and D
2
receptors dimerization
FEBS Journal 276 (2009) 760–775 ª 2008 The Authors Journal compilation ª 2008 FEBS 765
D
1
⁄ D
2
R1, further decreased to 1.26% (2.34 ns) for
D
1
⁄ D
2
R2, and finally reached the value of 0.44%
(2.36 ns) for D
1
⁄ D
2
R3.
The lowest E value, similar to that obtained for the
D
1
⁄ D
2
R3 combination, was observed for D
1
MUT ⁄
D
2
R3 and was equal to 0.4% (2.36 ns). A similar
result (0.8%; 2.35 ns) was obtained for cells co-express-
ing the dopamine D
1
receptor mutant (D
1
MUT) and
the wild-type dopamine D
2
receptor, as donor and
acceptor of fluorescence, respectively.
However, when the cells were cotransfected with
plasmids encoding genes for the same type of dopa-
mine receptors, D
1
or D
2
, and when one of the appro-
priate receptors was replaced by its mutant (D
1
by
D
1
MUT or D
2
by D
2
R3), no change in transfer effi-
ciency was detectable. The E value for D
1
MUT ⁄ D
1
was estimated to be 7.8% (2.19 ns) versus 8%
(2.18 ns) for D
1
⁄ D
1
, while for D
2
⁄ D
2
R3, it equaled
3.4% (2.29 ns) versus 3.5% (2.28 ns) for D
2
⁄ D
2
combi-
nations.
The summary of TCSPC results is presented in
Tables 2 and 3. The error of the average fluorescence
lifetime is the standard error of mean obtained from
different cells and independent transfections (we
ignored standard deviations derived from fitting of
individual fluorescence decay because they were very
small).
Discussion
The data provided from numerous studies indicate that
oligomerization may play important roles in receptor
trafficking and ⁄ or signaling. In several cases, receptors
appear to fold into constitutive dimers early after bio-
synthesis, although ligand-promoted dimerization at
the cell surface has been also proposed [53]. Many
GPCRs have been shown to participate in homo- or
heterodimerization [54]. Using a biophysical approach,
we had previously shown that the D
2
and D
1
dopa-
mine receptors exist as functional homo- and hetero-
oligomers in cell lines [49], and similar conclusions can
be drawn from biochemical studies [14,19,55,56].
However, the exact sequence motifs responsible for
that interaction had not been identified. In family 1
receptors, robust hydrophobic TM interactions have
been proposed as the most probable structural ele-
ments involved in oligomerization [27,57,58]. Some
Fig. 5. Time-dependent fluorescence intensity decays of CFP
attached to the D
1
receptor with and without YFP attached to the
D
1
MUT receptor. The black dotted curve shows the intensity decay
of the donor alone (D), and the dark gray dotted curve shows
the intensity decay of the donor in the presence of acceptor (DA).
The black solid lines and weighted residuals (lower panels) are
for the best double exponential fits. The gray dotted curve repre-
sents the excitation pulse diode laser profile, set up at 434 nm.
Table 2. Summary of energy transfer measurements by fluores-
cence lifetime microscopy in HEK293 cells. Excitation was set up
at 434 nm, and emission was observed through the appropriate
interference filters, as described in Experimental procedures. The
standard errors of means (obtained from at least 15 single cells)
are presented in parentheses. Statistical significance was evaluated
using Student’s t-test; *P < 0.05 versus D
1
–CFP ⁄ D
2
–YFP.
Species
Average lifetime (ns)
Transfer
efficiency
ÆEæ (%)Æs
D
æÆs
DA
æ
D
1
–CFP
a
2.37 ± 0.01
D
1
–CFP ⁄ D
2
–YFP
b
2.27 ± 0.02 4.01
D
1
–CFP ⁄ D
2
R1–YFP
c
2.32 ± 0.02 2.10*
D
1
–CFP ⁄ D
2
R2–YFP
d
2.34 ± 0.01 1.26*
D
1
–CFP ⁄ D
2
R3–YFP
e
2.36 ± 0.01 0.44*
D
1
MUT–CFP ⁄ D
2
–YFP
f
2.35 ± 0.02 0.80
D
1
MUT–CFP ⁄ D
2
R3–YFP
g
2.36 ± 0.01 0.40
a
Measured in cell expressing CFP coupled to the dopamine D
1
receptor.
b
Measured in cell co-expressing dopamine D
1
and D
2
fusion proteins (D
1
–CFP and D
2
–YFP).
c
Measured in cell
co-expressing dopamine D
1
and D
2
fusion proteins (D
1
–CFP and
D
2
R1–YFP – genetic variant of dopamine D
2
receptor).
d
Measured
in cell co-expressing dopamine D
1
and D
2
fusion protein (D
1
–CFP
and D
2
R2–YFP – genetic variant of dopamine D
2
receptor).
e
Mea-
sured in cell co-expressing dopamine D
1
and D
2
fusion proteins
(D
1
–CFP and D
2
R3–YFP – genetic variant of dopamine D
2
receptor).
f
Measured in cell co-expressing dopamine D
1
and D
2
fusion pro-
teins (D
1
MUT–CFP – genetic variant of dopamine D
1
receptor and
D
2
–YFP).
g
Measured in cell co-expressing dopamine D
1
and D
2
fusion proteins (D
1
MUT–CFP – genetic variant of dopa-
mine D
1
receptor and D
2
R3–YFP – genetic variant of dopamine D
2
receptor).
Dopamine D
1
and D
2
receptors dimerization S. Łukasiewicz et al.
766 FEBS Journal 276 (2009) 760–775 ª 2008 The Authors Journal compilation ª 2008 FEBS
experimental studies also suggested the participation of
C- and N-terminal regions and the ic3 in this process
[16,32,43]. Using pull-down and MS experiments, Ciru-
ela et al. postulated that heterodimerization of the
adenosine A
2A
and dopamine D
2
receptors strongly
depends on an electrostatic interaction between an
Arg-rich epitope from the ic3 of the D
2
R
(217RRRRKR222) and either the two adjacent Asp
residues (DD 401–402) or a phosphorylated Ser374 in
the C-tail of the A
2A
R [43].
Because the dopamine D
1
R contains an acidic
region on the C-terminus, like A
2A
R, we designed
experiments to determine whether a similar interaction
is responsible for the heterodimerization of the D
2
receptor with the D
1
receptor. However, a different
approach to that mentioned above was used to address
this question. The receptor proteins under investigation
were tagged with fluorescent proteins and transfected
into HEK293 cells; their localization was then
observed with the use of a confocal microscope. The
degree of receptor dimerization was also judged by
changes in fluorescence lifetime, which we find to be
the most sensitive technique with which to measure
FRET [49].
The results presented here indicate that dopa-
mine D
1
and D
2
receptors form homo- and hetero-
dimers; results that are in agreement with previously
published data [19,49,55]. Measuring receptor dimer-
ization by monitoring changes in the fluorescence life-
time of probes linked to the receptors of interest seems
the best approach in this kind of the study. Although
the approach enables only qualitative estimation of
FRET phenomenon, steady-state fluorescence spectros-
copy measurements in suspension are also useful
because they are very demonstrative. In this study,
both approaches yield similar conclusions, although we
are aware that quantitative results can only be
obtained from fluorescence lifetime microscopy.
An often-discussed problem when using biophysical
techniques to study receptor oligomerization is that
these experiments predominantly involve heterologous
expression systems, which in most cases have been per-
formed in cell lines transfected with the receptors of
interest. Receptors are usually epitope-tagged and, in
most cases, are overexpressed. Therefore, it has often
been suggested that biophysical techniques characterize
interaction artifacts that occur due to high nonphysio-
logical protein expression. However, GPCRs oligomer-
ization is difficult to analyze in native cells, therefore,
the human embryonic kidney cell line has been widely
used in resonance energy transfer studies of membrane
receptors, because these cells provide an accepted
model in which fluorescently tagged receptor protein
can be efficiently expressed. As reported by Mercier
et al. [59], the extent of dimerization of b
2
-adrenergic
receptors (shown by BRET) was unchanged over a
20-fold range of expression levels (from 1.4 to
26.3 pmolÆmg
)1
protein). While studying the homodi-
merization of neuropeptide Y receptors, Dinger et al.
[60] also demonstrated that the FRET effect was inde-
pendent of the level of receptor expression. These find-
ings imply that examples of GPCR dimerization are
not merely artifacts derived from the high levels of
expression that are often achieved in heterologous sys-
tem. Results obtained in this study, concerning the
dopamine D
1
and D
2
receptors and their interactions
with the appropriate a subunits of G protein, further
confirm that the use of advanced fluorescence techni-
ques does indeed allow for the observation of true
interactions. The dopamine D
1
receptor did not inter-
act with Ga
i
, and the D
2
receptor did not interact with
Ga
s
, although the physical contact of these receptors
with their appropriate a subunit partners could indeed
have been observed, despite the identical level of over-
expression of the proteins in all studied combinations.
The experiments described above serve as a control
that must always be performed when using FRET to
determine if two proteins interact. That control is to
express (preferentially using the same expression con-
struct in all experiments) two noninteracting fusion
proteins that carry CFP and YFP in the same cell and
Table 3. Summary of energy transfer measurements obtained by
fluorescence lifetime microscopy in HEK293 cells. Excitation was
set up at 434 nm, and emission was observed through appropriate
interference filters, as described in Experimental procedures. The
standard errors of means (obtained from at least 15 single cells)
are presented in parentheses.
Species
Average lifetime (ns)
Transfer
efficiency
ÆEæ (%)Æs
D
æÆs
DA
æ
D
1
–CFP
a
2.37 ± 0.01
D
1
–CFP ⁄ D
1
–YFP
b
2.18 ± 0.01 8.00
D
1
MUT–CFP ⁄ D
1
–YFP
c
2.19 ± 0.01 7.80
D
2
–CFP
d
2.37 ± 0.02
D
2
–CFP ⁄ D
2
–YFP
e
2.28 ± 0.02 3.50
D
2
–CFP ⁄ D
2
R3–YFP
f
2.29 ± 0.01 3.40
a
Measured in cell expressing CFP coupled to dopamine D
1
recep-
tor.
b
Measured in cell co-expressing two dopamine D
1
receptor
fusion proteins (D
1
–CFP and D
1
–YFP).
c
Measured in cell
co-expressing two dopamine D
1
receptor fusion proteins (D
1
MUT–
CFP – genetic variants of dopamine D
1
receptor and D
1
–YFP).
d
Measured in cell expressing dopamine D
2
receptor coupled to
CFP (D
2
–CFP).
e
Measured in cell co-expressing two dopamine D
2
receptor fusion proteins (D
2
–CFP and D
2
–YFP).
f
Measured in cell
co-expressing two dopamine D
2
receptor fusion proteins (D
2
–CFP
and D
2
R3–YFP – genetic variant of dopamine D
2
receptor).
S. Łukasiewicz et al. Dopamine D
1
and D
2
receptors dimerization
FEBS Journal 276 (2009) 760–775 ª 2008 The Authors Journal compilation ª 2008 FEBS 767
show that there was no FRET fluorescence after nor-
malizing and making corrections for cross-talk. In
experiments investigating receptor interactions, that
was the case; FRET was observed only when the
receptor was co-expressed with the appropriate a sub-
unit of the G protein and not in the other case.
Although there is discussion in the literature concern-
ing the possibilities of photoconversion of YFP into a
CFP-like species during acceptor photobleaching
FRET experiments, we, as well as others, can exclude
that such photoconversion interferes with FRET
measurements under standard conditions.
Two acidic residues in the C-terminal end of the D
1
receptor, as well as the Arg-rich region of ic3 of the D
2
receptor, do not seem to take part in receptor
homodimerization, but they do influence D
1
–D
2
recep-
tor heterodimerization. Replacing the C-tail Glu resi-
dues with Ala significantly decreased the FRET signal,
as measured by changes in the fluorescence lifetimes.
Also, the degree of D
1
–D
2
receptor heterodimerization
strongly depended on the number of Arg residues that
were replaced by Ala in the Arg-rich region of ic3 (resi-
dues 217–222) of the dopamine D
2
receptor. The effi-
ciency of energy transfer in the wild-type of the D
1
and
D
2
heterodimer was $ 4% and decreased to 2.1% upon
replacing the first two Arg. Replacement of an addi-
tional two Arg residues in ic3 caused a further decrease
in the FRET efficiency by $ 50 to 1.26%. When all res-
idues in the basic region of the D
2
receptor were
replaced, only a marginal level of energy transfer was
observed (0.44%). A similar effect on energy transfer
was observed after the replacement of two acidic Glu
residues in the C-tail of the D
1
receptor. The efficiency
of energy transfer was reduced to 0.8%. A possible
interpretation of the data suggests that the indicated
basic region of ic3 of the D
2
receptor and acidic region
of the C-tail of the D
1
receptor might be involved in
the interactions between the two dopamine receptors.
In addition, the subcellular localization of D
1
–CFP,
D
2
–YFP and all the mutants of both receptors was
examined in cells expressing one or both types of
receptors using confocal microscopy. In cotransfected
cells, both the D
1
and D
2
receptors were found in the
plasma membrane, but a portion of both receptors
was also present inside the cell. Similar results were
obtained by So et al., suggesting that these receptors
were assembled as hetero-oligomers in intracellular
compartments [14].
Based on the results obtained with confocal micros-
copy, we conclude that the mutation in the C-tail of
the D
1
receptor did not change the localization of the
receptor because both wild-type D
1
and the mutant
were localized in the cell membrane. However, the D
2
receptor was localized at the cell surface with a consid-
erable portion also present within the cell. Analysis of
cells containing the D
1
and D
2
receptors, as well as
cells expressing D
1
MUT and D
2
, showed that the level
of colocalization was very similar. This result clearly
indicates that the significant decrease in energy transfer
observed between D
1
MUT and D
2
is the effect
of impaired heterodimerization of the dopamine
receptors.
Moreover, confocal microscopy experiments revealed
that modification of the Arg-rich region in the ic3 of
the D
2
receptor substantially changed its receptor traf-
ficking properties. The binding experiments also
pointed to a decrease in the density of the D
2
R vari-
ants in the cellular membrane; the number of D
2
receptor binding sites decreased with the number of
changed Arg residues in the ic3. When compared with
wild-type receptor, the binding of [
3
H]spiperone to
D
2
R1 and D
2
R2 showed a significant decrease in the
B
max
, 50 and 85%, respectively. In the case where the
whole region between amino acids 217 and 222 was
exchanged, we were unable to detect any D
2
receptor
in the membrane. The results obtained by confocal
microscopy show that the D
2
R3 mutant was mainly
localized in the cytoplasmic compartments. However,
cotransfection with wild-type D
2
R changed the distri-
bution of this protein. This suggests that wild-type D
2
receptor can modulate the localization of the D
2
R3
mutant receptor. We did not observe such an effect in
cells expressing the dopamine D
1
and D
2
R3 receptors.
The D
2
R3 receptor was observed only in the cytoplas-
mic compartments, similar to the situation when it was
expressed alone. The difference might result from the
fact that wild-type D
2
–D
2
R3 homodimers are being
created during D
2
receptor biosynthesis, whereas that
process does not take place in the case of D
1
-D
2
R3
co-expression. It is probably the direct interactions
between the D
2
and the D
2
R3 receptor mutant that
reduced efficiency in the trafficking of the wild-type
receptor to the cell surface. These observations are
consistent with data showing that co-expression of a
C- or N-terminal-truncated D
2
receptor with the wild-
type receptor resulted in attenuation of binding and
reduced efficiency in the trafficking of the wild-type D
2
receptor [61].
The construction of genetic variants of the studied
dopamine receptors, which were supposed to prove the
contribution of the indicated residues to the formation
of D
1
–D
2
receptor heterodimers, did not provide a clear
answer to the question posed at the beginning of the
study. From the FRET experiments, it may be unequiv-
ocally concluded that the acidic C-terminal residues of
the D
1
receptor are engaged in heterodimerization, but
Dopamine D
1
and D
2
receptors dimerization S. Łukasiewicz et al.
768 FEBS Journal 276 (2009) 760–775 ª 2008 The Authors Journal compilation ª 2008 FEBS
not in homodimerization, as the efficiency of energy
transfer is the same for wild-type D
1
receptor as for
D
1
–D
1
MUT. Both of these receptors are localized in
the cell membrane, as can be seen with confocal
microscopy. Therefore, it can also be concluded that
the C-terminal acidic residues are by no means
involved in the regulation of D
1
receptor membrane
localization.
However, genetically manipulating the Arg-rich epi-
tope in the ic3 of the D
2
receptor induced alterations in
the cellular localization of the resulting receptor pro-
teins. If not for confocal microscopy, which allowed for
the visualization of receptor localization, the gradual
decrease in the degree of D
1
–D
2
receptor (and its vari-
ants) heterodimerization that was observed in FRET
experiments could have been interpreted as a direct
indication of the role of the Arg-rich epitope in the for-
mation of heterodimers, as had been done in case of
adenosine A
2A
–dopamine D
2
heterodimerization [43].
However, based on these data, we have to conclude
that the Arg-rich epitope in the ic3 loop of D
2
is also
responsible for receptor localization. The lack of energy
transfer between the YFP-tagged D
2
receptor genetic
variants and CFP-tagged D
1
receptor can result from
the different localization of these proteins in the cell.
The molecular mechanisms underlying the transport
processes of GPCRs from the ER to the cell surface
have recently become the subject of extensive studies
[62]. The conserved sequences ⁄ motifs in the D
2
R,
essential for their exit from the ER, are currently
under investigation. ER export is the first step in intra-
cellular trafficking of GPCRs and is a highly regulated
event in the biogenesis of GPCRs. Sequence motifs
play a crucial role in the targeting of polypeptides to
the plasma membrane. The Arg-rich motif in D
2
R
might also be a potential trafficking signal. Such
motifs serve as endoplasmic reticulum retention signals
that prevents the export of proteins to the plasma
membrane. There are three types of retention motifs
identified in the cytosolic domains of various proteins:
KDEL, KKXX and RXR motifs [62,63]. The RXR
motif (also three or four repeated Arg residues)
actively precludes the exit of the protein from the
endoplasmic reticulum [62,64,65]. Under normal condi-
tions, this motif is masked, and proteins are trans-
ported to the cell surface without significant
accumulation in the endoplasmic reticulum. If the Arg-
rich motif in D
2
R serves as a retention signal, then
replacing adjacent Arg residues should increase the
surface expression of D
2
R. We observed the opposite
effect; the Arg-rich sequence in the cytoplasmic ic3
loop of D
2
R does not act as an endoplasmic reticulum
retention signal. Misfolding of the D
2
R2 and D
2
R3
mutants could potentially be responsible for their accu-
mulation in the endoplasmic reticulum because only
protein that has assumed its native conformation is
available for recruitment into the transport vesicles
leaving the endoplasmic reticulum. Therefore, the Arg-
rich motif might be responsible for interactions with
cytoskeletal proteins. Binda et al. have shown that
cytoskeletal protein 4.1 N, a member of the 4.1 family,
facilitates the transport of D
2
R to the cell surface by
interacting with the N-terminal portion of the ic3 loop
of D
2
R via its C-terminal domain [66]. Truncation
analysis localized a region of interaction within resi-
dues 211–241 of D
2
R. Because this study used genetic
variants of D
2
R that lacked either 2, 4 or 6 residues
from the 217–222 motif of ic3, and the cellular locali-
zation of these mutants depended on the number of
the basic residues exchanged for Ala, it may be
concluded that proper interaction with protein 4.1 N
might have been disturbed. Therefore, the D
2
R
mutants stay in the endoplasmic reticulum and are not
transported to the cell membrane.
Intracellular signaling pathway components, such as
heteromeric G proteins and adenylate cyclase, are pres-
ent in the endoplasmic reticulum and Golgi apparatus
[67]. Because the intracellular localization of the dopa-
mine D
2
receptor has been also described in the stria-
tum [68], it seems that elucidation of the mechanisms
responsible for fine tuning of receptor trafficking, as
well as its dimerization with other receptor partners, is
very important for understanding the rules that govern
receptor activity, both in physiological and patholo-
gical conditions.
Receptor dimerization, which is important for trans-
membrane signal generation [54], also plays a role in
intracellular trafficking of receptors and controlling
their folding status. As suggested by So et al., hetero-
oligomerization, by changing the exposure or masking
motifs responsible for endoplasmic reticulum retention
or export, may be a strong regulator of the cellular
distribution of receptors [14].
Incorrect membrane localization of D
2
R after modi-
fication within ic3 217–222 region (observed in the cells
co-expressing D
1
R and D
2
R3) can result from defec-
tive interactions with cytoskeletal proteins as well as
from impaired heterodimerization with D
1
R. When in
the cell both D
2
R3 mutant and D
2
R wild-type are
present, most likely the D
2
R may help D
2
R3 to
achieve the cell-surface receptor dimerization. Similar
situation has been described by Concepcion et al. They
have shown that rhodopsin mutant devoid of traffick-
ing signal motif localized in the plasma membrane
when it was co-expressed with the wild-type receptor,
as a results of both proteins oligomerization [69].
S. Łukasiewicz et al. Dopamine D
1
and D
2
receptors dimerization
FEBS Journal 276 (2009) 760–775 ª 2008 The Authors Journal compilation ª 2008 FEBS 769
This study indicates that even an advanced bio-
physical approach cannot be used solely in the studies
dedicated to finding the sequences responsible for
membrane receptor dimerization, i.e. without monitor-
ing the cellular localization of the studied proteins and
their genetic variants.
Experimental procedures
Materials
All molecular biology reagents were obtained from Fermen-
tas (Vilnius, Lithuania). Oligonucleotides were synthesized
by IBB PAN (Warsaw, Poland). The pECFP–N1 and pEY-
FP–N1 vectors were purchased from BD Biosciences, Clon-
tech (Palo Alto, CA, USA). The pcDNA3.1(+) plasmids
encoding the human dopamine D
1
, human dopamine D
2
receptors and a subunits of G proteins were obtained from
the UMRcDNA Resource Center (University of Missouri-
Rolla, MO, USA). The bacterial cell line Escherichia coli
DH5a (Dam+) was purchased from Novagen (Darmstadt,
Germany).
HEK293 cells were obtained from the American Type
Culture Collection (Manassas, VA, USA). All cell culture
materials were purchased from Gibco (Carlsbad, CA, USA)
and Sigma (Poznan
´
, Poland).
Construction of fusion proteins
The human dopamine D
1
and D
2
receptor genes were
cloned into the pcDNA3.1(+) plasmid and used as the
starting point to construct the fusion proteins. Molecules
were tagged with cDNA encoding enhanced cyan or yellow
fluorescent proteins (ECFP or EYFP) and used after
expression as the fluorescence donor or acceptor, respec-
tively. Henceforth the cyan (ECFP) and yellow (EYFP)
variants are called CFP and YFP, respectively.
The full-length cDNAs encoding the above-mentioned
proteins were PCR-amplified. The forward primer was uni-
versal for pcDNA3.1(+), and the reverse primers removed
the stop codons and introduced a unique restriction site,
XhoI, for both dopamine receptors and SacI for stimula-
tory and inhibitory G protein subunit. The resulting frag-
ments were inserted, in-frame, into the Nhe I ⁄ XhoI
(dopamine receptors) or NheI ⁄ SacI (Ga subunits) sites of
the pECFP–N1 and pEYFP–N1 vectors.
Construction of genetic variants of the dopamine
receptors
The following genetic variants of the dopamine receptors
were constructed: three variants of the dopamine D
2
recep-
tor in which six amino acid residues (two each) from the
arginine-rich epitope (217RRRRKR222) of the third intra-
cellular loop were exchanged (D
2
R1: 217AARRKR222,
D
2
R2: 217AAAAKR222, D
2
R3: 217AAAAAA222), as well
as one variant of the dopamine D
1
receptor, in which an
acidic epitope (404EE405) from the C-tail was exchanged
(D
1
MUT: 404AA405). Each exchanged residue was
mutated to an alanine residue.
The appropriate point mutations were produced accord-
ing to the QuikChange II Site-Directed Mutagenesis Kit
Manual (Stratagene, La Jolla, CA, USA). Dopamine D
1
and D
2
genes inserted into pECFP–N1 and pEYFP–N1
vectors, respectively, were used as the mold for the PCR-
Quik reaction. Incorporating the oligonucleotide primers,
each complementary to the opposite strand of the vector
and containing the desired mutations, generated a mutated
plasmid. The resulting product was treated with endonucle-
ase DpnI, specific for methylated and hemimethylated
DNA, in order to select synthesized DNA containing the
introduced mutations. E. coli DH5 a cells were transformed
with mutated plasmid. D
2
R1–pEYFP vector was used as
the mold for PCR-Quik in which D
2
R2–pEYFP was
obtained, which then served as the starting point to make
the D
2
R3–pEYFP construct.
Cell culture and transfection
HEK293 cells were grown in Dulbecco’s modified essential
medium, supplemented with 1% l-glutamine and 10%
heat-inactivated fetal bovine serum, at 37 °C in an atmo-
sphere of 5% CO
2
. Transient transfections of HEK293 cells
were performed by the calcium phosphate precipitation
method, as described by Sambrook et al. [70]. Cells were
transfected with plasmid encoding either receptor (D
1
,
D
1
MUT, D
2
)–CFP or receptor (D
1
,D
2
,D
2
R1, D
2
R2,
D
2
R3)–YFP fusion protein alone or cotransfected with
both plasmids in different combinations. One day before
transfection, cells were seeded into 100 mm dishes at a den-
sity of 3 · 10
6
cells per dish for fluorescence spectra mea-
surements and binding assays or on glass cover slips in
30 mm dishes at a density of 1 · 10
6
cells per dish for fluo-
rescence lifetime measurements and confocal imaging. They
were transfected with 12 lg of DNA per 100 mm dish and
2 lg of DNA per 30 mm dish. The ratio of DNA coding
donor to DNA coding acceptor was 1 : 1 or 1 : 2.
Membrane preparation and radioligand
binding assay
For binding experiments, the transfected HEK293 cells
were washed with NaCl ⁄ P
i
, scraped from the dish in
NaCl ⁄ P
i
, and centrifuged at 160 g for 5 min.
The pellet was frozen at )30 °C until use. Frozen pellets
were resuspended in binding buffer (50 mm Tris ⁄ HCl pH
7.4 containing 120 mm NaCl, 5 mm KCl, 4 mm MgCl
2
and
1mm EDTA) using an Ultra Turrax homogenizer. The
Dopamine D
1
and D
2
receptors dimerization S. Łukasiewicz et al.
770 FEBS Journal 276 (2009) 760–775 ª 2008 The Authors Journal compilation ª 2008 FEBS
homogenates were centrifuged twice at 30 000 g for 10 min.
[
3
H]SCH23390 (specific activity of 86 CiÆmmol
)1
; NEN,
Boston, MA, USA) was used as the dopamine D
1
receptor-
specific radioligand, and [
3
H]spiperone (specific activity of
15.7 CiÆmmol
)1
; NEN) was used as the dopamine D
2
recep-
tor-specific radioligand. Binding assays were performed in a
total volume of 500 lL. Saturation studies were carried out
on a fresh membrane preparation (final protein concentra-
tion of 20 and 40 lgÆtube
)1
for the D
1
and D
2
dopamine
receptor, respectively) using concentrations of
[
3
H]SCH23390 ranging from 0.06 to 6 nm or concentrations
of [
3
H]spiperone ranging from 0.01 to 4 nm. Nonspecific
binding was assessed by the addition 10 lm cis-(Z)-flu-
pentixol (Lundbeck, Copenhagen, Denmark) for the dopa-
mine D
1
receptor or 50 lm butaclamol (Research
Biochemicals Inc., Natick, MA, USA) for the dopamine D
2
receptor. Tubes were incubated either for 90 min at room
temperature ([
3
H]SCH23390) or for 30 min at 37 °C
([
3
H]spiperone), then binding was terminated by rapid fil-
tration through glass fiber filters (GF ⁄ C, Whatman). The
filters were washed four times with 5 mL of ice-cold wash-
ing buffer (50 mm Tris ⁄ HCl pH 7.4), and the amount of
bound radioactivity was determined by liquid scintillation
counting (Beckman LS 650).
Radioligand binding parameters, K
d
and B
max
, were esti-
mated using the graphpad prism 2.0 curve-fitting program
(GraphPad Software, San Diego, CA, USA).
Fluorescence spectroscopy measurements
Spectrofluorymetric measurements of the cell suspensions
were recorded on Fluorolog 3 (Horiba, Jobin Yvon S.A.S.,
Longjumeau, France) at 37 °C, 48 h after transfection.
Cells cultured from a single 100 mm dish was washed and
detached from the plate using NaCl ⁄ P
i
. Afterwards, the
suspension was centrifuged at 400 g and resuspended in
1 mL of isotonic buffer (137.5 mm NaCl, 1.25 mm MgCl
2
,
1.25 mm CaCl
2
,6mm KCl, 5.6 mm glucose, 10 mm Hepes,
0.4 mm NaH
2
PO
4
, pH 7.4). CFP was excited at 434 nm,
and YFP was excited at 475 nm. Fluorescence was detected
at 450–550 nm through a double monochromator. The exci-
tation and emission slits were 2 and 10 nm, respectively.
All fluorescence spectra were collected using a 10 mm
quartz cuvette (Hellma, Mullheim, Germany). The spectral
contributions arising from light scattering and nonspecific
fluorescence of cells and buffer were eliminated by subtract-
ing the emission spectra of mock-transfected cells from the
fluorescence spectra of cells expressing the receptor–CFP
and –YFP constructs [71].
FRET measurement obtained by fluorescence
lifetime microscopy
TCSPC measurements were performed using a Nicon
Eclipse TE-2000 inverted fluorescence microscope (Precoptic
Co., Warsaw, Poland). The specimen was excited with the
diode pulse laser (Horiba, Jobin Yvon IBH S.A.S.) at
434 nm with 1 MHz repetition. Fluorescence emission was
recorded by a picosecond detector, TBX-04 (Horiba, Jobin
Yvon IBH S.A.S.). The Jobin Yvon IBH data station and
the das 6 software were used for data acquisition and decay
analysis.
Two fluorescence lifetime standards, p-terphenyl and
erythrosine B, that have single exponential decays (p-ter-
phenyl in cyclohexane: 980 ps – sd 30 ps, erythrosin in
methanol: 470 ps – sd 20 ps and erythrosin in water 89 ps –
sd 3 ps) were used to test our lifetime instrumentation. The
obtained lifetimes agree very well with the ones reported by
Boens et al. [72].
Cells dedicated to TCSPC experiments were grown on cov-
erslips. The fluorescence decay from single cells transfected
with fusion protein constructs was measured using a ·60
objective and dichroic beam splitter at 455 nm, combined
with an emitter cut off filter > 475 nm. The excitation pulse
diode laser profile, required for deconvolution analysis, was
measured on the diluted glycogen using the fluor cube with
400 nm dichroic beam splitter only. All measurements were
performed at 37 °C. Cells were incubated in the same iso-
tonic buffer as used for fluorescence spectra measurements.
During each experiment, fluorescence decay from at least 10
cells on the coverslip was measured.
Each fluorescence decay measurement was analyzed with
the multiexponential model given by:
IðtÞ¼
X
n
i¼1
a
i
e
Àt
s
i
ð1Þ
where I(t) is the fluorescence intensity in time t, a
i
are
pre-exponential factors representing amplitudes of the
components at t =0, s
i
are the decay times, and n is
the number of decay times. Best fit parameters were obtained
by minimizing the reduced chi-squared value and residual
distribution. The average fluorescence lifetime Æsæ was calcu-
lated from:
s
hi
¼
P
i
a
i
Á s
2
i
P
i
a
i
Á s
i
ð2Þ
The average efficiency of energy transfer ÆEæ was calcu-
lated from the average fluorescence lifetime of donor in the
absence Æs
D
æ or presence Æs
DA
æ of an acceptor from:
E
hi
¼ 1 À
s
DA
hi
s
D
hi
ð3Þ
Confocal microscopy
HEK293 cells grown on cover slips were transiently trans-
fected with the cDNA encoding the fluorescently labeled
proteins. Images were acquired using a BioRad MRC 1024
S. Łukasiewicz et al. Dopamine D
1
and D
2
receptors dimerization
FEBS Journal 276 (2009) 760–775 ª 2008 The Authors Journal compilation ª 2008 FEBS 771
confocal system (BioRad, Warsaw, Poland), interfaced with
a Nicon Diapoth 300 (Nicon) inverted microscope. The
microscope was equipped with a ·60 PlanApo oil-immer-
sion 1.4 NA objective lens and a 100 mW argon ion
air-cold laser (ITL). CFP and YFP fluorescence was excited
by 457 and 514 nm wavelength lights, respectively. A z458 ⁄
514rpc dual primary dichroic (Chroma) was used. To sepa-
rate the fluorescence emissions of CFP and YFP, a
510DCLP dichroic (VHS filter block) and HQ485 ⁄ 30 and
HQ540 ⁄ 30 (Chroma) emission filters were used. Images
were analyzed with laser sharp v. 3.2 (Carl Zeiss, Jena,
Germany).
image proplus 4.5 software was used for colocalization
analysis. Colocalization describes the existence of two or
more fluorescently labeled molecule types in the same
spatial positions. Pearson’s correlation coefficient is used to
measure the overlap of the pixels and reflects the degree of
relationship between two variables. It is one of the standard
measures in pattern recognition:
R ¼
P
i
ðRi À RavÞÁðGi À GavÞ
ffiffiffiffiffiffiffiffiffiffiffiffiffiffiffiffiffiffiffiffiffiffiffiffiffiffiffiffiffiffiffiffiffiffiffiffiffiffiffiffiffiffiffiffiffiffiffiffiffiffiffiffiffiffiffiffiffiffiffiffiffiffi
P
i
ðRi À RavÞ
2
Á
P
i
ðG
i
À GavÞ
2
r
ð4Þ
where Ri and Gi are the red and green intensities of voxel
I, respectively, and Rav and Gav the average values of Ri
and Gi, respectively.
It is used for describing the correlation of the intensity
distributions between red and green component of each
dual-channel image. Pearson’s correlation coefficients were
calculated from randomly selected parts of the image
(membrane signal) from individual cells cotransfected with
different construct combinations (wild-type or mutant fluor-
escently tagged D
1
and D
2
receptor protein). The average
intensity of the fluorescence signal was measured for every
image in a determined individual area of interest free of cell
culture and subtracted as a background. For analysis these
regions were used of which fluorescence intensities were
correlated. For each combination of proteins, a minimum
of 20 individual regions from different, independently trans-
fected cells were counted. Statistical analysis was performed
using Student‘s t-test and Mann–Whitney’s test.
Interpretation of Pearson’s correlation coefficients, espe-
cially relative to each other is difficult as their relative mag-
nitudes are not proportional. By that reason coefficients of
determination (which are squared value of correlation coef-
ficients) were estimated. The resulting coefficient of determi-
nation allows us to estimate the proportion of overlapping
variance between two sets of pixels thus makes interpreting
correlation coefficients easier.
Acknowledgement
This work was supported by grants from the Ministry
of Science (2P05A 071 29 and P04A 070 29).
References
1 Hansen JL & Sheikh SP (2004) Functional conse-
quences of 7TM receptor dimerization. Eur J Pharm Sci
23, 301–317.
2 Rios CD, Jordan BA, Gomes I & Devi LA (2001)
G-protein-coupled receptor dimerization: modulation of
receptor function. Pharmacol Ther 92, 71–87.
3 Bulenger S, Marullo S & Bouvier M (2005) Emerging
role of homo- and heterodimerization in G-protein-
coupled receptor biosynthesis and maturation. Trends
Pharmacol Sci 26, 131–137.
4 Hague C, Uberti MA, Chen Z, Hall RA & Minneman
KP (2004) Cell surface expression of alpha1D-adrener-
gic receptors is controlled by heterodimerization with
alpha1B-adrenergic receptors. J Biol Chem 279, 15541–
15549.
5 Lopez-Gimenez JF, Canals M, Pediani JD & Milligan
G (2007) The alpha1b-adrenoceptor exists as a higher-
order oligomer: effective oligomerization is required for
receptor maturation, surface delivery, and function.
Mol Pharmacol 71, 1015–1029.
6 Margeta-Mitrovic M, Jan YN & Jan LY (2000) A traf-
ficking checkpoint controls GABA(B) receptor heterodi-
merization. Neuron 27, 97–106.
7 Minneman KP (2007) Heterodimerization and surface
localization of G protein coupled receptors. Biochem
Pharmacol 73, 1043–1050.
8 Salahpour A, Angers S, Mercier JF, Lagace
´
M, Marullo
S & Bouvier M (2004) Homodimerization of the beta2-
adrenergic receptor as a prerequisite for cell surface
targeting. J Biol Chem 279, 33390–33397.
9 Breit A, Lagace
´
M & Bouvier M (2004) Hetero-oligo-
merization between beta2- and beta3-adrenergic recep-
tors generates a beta-adrenergic signaling unit with
distinct functional properties. J Biol Chem 279, 28756–
28765.
10 Mellado M, Rodrı
´
guez-Frade JM, Vila-Coro AJ, Fern-
a
´
ndez S, Martı
´
n de Ana A, Jones DR, Tora
´
nJL&
Martı
´
nez-A C (2001) Chemokine receptor homo- or
heterodimerization activates distinct signaling pathways.
EMBO J 20, 2497–2507.
11 Prinster SC, Hague C & Hall RA (2005) Heterodimer-
ization of G protein-coupled receptors: specificity &
functional significance. Pharmacol Rev 57, 289–298.
12 White JH, Wise A, Main MJ, Green A, Fraser NJ, Dis-
ney GH, Barnes AA, Emson P, Foord SM & Marshall
FH (1998) Heterodimerization is required for the for-
mation of a functional GABA(B) receptor. Nature 396,
679–682.
13 Fiorentini C, Gardoni F, Spano P, Di Luca M &
Missale C (2003) Regulation of dopamine D1 receptor
trafficking and desensitization by oligomerization with
glutamate N-methyl-d-aspartate receptors. J Biol Chem
278, 20196–20202.
Dopamine D
1
and D
2
receptors dimerization S. Łukasiewicz et al.
772 FEBS Journal 276 (2009) 760–775 ª 2008 The Authors Journal compilation ª 2008 FEBS
14 So CH, Varghese G, Curley KJ, Kong MM, Alijania-
ram M, Ji X, Nguyen T, O’Dowd BF & George SR
(2005) D1 and D2 dopamine receptors form heteroolig-
omers and cointernalize after selective activation of
either receptor. Mol Pharmacol 68, 568–578.
15 Terrillon S & Bouvier M (2004) Roles of G-protein-
coupled receptor dimerization. EMBO Rep 5, 30–34.
16 Cvejic S & Devi LA (1997) Dimerization of the delta
opioid receptor: implication for a role in receptor inter-
nalization. J Biol Chem 272, 26959–26964.
17 Breitwieser G (2004) G protein-coupled receptor oligo-
merization: implications for G protein activation and
cell signaling. Circ Res 94, 17–27.
18 Kroeger KM, Pfleger KD & Eidne KA (2003) G-pro-
tein coupled receptor oligomerization in neuroendocrine
pathways. Front Neuroendocrinol 24, 254–278.
19 Lee SP, O’Dowd BF, Rajarm RD, Nguyen T & George
SR (2003) D2 dopamine receptor homodimerization is
mediated by multiple sites of interaction, including an
intermolecular interaction involving transmembrane
domain 4. Biochemistry 42, 11023–11031.
20 Nemoto W & Toh H (2005) Prediction of interfaces for
oligomerizations of G-protein coupled receptors. Pro-
teins 58, 644–660.
21 Romano C, Yang WL & O’Malley KL (1996) Metabo-
tropic glutamate receptor 5 is a disulfide-linked dimer.
J Biol Chem 271, 28612–28616.
22 Berthouze M, Rivail L, Lucas A, Ayoub MA, Russo O,
Sicsic S, Fischmeister R, Berque-Bestel I, Jockers R &
Lezoualc’h F (2007) Two transmembrane Cys residues
are involved in 5-HT4 receptor dimerization. Biochem
Biophys Res Commun 356, 642–647.
23 Carrillo JJ, Lo
´
pez-Gime
´
nez JF & Milligan G (2004)
Multiple interactions between transmembrane helices
generate the oligomeric alpha1b-adrenoceptor. Mol
Pharmacol 66, 1123–1137.
24 Fotiadis D, Jastrzebska B, Philippsen A, Mu
¨
ller DJ,
Palczewski K & Engel A (2006) Structure of the rho-
dopsin dimer: a working model for G-protein-coupled
receptors. Curr Opin Struct Biol 16, 252–259.
25 Fotiadis D, Liang Y, Filipek S, Saperstein DA, Engel
A & Palczewski K (2003) Atomic-force microscopy:
rhodopsin dimers in native disc membranes. Nature
421, 127–128.
26 Liang Y, Fotiadis D, Filipek S, Saperstein DA, Pal-
czewski K & Engel A (2003) Organization of the G pro-
tein-coupled receptors rhodopsin and opsin in native
membranes. J Biol Chem 278, 21655–21662.
27 Guo W, Shi L & Javitch JA (2003) The fourth trans-
membrane segment forms the interface of the dopa-
mine D2 receptor homodimer. J Biol Chem 278, 4385–
4388.
28 Hebert TE, Moffett S, Morello JP, Loisel TP, Bichet
DG, Barret C & Bouvier M (1996) A peptide derived
from a beta2-adrenergic receptor transmembrane
domain inhibits both receptor dimerization and activa-
tion. J Biol Chem 271, 16384–16392.
29 Hernanz-Falco
´
n P, Rodrı
´
guez-Frade JM, Serrano A,
Juan D, del Sol A, Soriano SF, Roncal F, Go
´
mez L,
Valencia A, Martı
´
nez-A C et al.
(2004) Identification of
amino acid residues crucial for chemokine receptor
dimerization. Nat Immunol 5, 216–223.
30 Gouldson PR, Higgs C, Smith RE, Dean MK, Gkoutos
GV & Reynolds CA (2000) Dimerization and domain
swapping in G-protein-coupled receptors: a computa-
tional study. Neuropsychopharmacology 23, 60–77.
31 Overton MC, Chinault SL & Blumer KJ (2003) Oligo-
merization, biogenesis, and signaling is promoted by a
glycophorin A-like dimerization motif in transmem-
brane domain 1 of a yeast G protein-coupled receptor.
J Biol Chem 278, 49369–49377.
32 AbdAlla S, Zaki E, Lother H & Quitterer U (1999)
Involvement of the amino terminus of the B(2) receptor
in agonist-induced receptor dimerization. J Biol Chem
274, 26079–26084.
33 Kunishima N, Shimada Y, Tsuji Y, Sato T, Yamamoto
M, Kumasaka T, Nakanishi S, Jingami H & Morikawa
K (2000) Structural basis of glutamate recognition by
a dimeric metabotropic glutamate receptor. Nature 407,
971–977.
34 Salim K, Fenton T, Bacha J, Urien-Rodriguez H,
Bonnert T, Skynner HA, Watts E, Kerby J, Heald A,
Beer M et al. (2002) Oligomerization of G-protein-cou-
pled receptors shown by selective co-immunoprecipita-
tion. J Biol Chem 277, 15482–15485.
35 Kaupmann K, Malitschek B, Schuler V, Heid J, Froestl
W, Beck P, Mosbacher J, Bischoff S, Kulik A, Shigem-
oto R et al. (1998) GABA(B)-receptor subtypes assem-
ble into functional heteromeric complexes. Nature 396,
683–687.
36 Pagano A, Rovelli G, Mosbacher J, Lohmann T,
Duthey B, Stauffer D, Ristig D, Schuler V, Meigel I,
Lampert C et al. (2001) C-terminal interaction is essen-
tial for surface trafficking but not for heteromeric
assembly of GABA(b) receptors. J Neurosci 21, 1189–
1202.
37 Zeng FY & Wess JJ (1999) Identification and molecular
characterization of m3 muscarinic receptor dimers.
J Biol Chem 274, 19487–19497.
38 Bai M (2004) Dimerization of G-protein-coupled recep-
tors: roles in signal transduction. Cell Signal 16, 175–186.
39 Bouvier M (2001) G protein-coupled receptor oligomer-
ization: implications for G protein activation and cell
signaling. Nat Rev Neurosci 2, 274–286.
40 Hebert TE & Bouvier M (1998) Structural and func-
tional aspects of G protein-coupled receptor oligomeri-
zation. Biochem Cell Biol 76, 1–11.
41 Woods AS & Ferre S (2005) Amazing stability of the
arginine–phosphate electrostatic interaction. J Proteome
Res 4, 1397–1402.
S. Łukasiewicz et al. Dopamine D
1
and D
2
receptors dimerization
FEBS Journal 276 (2009) 760–775 ª 2008 The Authors Journal compilation ª 2008 FEBS 773
42 Jackson SN, Wang HYJ, Yergey A & Woods AS
(2006) Phosphate stabilization of intermolecular interac-
tions. J Proteome Res 5, 122–126.
43 Ciruela F, Burguen
˜
o J, Casado V, Canals M, Marcelli-
no D, Goldberg SR, Bader M, Fuxe K, Agnati LF,
Lluis C et al. (2004) Combining mass spectrometry and
pull-down techniques for the study of receptor hetero-
merization. Direct epitope–epitope elostratic interac-
tions between adenosine A2A and dopamine D2
receptors. Anal Chem 76, 5354–5363.
44 Woods AS, Ciruela F, Fuxe K, Agnati LF, Lluis C,
Franco R & Ferre S (2005) Role of electrostatic interac-
tion in receptor-receptor heteromerization. J Mol
Neurosci 26, 125–132.
45 Aizman O, Brismar H, Uhlen P, Zettergren E, Levey
AI, Forssberg H, Greengard P & Aperia A (2000)
Anatomical and physiological evidence for D1 and D2
dopamine receptor colocalization in neostriatal neurons.
Nat Neurosci 3, 226–230.
46 Surmeier DJ, Song WJ & Yan Z (1996) Coordinated
expression of dopamine receptors in neostriatal medium
spiny neurons. J Neurosci 16, 6579–6591.
47 Lee SP, So CH, Rashid AJ, Varghese G, Cheng R,
Lanca AJ, O’Dowd BF & George SR (2004) Dopamine
D1 and D2 receptor co-activation generates a novel
phospholipase C-mediated calcium signal. J Biol Chem
79, 35671–35678.
48 Vincent SL, Khan Y & Benes FM (1993) Cellular distri-
bution of dopamine D1 and D2 receptors in rat medial
prefrontal cortex. J Neurosci 13, 2551–2564.
49 Dziedzicka-Wasylewska M, Faron-Go
´
recka A, Andre-
cka J, Polit A, Kus
´
mider M & Wasylewski Z (2006)
Fluorescence studies reveal heterodimerization of dopa-
mine D
1
and D
2
receptors in the plasma membrane.
Biochemistry 45, 8751–8759.
50 Lakowicz JR (1999) Principles of Fluorescence Spectros-
copy, 2nd edn. Kluwer Academic ⁄ Plenum Publishers,
New York, NY.
51 Elangovan M, Day RN & Periasamy A (2002) Nanosec-
ond fluorescence resonance energy transfer-fluorescence
lifetime imaging microscopy to localize the protein inter-
actions in a single living cell. J Microsc 205, 3–14.
52 Łukasiewicz S, Błasiak E, Faron-Go
´
recka A, Polit A,
TworzydłoM,Go
´
recki A, Wasylewski Z & Dziedzicka-
Wasylewska M (2007) Fluorescence studies of homooli-
gomerization of adenosine A
2A
and serotonin 5-HT
1A
receptors reveal the specificity of receptor interactions
in the plasma membrane. Pharmacol Rep 59, 379–392.
53 Angers S, Salahpour A & Bouvier M (2002) Dimeriza-
tion: an emerging concept for G protein-coupled recep-
tor ontogen and function. Annu Rev Pharmacol Toxicol
42, 409–435.
54 Milligan G (2007) G protein-coupled receptor dimerisa-
tion: molecular basis and relevance to function. BBA
1768, 825–835.
55 O’Dowd BF, Ji X, Alijaniaram M, Rajaram RD, Kong
MM, Rashid A, Nguyen T & George SR (2005) Dopa-
mine receptor oligomerization visualized in living cells.
J Biol Chem 80, 37225–37235.
56 Rashid AJ, So CH, Kong MMC, Furtak T, El-Ghundi
M, Cheng R, O’Dowd BF & George SR (2007) D1–D2
dopamine receptor heterooligomers with unique phar-
macology are coupled to rapid activation of Gq ⁄ 11 in
the striatum. Proc Natl Acad Sci USA 104, 654–659.
57 Carillo JJ, Pediani J & Milligan G (2003) Dimers of
class A G protein-colupled receptors function via ago-
nist-mediated trans-activation of associated G proteins.
J Biol Chem 278, 42578–42587.
58 Filizola M & Weinstein H (2005) The study of G-pro-
tein coupled receptor oligomerization with computa-
tional modeling and bioinformatics. FEBS J 272,
2926–2938.
59 Mercier JF, Salahpour A, Angers S, Breit A & Bouvier
M (2002) Quantitative assessment of beta 1- and beta
2-adrenegic receptor homo- and heterodimerization by
bioluminescence resonance energy transfer. J Biol Chem
277, 44925–44931.
60 Dinger MC, Bader JE, Kobor AD, Kretzschmar AK &
Beck-Sickinger AG (2003) Homodimerization of neuro-
peptide Y receptors by fluorescence resonance energy
transfer in living cells. J Biol Chem 278, 10562–10571.
61 Lee SP, O‘Dowd BF, Ng GYK, Varghese G, Akil H,
Mansour A, Nguyen T & George SR (2000) Inhibition
of the cell surface expression by mutant receptors dem-
onstrates that D
2
dopmaine receptors exist as oligomers
in the cell. Mol Pharm 58, 120–128.
62 Dong C, Filipeanu CM, Duvernay MT & Wu G (2007)
Regulation of G protein-coupled receptor export traf-
ficking. BBA 1768, 853–870.
63 Michelsen K, Yuan H & Schwappach B (2005) Hide
and run. Arginine-based endoplasmic-reticulum-sorting
motifs in the assembly of heteromultimeric mebrane
proteins. EMBO Rep 6, 717–722.
64 Ren Z, Riley NJ, Garcia EP, Sanders JM, Swanson GT
& Marshall J (2003) Multiple trafficking signals regulate
kainate receptor KA2 subunit surface expression.
J Neurosci 23, 6608–6616.
65 Hardt B, Kalz-Fu
¨
ller B, Aparicio R, Vo
¨
lker C & Bause
E (2003) (Arg)
3
within the N-termianl domain of gluo-
cosidase I contains ER targeting information but is not
required absolutely for ER localization. Glycobiology
13, 159–168.
66 Binda AV, Kabbani N, Lin R & Levenson R (2002) D2
and D3 receptor cell surface localization mediated by
interaction with protein 4.1N. Mol Pharmacol 62, 507–
513.
67 Yamamoto S, Kawamura K & James TN (1998)
Intracellualr distribution of adenylate cyclase in human
cardiocytes determined by electron microscopic cyto-
chemistry. Microsc Res Tech 40, 479–487.
Dopamine D
1
and D
2
receptors dimerization S. Łukasiewicz et al.
774 FEBS Journal 276 (2009) 760–775 ª 2008 The Authors Journal compilation ª 2008 FEBS
68 Khan ZU, Mrzljak L, Gutierrez A, de la Calle A &
Goldman-Rakic PS (1998) Prominence of the dopamine
D2 short isoform in dopaminergic pathways. Proc Natl
Acad Sci USA 95, 7731–7736.
69 Concepcion F, Mendez A & Chen J (2002) The car-
boxyl-terminal domain is essential for rhodopsin trans-
port in rod photoreceptors. Vision Res 42, 417–426.
70 Sambrook J, Fritsch EF & Maniatis T (1996) Molecular
Cloning: A Laboratory Manual, 3nd edn. Cold Spring
Harbor Laboratory Press, Cold Spring Harbor, NY.
71 Stanasila L, Perez JB, Vogel H & Coteechia S (2003)
Oligomerization of the alpha 1a- and alpha 1b-adrener-
gic receptor subtypes. Potential implications in receptor
internalization. J Biol Chem 278, 40239–40251.
72 Boens N, Qin W, Basaric
´
N, Hofkens J, Ameloot M,
Pouget J, Lefe
`
vre JP, Valeur B, Gratton E, vandeVen
M et al. (2007) Fluorescence lifetime standards for time
and frequency domain fluorescence spectroscopy. Anal
Biochem 79, 2137–2149.
S. Łukasiewicz et al. Dopamine D
1
and D
2
receptors dimerization
FEBS Journal 276 (2009) 760–775 ª 2008 The Authors Journal compilation ª 2008 FEBS 775