Water Footprint and Virtual Water Trade in Spain doc
Bạn đang xem bản rút gọn của tài liệu. Xem và tải ngay bản đầy đủ của tài liệu tại đây (5.23 MB, 160 trang )
Water Footprint and Virtual Water Trade in Spain
NATURAL RESOURCE MANAGEMENT AND POLICY
Editors:
David Zilberman
Dept. of Agricultural and Resource Economics
University of California, Berkeley
Berkeley, CA 94720
Renan Goetz
Department of Economics
University of Girona, Spain
Alberto Garrido
Department of Agricultural Economics and Social Sciences
Technical University of Madrid, Spain
EDITORIAL STATEMENT
There is a growing awareness of the role that natural resources such as water, land, forests
and environmental amenities play in our lives. There are many competing uses for natural
resources, and society is challenged to manage them to improve social well being.
Furthermore, there may be dire consequences to natural resources mismanagement.
Renewable resources such as water, land and the environment are linked, and decisions
made with regard to one may affect the others. Policy and management of natural resources
now require an interdisciplinary approach including natural and social sciences to correctly
address our societal preferences.
This series provides a collection of works containing the most recent findings on economics,
management and policy of renewable biological resources such as water, land, crop
protection, sustainable agriculture, technology, and environmental health. It incorporates
modern thinking and techniques of economics and management. Books in this series will
combine knowledge and models of natural phenomena with economics and managerial
decision frameworks to assess alternative options for managing natural resources and the
environment.
The Series Editors
For other titles published in this series, go to
www.springer.com/series/6360
Alberto Garrido
●
M. Ramón Llamas
Consuelo Varela-Ortega
●
Paula Novo
Roberto Rodríguez-Casado
●
Maite M. Aldaya
Water Footprint and Virtual
Water Trade in Spain
Policy Implications
Alberto Garrido
Department of Agricultural Economic
and Social Sciences
Technical University of Madrid (UPM)
28040 Madrid
Spain
Consuelo Varela-Ortega
Department of Agricultural Economic
and Social Sciences
Technical University of Madrid (UPM)
28040 Madrid
Spain
Roberto Rodríguez-Casado
Department of Agricultural Economic
and Social Sciences
Technical University of Madrid (UPM)
28040 Madrid
Spain
M. Ramón Llamas
Universidad Complutense de
28040 Madrid
Spain
Paula Novo
Department of Agricultural Economic
and Social Sciences
Technical University of Madrid (UPM)
28040 Madrid
Spain
Maite M. Aldaya
University of Twente
7500 AE Enschede
Netherlands
ISBN 978-1-4419-5740-5 e-ISBN 978-1-4419-5741-2
DOI 10.1007/978-1-4419-5741-2
Springer New York Dordrecht Heidelberg London
Library of Congress Control Number: 2010923233
© La Fundación Marcelino Botín-Sanz de Sautuola y López 2010
All rights reserved. This work may not be translated or copied in whole or in part without the written
permission of the publisher (Springer Science+Business Media, LLC, 233 Spring Street, New York, NY
10013, USA), except for brief excerpts in connection with reviews or scholarly analysis. Use in connection
with any form of information storage and retrieval, electronic adaptation, computer software, or by similar
or dissimilar methodology now known or hereafter developed is forbidden.
The use in this publication of trade names, trademarks, service marks, and similar terms, even if they are
not identified as such, is not to be taken as an expression of opinion as to whether or not they are subject
to proprietary rights.
Printed on acid-free paper
Springer is part of Springer Science+Business Media (www.springer.com)
To my wife, Beatriz
A.G.
To my colleagues, Ramón Llamas
and Alberto Garrido
C.V.O.
To my parents, Chus and Suso
P.N.
To my parents and brother
R.R.C.
To the co-authors, and in particular
to my mentor, Ramón Llamas
M.M.A.
To Josemaria Escrivá, his example and
writings have been a beacon in my work
M.R.L.
vii
Acknowledgements
The authors would like to acknowledge the continuous support of Dr. Rafael
Benjumea, Director of the Fundación Marcelino Botón (FMB) up until the very last
minute the book was sent to press. He has been an inspirational source for our work
and a tough challenger for some of the ideas developed in this book. After numer-
ous lengthy discussions, he eventually began to understand why our contributions
may offer a fresh look into one of the most thoroughly analysed water economies
in the world. Mr. Federico Ysart, Director of the Trends Observatory of the FMB,
was also an active discussant in the process that led to the FMB’s decision to
publish this book. We received constant encouragement and valuable service from
Ms. Esperanza Botella, FMB’s Deputy Director.
The authors would also like to acknowledge Dr. Elena López-Gunn’s generosity
for reading thoroughly Chap. 8 and making valuable suggestions.
Finally, we must also acknowledge Profs. Anthony Allan (Kings College, England),
Mordechai Shechter (Haifa University, Israel) and Arjen Hoekstra (Twente University,
The Netherlands) for reading the first version of the manuscript and participating in a
seminar held in Madrid in October 2008. Part of the value of this book is due to their
critical reading and their valuable comments. Some of its weaknesses were not over-
looked by them, as in fact they were clearly indicated, but we could not sort them out
without delaying more than desired the submission of the volume.
Lastly, we also wish to acknowledge Jon Gurstelle, our Springer editor, for
believing in our project and helping us with the technical (and legal) details in the
publishing stage.
ix
Contents
1 Introduction 1
1.1 General Framework 1
1.2 Objective 4
2 Literature Review 7
2.1 The Concept of Virtual Water 7
2.2 The Colours of Water 8
2.3 International Virtual-Water “Trade” 9
2.4 Water Footprint Concept and Its Relation
to Economic Growth 11
2.4.1 Scale Effects 13
2.4.2 Sectoral Composition 14
2.4.3 Technological Change 15
3 Methodological Approaches 17
3.1 Introduction 17
3.2 Water-Footprint Calculation 18
3.3 Internal Water Footprint 18
3.3.1 Crop Water Use 19
3.3.2 Livestock Water Use 21
3.3.3 Industrial and Urban Water Use 22
3.3.4 Virtual-Water “Exports” 22
3.4 External Water Footprint 24
3.4.1 Virtual-Water “Imports” 24
3.5 Virtual-Water “Flow” 24
3.6 Apparent Productivity of Water and Land 25
3.7 Economic Value of Water 25
3.8 An Econometric Approach 29
3.8.1 Explaining Water Productivity by Water Scarcity
and Water Quality 29
3.8.2 Explaining Blue Virtual-Water “Exports”
by Water Scarcity and Water Quality 31
3.8.3 Explaining Water Scarcity by Water Quality 32
x Contents
3.8.4 Exchange Terms of Virtual-Water “Trade” 33
3.8.5 Water Quality Valuation 33
4 Data and Limitations 37
4.1 Data sources 37
4.2 Limitations 39
5 Spain’s Water Footprint 41
5.1 Agricultural Water Footprint 43
5.1.1 Water Footprint: Irrigation and Water Demand 45
5.1.2 Economic Aspects of the Water Footprint 48
5.2 Livestock Water Footprint 53
5.2.1 Livestock Sector’s Water Footprint 55
5.2.2 Water Footprint of Animal Feed Production 57
5.2.3 Economic Aspects of the Water Footprint 63
5.3 Industrial Water Footprint 64
5.3.1 Water Footprint 65
5.3.2 Economic Water Footprint 67
5.4 Urban Water Footprint 67
5.4.1 Water Footprint 67
5.5 The River Basin Scale: The Water Footprint of the Guadiana 68
5.5.1 Guadiana Water Footprint 68
5.5.2 Agricultural Water Footprint in the Guadiana Basin 70
5.5.3 Water Footprint of Irrigated Crops (m
3
/ton) 70
5.5.4 Economic Aspects of the Water Footprint 74
6 Net Virtual-Water “Flows” 77
6.1 Virtual-Water “Imports” 79
6.1.1 Major Crop-Related Virtual-Water “Imports” 80
6.1.2 Economic Valuation of Virtual-Water “Imports” 81
6.2 Virtual-Water “Exports” 83
6.2.1 Virtual-Water “Trade” 87
6.2.2 Economic Virtual-Water “Trade” 88
6.3 Virtual-Water “Trade” Within the Guadiana Basin:
The Regional Scale 90
7 Bringing the Analysis to the Policy Context 95
7.1 Changes in Land Productivity 96
7.1.1 The Ebro Basin 97
7.1.2 The Duero Basin 97
7.1.3 The Guadalquivir Basin 100
7.1.4 The Júcar Basin 100
7.1.5 The Tagus Basin 102
7.1.6 The Guadiana Basin 102
7.1.7 The Sur and Segura Basins 102
xiContents
7.2 Water Scarcity, Allocation and Economic Efficiency 104
7.3 Water Productivity in Light of Water Scarcity 112
7.4 Explaining Water Scarcity by Water Quality 118
7.5 Virtual-Water “Trade” as an Adaptation to Climate Change 119
7.6 Economic Growth, Water Footprint and Water Exchanges: Can
Growth Be Decoupled from Water Use? 121
8 Summary and Conclusions 125
8.1 Virtual Water and Water Footprint of Spain 126
8.2 Water Allocation in Light of Virtual Water 128
8.3 Re-Thinking Water Scarcity Paradigms 130
8.4 Lessons Learned at the River Basin Scale: Guadiana
Case Study 132
8.5 Lessons Learned and Avenues for Further Research 134
Glossary 137
References 143
Index 151
1
A. Garrido et al., Water Footprint and Virtual Water Trade in Spain: Policy Implications,
Natural Resource Management and Policy 35, DOI 10.1007/978-1-4419-5741-2_1,
© La Fundación Marcelino Botín-Sanz de Sautuola y López 2010
1.1 General Framework
In most arid and semi-arid countries, water resource management is an issue that is
both important and controversial. Most water resources experts now acknowledge
that water conflicts are not caused by physical scarcity but are mainly due to poor
water management (Rosegrant et al. 2002; Benoit and Comeau 2005; Comprehensive
Assessment of Water Management in Agriculture 2007; Garrido and Dinar 2010,
among others). The scientific and technological advances of the past 50 years have
led to new ways to solve many water-related conflicts, often with tools that seemed
unthinkable a few decades ago (Llamas 2005; Lopez-Gunn and Llamas 2008).
This study deals with the estimation and analysis of Spain’s water footprint, both
from a hydrological and economic perspective. Its ultimate objective is to report on
the allocative efficiency of water and economic resources. This analysis can provide
a transparent and multidisciplinary framework for informing and optimising water
policy decisions, contributing at the same time to the implementation of the EU
Water Framework Directive (WFD) (2000/60/EC). It also responds to the current
mandate of the Spanish Ministry of Environment and Rural and Marine Affairs,
which recently issued instructions for drafting river basin management plans in
compliance with the EU Water Framework Directive, with a deadline of end of
year 2009 and then every 6 years (BOE 2008).
The water footprint (WF) is a consumption-based indicator of water use
(Hoekstra and Chapagain 2008). The WF of an individual or community is defined
as the total volume of freshwater that is used to produce the goods and services
consumed by the individual or community (Hoekstra and Chapagain 2008).
Closely linked to the concept of water footprint is the virtual-water concept (VW).
The virtual-water content of a product (a commodity, good or service) refers to the
volume of water used in its production (Allan 1997, 1999; Hoekstra 2003). Building
on this concept, virtual-water “trade” represents the amount of water embedded in
traded products (Hoekstra and Hung 2002). A critical issue related to the under-
standing of globalisation is whether international trade can save water globally. In
principle, it does if a water-intensive commodity is traded from an area where it is
produced with high water productivity (resulting in products with low virtual-water
Chapter 1
Introduction
2 1 Introduction
content) to an area with lower water productivity (Hoekstra and Chapagain 2008).
For instance, Yang and Zehnder (2008) show that about 336 km
3
/year could be
saved through virtual-water “trade” in agricultural commodities alone. Nevertheless,
the relevance of global water savings needs a more detailed study, because savings
represent only about 5% of the global water footprint and the uncertainties and
limitations of the estimations may be greater than this 5%. Although virtual-water
“trade” evaluations have taken countries or even bigger regions as the trading partners,
the concept can also be applied within countries and even river basins. In fact, this
is the dual perspective of this study.
At the national or regional level, a nation can preserve its domestic water
resources by importing products instead of producing them domestically. This is
particularly relevant to arid or semi-arid countries with scarce water resources such
as Spain. As this study explains, Spain imports water-intensive low-economic value
crops (mainly wheat, maize and soybeans and soy products), while it exports water-
extensive high-value commodities adapted to the Mediterranean climate, essen-
tially olive oil, fruits and vegetables. However, most countries, including Spain,
import and export the same or very similar commodities, with trade flows that vary
by season, specific varieties and market trends of supply and demand. Because
water is not the main input in virtually all traded goods, water scarcity and supply
costs are poor explanatory factors of virtual-water “trade”, except in very special
contexts. As basic resources such as water and energy become increasingly
scarce, the potential for international trade as a way to promote efficient use of
these resources becomes more policy relevant. While virtual-water “trade” cannot
be considered as the primary motivation for commodity trade, one can always test
whether virtual-water “trade” can enable or facilitate more efficient water allocation
among competing ends.
In addition to its potential contribution to water savings, it is also important to
establish whether the water used originates from rainwater evaporated during the
production process (green water) or surface water and/or groundwater evaporated
as a result of the production of the product (blue water) (Falkenmark 2003).
Traditionally, emphasis has been paid to the concept of blue water through the
“miracle” of irrigation systems. However, an increasing number of authors high-
light the importance of green water (Rockström 2001; Falkenmark and Rockström
2004; Allan 2006; Comprehensive Assessment of Water Management in Agriculture
2007). The economic and hydrological assessment of the water footprint and the
virtual water (both green and blue) used in the different economic sectors could
facilitate more efficient allocation and use of water resources, globally, nationally
or locally, while providing a transparent interdisciplinary framework for policy
formulation. Furthermore, the Achilles’ heel of the current emphasis of rainfed
agriculture (green water) is climate variability, which will increase, as most studies
focusing on the Mediterranean región indicate (MMA 2007; Bates et al. 2008).
In order to mitigate drought episodes, water works such as dams and canals have been
built, and wells have been drilled to complement surface water supplies. In the last
half century, however, there has been a silent revolution in groundwater-irrigated
agriculture. This is a relevant fact recognised by many authors today (Briscoe 2005;
3
1.1 General Framework
Llamas and Martínez-Santos 2005; Shah et al. 2007; Villholth and Giordano 2007).
As a matter of fact in some countries, mainly in India, groundwater development is
much more important than surface water irrigation (Mukherji et al. 2009).
While rainfed crops depend only on meteorological conditions, irrigated crops
depend both on rain regimes and water supply. The combination of these regimes
and the interdependencies between international commodity markets and domestic
production create opportunities to ensure that water is allocated to the most valuable
ends.
This book mainly deals with Spain’s water footprint and offers a virtual-water
analysis that differentiates green and blue (surface and groundwater) components,
both from a hydrological and economic perspective. It looks at the potential of
these concepts in helping achieve an efficient allocation of water resources. First of
all, it defines the concepts of virtual water, the colours of water, virtual-water
“trade” and the water footprint and analyses the impact of economic growth on the
latter. A glossary with key terms is included at the end of the document. The study
then explores the different economic sectors in detail at the national, provincial and
river basin levels. Special attention is given to crop production that accounts for
about 80% of the total consumptive use (or water footprint) of use of green and blue
water resources. This is followed by assessments of the footprints of livestock,
industry, energy and urban water use. Virtual-water “trade” is evaluated both within
the EU and with third countries. Finally, the policy implications of this analysis are
assessed. A better knowledge of the water footprint and virtual-water “trade” in
Spain and in other arid and semi-arid countries can be very useful for developing a
comprehensive instrumental framework across time and space to support water
management decisions. Ultimately, this knowledge-based tool can be used by the
water authorities to achieve a more efficient allocation of water resources. Spain
has already largely adopted the “more crops and jobs per drop” paradigm, but it
struggles to achieve the new goal of “more cash and nature per drop”, because
water productivity in many areas of the economy is already high. Furthermore, the
literature has rarely considered the actual opportunity cost of the water that is used
and exported in virtual form. For countries suffering continuous water shortages,
this poses a serious limitation to drawing policy-relevant conclusions from the
concepts of water footprint and virtual-water “trade”. In this respect, the generally
higher economic efficiency of groundwater irrigation deserves a more thorough
analysis, expanding on the earlier assessment of Andalusian irrigation (Hernandez-
Mora et al. 2001; Vives 2003).
For the time being and in almost the entire world, water footprint analyses have
focused on hydrological aspects, based on volumetric evaluations. A significant
innovation of this work is to emphasise the imperative challenge of considering
economic and ecological factors, with the aim of moving towards a policy that will
enable to balance the trade-off between water for nature and water for rural liveli-
hoods, that is to seek for “more cash and nature per drop”. Water footprint analyses
provide new data and perspectives for a more optimistic outlook on the frequently
cited looming “water scarcity crisis”. This new knowledge is changing traditional
water and food security concepts that most policy makers have held until now.
4 1 Introduction
1.2 Objective
The objective of this study is to assess and analyse Spain’s virtual-water “trade”
(VW) and water footprint (WF), differentiating the green and blue (surface and
groundwater) components, both from a hydrological and economic perspective.
The research program that provided the results reported in the following chapters
was envisioned and designed with the following criteria:
1. A multi-layered perspective – international, national and regional (basin level) is
needed to understand and analyse a country’s water policy. The geographical
analysis casts light on regional controversies lived in Spain since 2000.
2. As water use and productivity change over time and vary geographically, a
wealth of interpretative data can be gathered, analysed and placed in a global
context (both as a cause and an effect of the observed changes at the national
level).
3. Agriculture being the largest water consumer, it is of utmost importance to
understand how green and blue water components vary with time and from place
to place. This variation has implications for water productivity, water allocation
and drought management, which in turn are linked to international trade.
4. Water is an economic good and provides market and non-market services
(Costanza et al. 1997). Its economic dimension must be included in the kind of
“motion pictures” featuring the water footprint and virtual-water “trade” that we
are aiming to produce in this study. This criterion is entirely consistent with the
approach of the WFD and the most recent trends in Spanish water policy.
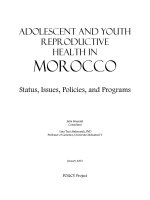
With these points in mind, this study aims to contribute to the WF and VW literature
in the following areas (see Fig. 1.1 for a schematic description):
By evaluating both WF and VW over time and at the provincial scale, the analysis •
allows for policy-relevant conclusions at the river basin level.
By separating green and blue water components and evaluating all crops at the •
provincial level, the study enables a finer analysis of how WF and VW vary
during droughts and water shortages as well as during wet periods. The linkage
between commodity trade and water scarcity will be explored to determine the
extent to which virtual-water “trade” has the potential to deal with water-stressed
periods. This is a crucial factor for water management in arid and semi-arid
countries
By also evaluating WF in terms of m•
3
/€ – bringing the pioneering approach of
WF based on m
3
/ton to a socio-economic context – the productive economy is
better integrated in the analysis. This provides a distinctive view of WF and
allows for a closer linkage between water productivity and water scarcity, in
physical and economic terms.
Water scarcity is evaluated in terms of opportunity cost, both for virtual-water •
“trade” and WF, which in this study is corrected with the water quality status of
the rivers in each province. This analysis, therefore, includes both market and
non-market dimensions.
5
1.2 Objective
This research study mainly builds on an earlier study by Chapagain and
Hoekstra (2004), who estimated the water footprint of nations for the 1997–
2001 period. This study, however, covers 1997–2006 and analyses the Spanish
water footprint variations from year to year, not only at a national but also at
provincial and river basin levels. In both studies, water footprints are assessed
following the top-down approach. A significant innovation of this work is to
emphasise the challenge of considering economic aspects. Concerning the
spatial dimension, this study explores the different sectors at the national, river
basin and provincial levels. Furthermore, it refines the methodology of earlier
studies (Hoekstra and Hung 2002; Chapagain and Hoekstra 2004; Hoekstra and
Chapagain 2008) including a number of modifications to adapt the general
approach to the Spanish context. Results obtained by Rodríguez Casado et al.
(2009) show that, using this detailed method, the Spanish agricultural footprint
is 50% of the equivalent footprint estimated by Chapagain and Hoekstra (2004).
Finally, an open debate is necessary both on the concept of VW and WF and on
the available data. This report hopes to make a down-to-earth contribution to this
debate through up-to-date, detailed evaluations that enable a closer evaluation of
the water footprint and virtual-water “trade”. This study will also help explain the
roots of regional water conflicts and the role of water markets, through a detailed
geographical analysis of water productivity changes across provinces and throughout
the study period.
•
•
•
•
•
•
•
•
•
•
•
•
•
•
2,500 -
4,000
1,500 -
2,500
500 -
1,500
0 -500
Million m
3
???
?????
2,500 -
4,000
1,500 -
2,500
500 -
1,500
0 - 500
Million m
3
???
?????
2,500 -
4,000
1,500 -
2,500
500 -
1,500
0 - 500
Million m
3
Inference potential:
Global Sustainability
External
Internal
Double perspective of the WF evaluation
Economic
Quantitative
Water scarcity (/ m3)
Water scarcity:
cana
rias
m
3
/ kg m
3
/kg
m
3
/ kg
m
3
/ kg
Water footprint:
Virtual water
trade:
Policy implications:
Water footprint in
Spain
Blue water
Green water
Trade
Water Policy
Sustainability
Time variation (policy, technology change, trade)
Exports
Imports
Spatial variation (climatic, water conditions)
Year t+2
Year t+1
Year t
Fig. 1.1 Schematic description of the project
7
2.1 The Concept of Virtual Water
First introduced by Allan (1997, 1999), the concept of “virtual water” refers to the
volume of water used to produce a commodity, good or service. This term can be
defined from two distinct perspectives. From the production-site standpoint, the
virtual-water content of a product is the volume of freshwater used to produce a
product measured at the place where it is produced (Hoekstra and Chapagain 2008).
From the consumption-site standpoint, it refers to the volume of water that would
have been required to produce a product where it is consumed (Hoekstra and
Chapagain 2008).
The present study uses the first definition. The adjective “virtual” refers to
the fact that most of the water used to produce a product is not contained in it;
the real-water content of products being generally negligible compared with the
virtual-water content (Hoekstra and Chapagain 2008). The volume of virtual water
to produce a crop mainly depends on climatic conditions, water management
options and agricultural practices. While significant research is being done to find
ways to increase harvests and reduce water applications (Fereres 2010), real and
significant changes in water demand can occur, changing the land that receives
irrigation water and the crops that are irrigated. In the EU, cropping patterns have
been profoundly influenced by farm and trade policies (Varela-Ortega 2008), but
now, due to more decoupled modes of farm income support, EU farmers are
responding more to market signals. And most of these originate from global markets,
offering broad opportunities to exploit the connections between food markets and
farm trade and water policies.
As this book will explain, water shortages and scarcity result from endogenous
processes linked to policies and consumption that promote water demand which in
turn results in bigger water footprints. One of the contributions of this study is to
think of virtual water not only as the physical amount of resource embedded in the
consumed and traded goods, but also as an economic good with opportunity cost
that varies over time and according to quality and location. Not all virtual water
that is traded – for example, in wheat, oil, meat or automobiles – is equally
valuable.
Chapter 2
Literature Review
A. Garrido et al., Water Footprint and Virtual Water Trade in Spain: Policy Implications,
Natural Resource Management and Policy 35, DOI 10.1007/978-1-4419-5741-2_2,
© La Fundación Marcelino Botín-Sanz de Sautuola y López 2010
8 2 Literature Review
2.2 The Colours of Water
The virtual-water content of a product consists of three components: green, blue
and grey water. For the purpose of policy formulation, it is essential to distinguish the
various water components since they have different characteristics (Hoekstra 2007).
First, the green virtual-water content of a product is the volume of rainwater that
evaporated during the production process (Hoekstra and Chapagain 2008). This is
particularly relevant for agricultural products, where it refers to the total rainwater
stored in the soil as soil moisture and evaporated from the field during the growing
period of the crop (including both evapotranspiration by the plants and evaporation
from the soil).
Second, the blue virtual-water content of a product is the volume of surface or
ground water that evaporated as a result of its production (Hoekstra and Chapagain
2008). In the case of crop production, the blue water content of a crop is defined as
the sum of the evaporation of irrigation water from the soil and the evaporation of
water supplied from irrigation canals and artificial storage reservoirs. In industrial
production and domestic water supply, the blue water content of the product or
service is equal to the part of the water withdrawn from ground or surface water
that evaporates and thus does not return to the system it came from. Evaporated
water is considered unavailable for other uses, even though it may come back as
rainfall (usually hundreds of kilometres away). Many irrigated crops are also
receiving some rainfall, so total water demand is often satisfied by a mix of natural
and artificial sources. Furthermore, the amount of blue water demanded for irrigation
varies because weather conditions vary significantly. A technical evaluation in
Andalusia (with almost 900,000 ha of irrigated land) found that crop blue water
evapotranspirative demand varies from 3.4 to 5 billion m
3
, depending on weather
conditions during the growing season (Aquavir 2006).
The distinction between green and blue water originates from Falkenmark
(1995). Blue and green water resources fundamentally differ in their scope of appli-
cation and thus opportunity cost (Chapagain et al. 2005). Green water cannot be
automatically re-allocated to uses other than natural vegetation or alternative rainfed
crops, whereas blue water can be used for irrigating crops and also for other urban,
agricultural and industrial water uses (Fraiture et al. 2004; Hoekstra 2007).
Furthermore, the use of green water in crop production is considered more sustainable
than blue water (Yang et al. 2006), although that is not necessarily the case if blue
water sources are exploited below their sustainable yield. In the semi-arid and
sub-humid regions of the world, water is a key challenge in food production, due
to the extreme variability of rainfall, long dry seasons and recurrent droughts,
floods and dry spells. The key challenge is to reduce the water-related risks posed
by high-rainfall variability rather than coping with an absolute lack of water
(Comprehensive Assessment of Water Management in Agriculture 2007). There is
generally enough rainfall to double and often even quadruple crop yields in rainfed
farming systems, even in water-constrained regions (Comprehensive Assessment of
Water Management in Agriculture 2007), but often it is available at the wrong time,
9
2.3 International Virtual-Water “Trade”
causing dry spells and much of this improvement is lost. The focus of the past 50
years on managing rainfall in farmers’ fields through soil and water conservation
cannot by itself reduce the risks posed by frequent dry spells. Investments are
needed in water resources management in smallhold rainfed farming systems that
use supplementary irrigation in combination with rainfall (Comprehensive
Assessment of Water Management in Agriculture 2007).
Within the blue water component, it is also very important to distinguish
between surface and groundwater systems. Groundwater plays a significantly
different role than surface water. In line with existing data, groundwater-irrigated
agriculture shows higher productivity when compared to irrigation with surface
water (Hernandez-Mora et al. 2001). This higher productivity can be explained in
part by the greater ability of farmers to control water use and the supply guarantee
or security that groundwater provides against dry spells. These two facts in turn
allow farmers to invest, without fear of dry periods, in more efficient irrigation
techniques and more expensive equipment for cash crops. Generally, farmers, who
use groundwater, bear all financial, operating and maintenance costs. Groundwater
users usually pay a higher price per volume of water than irrigators who use surface
water, because the latter is usually heavily subsidised.
Third, grey water is the volume of water required to dilute the amount of pollutants
emitted to the natural water system to such an extent that the quality of the ambient
water remains beyond agreed water quality standards (Hoekstra and Chapagain 2008).
This component, however, is difficult to evaluate and beyond the scope of this study.
In this study, we evaluate the green and blue water components of irrigated
crops. A detailed modelling approach was developed to evaluate the monthly
evapotranspirative demand for each crop, province and year (1997–2006) and the
corresponding percentage of blue and green water supplies.
2.3 International Virtual-Water “Trade”
Akin to trade theory, international virtual-water “trade” can be evaluated in terms
of comparative advantage (first explicitly formulated by the British economist
David Ricardo) (Rosegrant et al. 2002) and the fact that natural resources are
unevenly distributed over space and time. It is claimed that nations can profit from
trade if they concentrate on, or specialise in, the production of goods and services
for which they have a comparative advantage, while importing goods and services for
which they have a comparative disadvantage (Rosegrant et al. 2002). In particular, it
refers to the ability of a country to produce a particular good more efficiently and
at a lower opportunity cost than another country. Many water scarce nations save
domestic water resources by importing water-intensive products and exporting
commodities that are less water intensive (Chapagain et al. 2006a). This releases
the pressure on their domestic water resources and avoids the economic costs and
political stress of mobilising the “imported” amount of water (Allan 2003). National
water savings through product imports can translate into global water savings if
10 2 Literature Review
imports originate in countries with higher green and blue water productivity (Allan
2003). Green and blue water productivities vary according to different factors, even
within the same region. For instance, green water productivity may be very high in
a severe drought because a small amount of soil moisture may be used very effi-
ciently by crops. In severe agronomic drought water reservoirs and aquifers may
have ample reserves, providing blue water to entirely meet the water needs of
irrigated crops. In this case, blue water productivity in a particular field may
be lower in relative terms than the green water productivity of a rainfed crop just
across the road.
Whether international trade actually helps alleviate global water stress is still an
issue that has not been settled in the literature (Falkenmarkt and Rockström 2010;
Yang and Zehnder 2010). Nevertheless, an increasing number of authors recognise
this role (Comprehensive Assessment of Water Management in Agriculture 2007;
Aldaya et al. 2008a, 2008b). Worldwide global water savings as a result of trade is
estimated to have reached 450 Gm
3
/year (Oki and Kanae 2004; Hoekstra and
Chapagain 2008).
The pros and cons of the virtual-water “trade” should be weighed, including the
opportunity cost of the associated water (Chapagain et al. 2006b). Some trade
flows may be more beneficial than others simply because of the higher opportunity
cost of the water being saved. Consideration of the green/blue water components
of the traded virtual-water volumes is essential to establish how much farm trade
should be credited with reducing overall water use. For instance, if Australia
exports one ton of cereals to Egypt, about 660 m
3
of water is lost overall, because
the virtual-water content in Australia is 1,590 m
3
/ton, compared to 930 m
3
/ton in
Egypt. However, since wheat is grown on dry land in Australia, but on irrigated
land in Egypt, this is a water-saving exchange in terms of the use of Nile River
water and from the economic and global standpoint (Hoekstra and Chapagain
2008).
The virtual-water metaphor addresses resource endowments but not production
technologies. Hence, the metaphor does not include the concept of comparative
advantage (Wichelns 2004). It can be helpful, though, in motivating public offi-
cials to consider policies that will encourage improvements in the use of scarce
resources, but comparative advantages must be evaluated to determine optimal
production and trading strategies (Wichelns 2004). Furthermore, political and
economic considerations often outweigh water scarcity concerns, limiting the
potential of trade as a policy tool to mitigate water scarcity (Fraiture et al. 2004).
In line with Yang and Zehnder (2008), globally, the volume of virtual water associ-
ated with crop trade is about 15% of the total water used in crop production
(Chapagain et al. 2006a; Hoekstra and Chapagain 2008). Of this amount, only
20% of virtual-water “trade” seems to be due to water scarcity (Chapagain et al.
2006a; Hoekstra and Chapagain 2008). Therefore, less than 3% of the virtual-
water “trade” is due to water scarcity. This is a fact that needs to be assessed in
more detail, because it might mean that the pervasive concept of water scarcity is
overstated or perhaps that the scarcity of land and physical or human capital may
be more important than water scarcity.
11
2.4 Water Footprint Concept and Its Relation to Economic Growth
In addition to the criticisms levelled against the concept of virtual-water “trade”
in terms of international trade theory, there are a number of limitations that must be
given some consideration. First, Grote et al. (2008) consider the scarcity of land,
nitrogen, phosphorous and potassium, in addition to water scarcity. The virtual flow
of nutrients should enter the picture, along with land and water, as another limiting
factor in production. However, adding in more factors makes this equivalent to an
international trade in goods, with considerations of prices and values; mainstream
economics would prescribe focusing on competitive advantage instead of just one
factor’s productivity. The difference between water and other variable inputs such
as fertilisers is that, in the short term, water supply is very inelastic and not substi-
tutable in crop production. And, more fundamentally, it is not a marketable good,
which means that societies must either “produce” it internally with capital goods
(infrastructure) or import it embedded in other goods. This, in essence, is the underlying
principle initially posed by Prof. Allan when he developed the idea of virtual-water
“trade”.
Roth and Warner (2008) consider various policy implications and consequences
for a country or region resulting from the choice to rely on food imports instead of
investing in infrastructure or subsidising domestic production. Basically, their point
is that focusing on virtual-water “imports” is not a neutral policy for a water-scarce
country, since this affects, among other things, urbanisation, rural–urban migration
and income distribution. Berrittella et al. (2007) show that expanding farm trade
generates overall welfare gains, but also winners and losers among trading partners.
Through the use of Computable General Equilibrium (CGE) models, the global
effects of water supply constraints in major trading partners can be identified, as
well as how these constraints affect food prices at a global scale. To what extent
water resources are mobile across water-scarce sectors has an impact on the size of
welfare losses and gains. Domestic flexibility, meaning water re-allocation driven
by market signals, is required to create larger welfare gains. Again, this idea that a
factor’s mobility through trade can generate welfare gains is at the core of interna-
tional trade theory. This report also shows the importance of agricultural trade
distortions in the global welfare effects of virtual-water “trade”.
Verma et al. (2008) argue that virtual-water “trade” may be exacerbating water
scarcity in water-stressed regions in India. In explaining virtual-water flows, these
authors identify key explanatory factors other than water scarcity, including per
capita gross cropped area (an indicator of land concentration and population
density) and access to secure markets (an indicator of institutional performance).
2.4 Water Footprint Concept and Its Relation
to Economic Growth
The water footprint (WF) is a consumption-based indicator of water use (Hoekstra
and Hung 2002). The WF of an individual or community is defined as the total
volume of freshwater that is used to produce the goods and services consumed by
12 2 Literature Review
the individual or community (Hoekstra and Chapagain 2008). The total water footprint
in a country includes two components. First, there is the internal water foot-
print, which is the volume of water taken from domestic water resources to produce
the goods and services consumed by the inhabitants of the country (Hoekstra and
Hung 2005). Second, there is the external water footprint, which is the volume of
water used in other countries to produce goods and services imported and
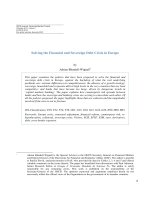
consumed by the inhabitants of that country (ibid.). In Fig. 2.1, we plot the internal
and external water footprints both in absolute and relative terms (based on Hoekstra
and Chapagain 2008). Note the sizable external per capita footprints of the Netherlands,
Japan, the UK, Spain and France, which are large importers (and exporters, in the
case of Spain and France) of farm products. The USA, Canada and Spain stand
among the countries with the largest internal per capita footprints. In the present
study, we particularly highlight the relevance of virtual-water “exports” and “imports”
for the economic life of many countries, including Spain. Our work also aims to
frame water footprint evaluations in a policy-relevant context.
As Fig. 2.1 shows, there is no simple pattern for the influence of economic
growth on water footprints. Water use depends on a multiplicity of factors such as
global change, including climate change, population growth and social changes,
and water makes demands on other sectors such as energy production and ecosystem
services. A few studies about the influence of economic growth on water use have
been carried out in Spain (Fundación Encuentro 2008). These concur with the
results that various authors have reached regarding the USA (Solley et al. 1998;
Dziegielewski and Kiefer 2006). These authors have found that since 1980 water
withdrawals have remained quite stable, even where population and per capita
0
0.5
1
1.5
2
2.5
0
Argentina
Australia
Brazil
Canada
China
Egypt
Spain
United States
France
India
Japan
Morocco
Netherlands
UK
Russian Fed
Syria
200
400
600
800
1000
1200
Internal WF (1000 hm
3
/year) (Left axis)
Internal per capita WF (1000 m
3
/ person) (Right axis)
External per capita WF (1000 m
3
/ person) (Right axis)
Fig. 2.1 Internal and external water footprints of several countries. Based on Hoekstra and
Chapagain (2008)
13
2.4 Water Footprint Concept and Its Relation to Economic Growth
Gross National Income (GNI) have increased significantly. As will be shown in
Chap. 7, Spain has followed a similar path since the early 1990s.
There is no simple pattern for the impact of economic growth on water foot-
prints. Depending on the country, markets and prevailing policies, the outcome will
be different and WFs will either increase or decrease as the production of goods and
services expands. In order to analyse the extent to which economic growth has an
influence on WFs, the variables through which growth can affect the footprints
outcome must be examined. These are scale effects, sectoral composition and
technological change.
2.4.1 Scale Effects
Economic growth is measured as the increase in the value of goods and services
produced (Neumayer 2001). The resulting increase in the scale of production may
be accompanied by greater use of natural resources (Atkinson et al. 1997; Brack
and Branczik 2004; Chapagain and Hoekstra 2004). If this goes along with
increased international trade, it may mean that a given country will deplete natural
assets abroad by importing the natural resources it needs (Atkinson et al. 1997).
This is a result of market failures, such as ill-defined property rights, inadequate
resource pricing and a failure to incorporate environmental externalities (Brack and
Branczik 2004).
Economic growth is accompanied by changes in consumption patterns. In line
with Chapagain and Hoekstra (2004), meat consumption rapidly increases with
GNI growth up to a certain level of income (about US$ 5,000/year) and then
becomes less and less sensitive to change in GNI per capita. This is the case of
emerging countries such as BRIC (Brazil, Russia, India and China), where diets
are changing significantly towards water-intensive meat and dairy consumption
(Comprehensive Assessment of Water Management in Agriculture 2007).
On the other hand, the increase in overall financial capacity may both supply
more resources for environmental protection and support greater demand for
environmental-friendly goods (Neumayer 2001). Growth enables governments to tax
and raise resources for different objectives, including pollution control and general
environmental protection (Bhagwati 1993). The potential for reducing per capita
consumption of natural resources depends in part on income level (WWF 2004,
p. 20). Though still contested, empirical evidence shows that environmental awareness
is often conditioned by the so-called Environmental Kuznets Curve (EKC), which
links environmental quality (e.g. some specific pollutants) with per capita income.
Ecological or environmental awareness develops when the country reaches a certain
level. However, Neumayer and Cole (2005) found evidence to suggest that emission
reductions in developed countries are a result of increased consumption of pollution-
intensive products imported from developing countries. Countries may also reduce
their internal water or ecological footprint by increasing the external water footprint
in exporting countries. For instance, the estimated water footprint of an average
14 2 Literature Review
Briton shows that two-thirds of this footprint originates outside Britain (Chapagain
and Orr 2008b). This study will look in detail at Spanish internal and external foot-
prints and their pattern and evolution from 1996 to 2006.
Questions about the EKC, therefore, still remain. Mukherji (2006) has recently
shown how the curve applies to many regions in the world in relation to water
resources.
In the case of Spain, a recent study published by Fundación Encuentro (2008)
shows that economic growth, measured as an increase in both regional GDP and per
capita GDP, is apparently not related to variations in water use. Nevertheless, this
result could lead to misleading interpretations in the absence of footprint evaluations,
since the results might be different if other spatial and temporal dimensions were
considered.
2.4.2 Sectoral Composition
Shifts in economic structures are accelerated by economic growth (Brack and
Branczik 2004). Economies usually develop from primary resource extraction,
through processing, to manufacturing and then to services. Each step tends to lead
to a reduction in pollution output and resource depletion, though the correct pricing
of environmental externalities is a key factor (ibid.).
Furthermore, allocative efficiency gains from specialisation in the production of
goods or services where a country has a comparative advantage can lead to a reduction
in global WF accounts, if correct national and international incentives and/or regula-
tions are in place. This point is raised by Berrittella et al. (2007). However, the water
literature does not offer any example that shows water allocation efficiency gains
resulting from changes in water use in a given sector. In fact, the causality is probably
reversed, so that as the tertiary sector economy grows in relative terms at the expense
of the agricultural and industrial sectors, water is generally re-allocated, either
through water markets or by government agencies. This can even occur within the
agricultural sector, as has already been seen in Spain and in Australia.
At the global level, neo-Malthusian predictions have recently gained prevalence,
partly as a result of sharp food price increases in 2008 (Formas 2008). Doubts exist
as to whether the world will be able to provide enough food for all its people on the
horizon of 2030–2050, but few analysts today have concluded that there will be
technical advances preventing this. Kuylenstierna et al. (2008) point that total water
used for agriculture should increase from 7,000 to 10,000 km
3
in order to provide
a diet of 3,000 kcal per person with 70% plant and 30% animal components.
UNESCO (2008) has estimated that irrigated land should increase 30% by 2030 for
a similar diet. If, to this increased water demand, we add the projected impacts of
climate change on the agriculture in the tropics (Battisti and Naylor 2009), there are
reasons for concern. The increase in irrigated acreage does not seem to be limited
by available renewable water resources, as Fig. 2.2 shows, but by investment in
infrastructure and the lack of human capital required to move from subsistence to
commercial agriculture.
15
2.4 Water Footprint Concept and Its Relation to Economic Growth
2.4.3 Technological Change
Exogenous technological change is generally due to new production methods.
Endogenous technological change is determined by trends in output and input
prices, market structure, economic incentives and improvements in physical and
human capital. The potential of economic growth to gain access to modern tech-
nologies in the international markets and employ less resource and pollution-
intensive technologies may help reduce WFs. Growth may be beneficial for the
environment due to its potential effects on the kind of technology used by domestic
producers (Neumayer 2001; Brack and Branczik 2004; De Soysa and Neumayer
2005). For instance, water productivity in agriculture can be improved by applying
advanced rainwater harvesting and supplementary irrigation techniques.
Furthermore, growth-induced trading regimes that are open to foreign competition
and the constant need for technological progress force a country’s producers to stay
abreast of the latest technological advances (Neumayer 2001). This modern
technology generally consumes fewer water resources and generates less pollution
to produce the same amount of goods and services (Chapagain and Hoekstra 2004).
The increased dissemination of more efficient and less polluting technologies can
lighten water footprints.
Finally, the hypothesis that economic growth might benefit the environment is
the most disputed (Neumayer 2001). Income growth might or might not reduce the
load on the environment, but it does not guarantee smaller WFs. The net effect on
the water use, as well as on the environment, will depend on the kind of economic
growth we see (Bhagwati 1993). The European Union’s sustainability report shows
that for almost all environmental indicators, economic growth must be based on
progressively fewer physical, chemical and environmental needs (EC 2007). Any
environmental indicator divided by € of GDP exhibits a downward trend, but in
absolute terms many of the indicators are still growing. Since, in mature water
05 000 10 000 15 000
Latin America and Caribe
East and Southeast Asia
Subsaharan Africa
South Asia
Middle East and North
Africa
Withdrawals (2000)
Withdrawals (2030)
Renewable resources
km
3
Fig. 2.2 Water uses and renewable resources in selected world regions (Based on Comprehensive
Assessment of Water Management in Agriculture 2007)
16 2 Literature Review
economies, domestic water resources are generally limited, it is instructive to see
whether a country’s external water footprint grows along with its economy. If this
is the case, then its economic progress could still be coupled to water resources,
though abstracted and integrated in the exporter’s production processes. This study
asks whether and to what extent Spain’s economy is still dependent on its internal
and external water footprints.